


August was a bearish month for the cryptocurrency market. This was evident in both Bitcoin (BTC) and various other altcoins.
While there is hope that a bullish reversal will begin in September, these four bearish cryptos have a negative outlook, indicating that the worst is yet to come.
DASH Falls to Lowest Price Since 2017
The DASH price has fallen since its all-time high of $1,625 in December 2017. Two years later, the price bounced at the $40 horizontal support area (green icon), creating a long lower wick and initiating an upward movement.
However, the DASH price reversed bearishly once more in May 2021. In July 2023, it finally broke down from the $40 horizontal support area, reaching a low of $23.86 on August 17. This was the lowest price since February 2017.
The weekly RSI supports the continuation of the decrease. When evaluating market conditions, traders use the RSI as a momentum indicator to determine if a market is overbought or oversold, and to decide whether to accumulate or sell an asset.
If the RSI reading is above 50 and the trend is upward, bulls still have an advantage, but if the reading is below 50, the opposite is true. The indicator is below 50 (red icon) and falling, both signs of a bearish trend.
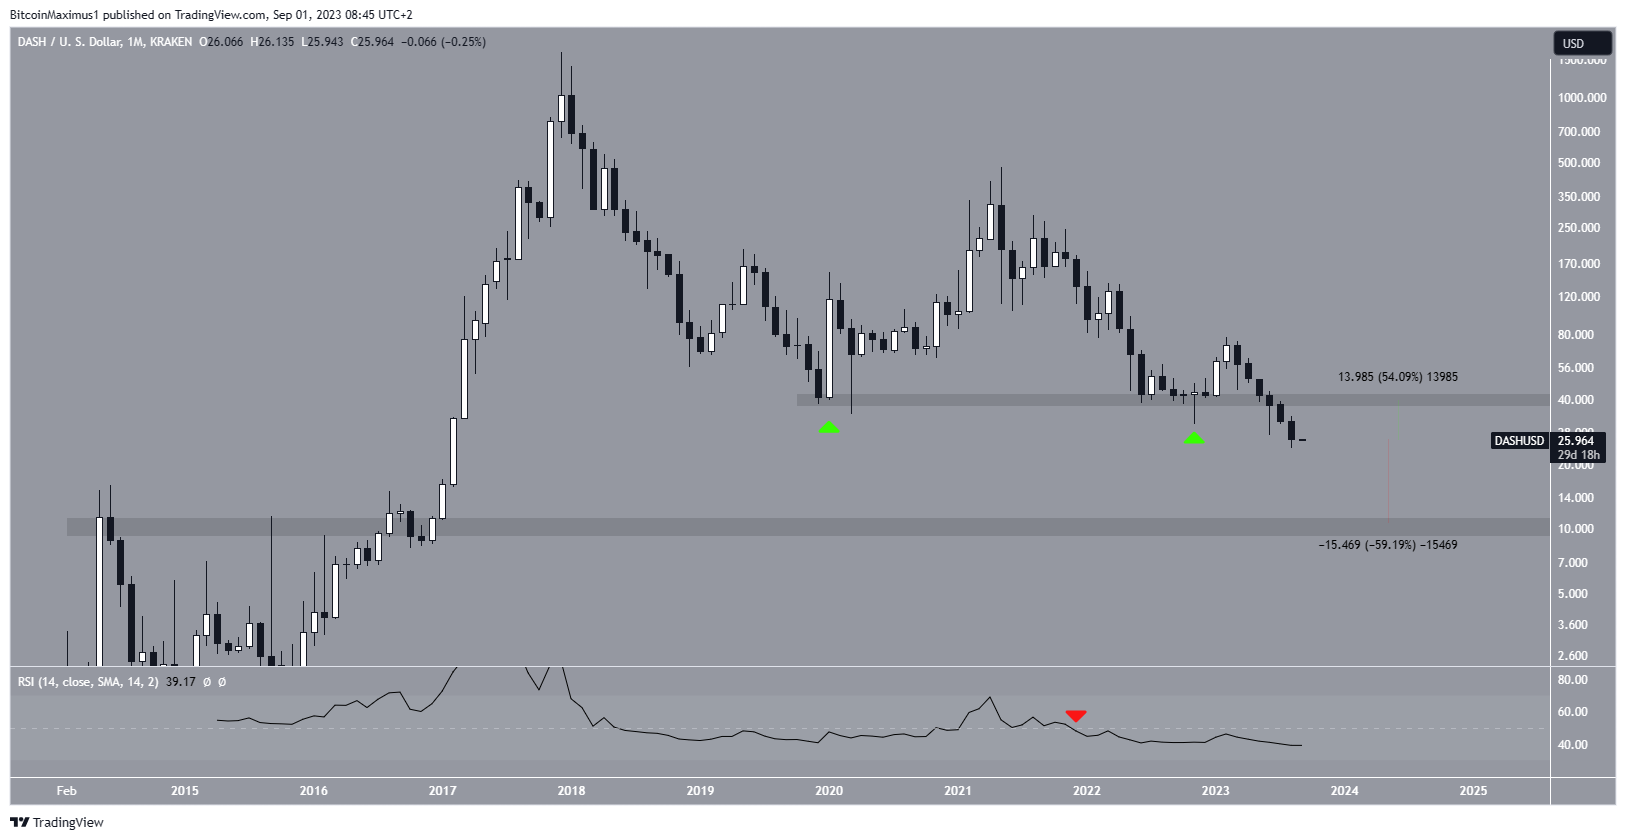
If the decrease continues, the next closest support area will be at $10, a drop of 60% measuring from the current price. On the other hand, a return to the $40 resistance area will amount to an increase of 55%.
Algorand (ALGO) Falls to All-Time Low
The ALGO price has fallen since its high of $2.99 in November 2021. The decrease has been swift and without a retracement, following a steep descending resistance line. More recently, the line caused a rejection in April 2023.
Afterward, ALGO broke down from the $0.11 horizontal area and reached a new all-time low of $0.08 on August 17. Then, ALGO failed to bounce and close above the $0.11 horizontal area. Moreover, it still follows the aforementioned descending resistance line.
Since the price is at an all-time low, the external Fib retracement can be used to determine the next support level. Doing so leads to a support level of $0.072. This is a drop of 25% measured from the current price.
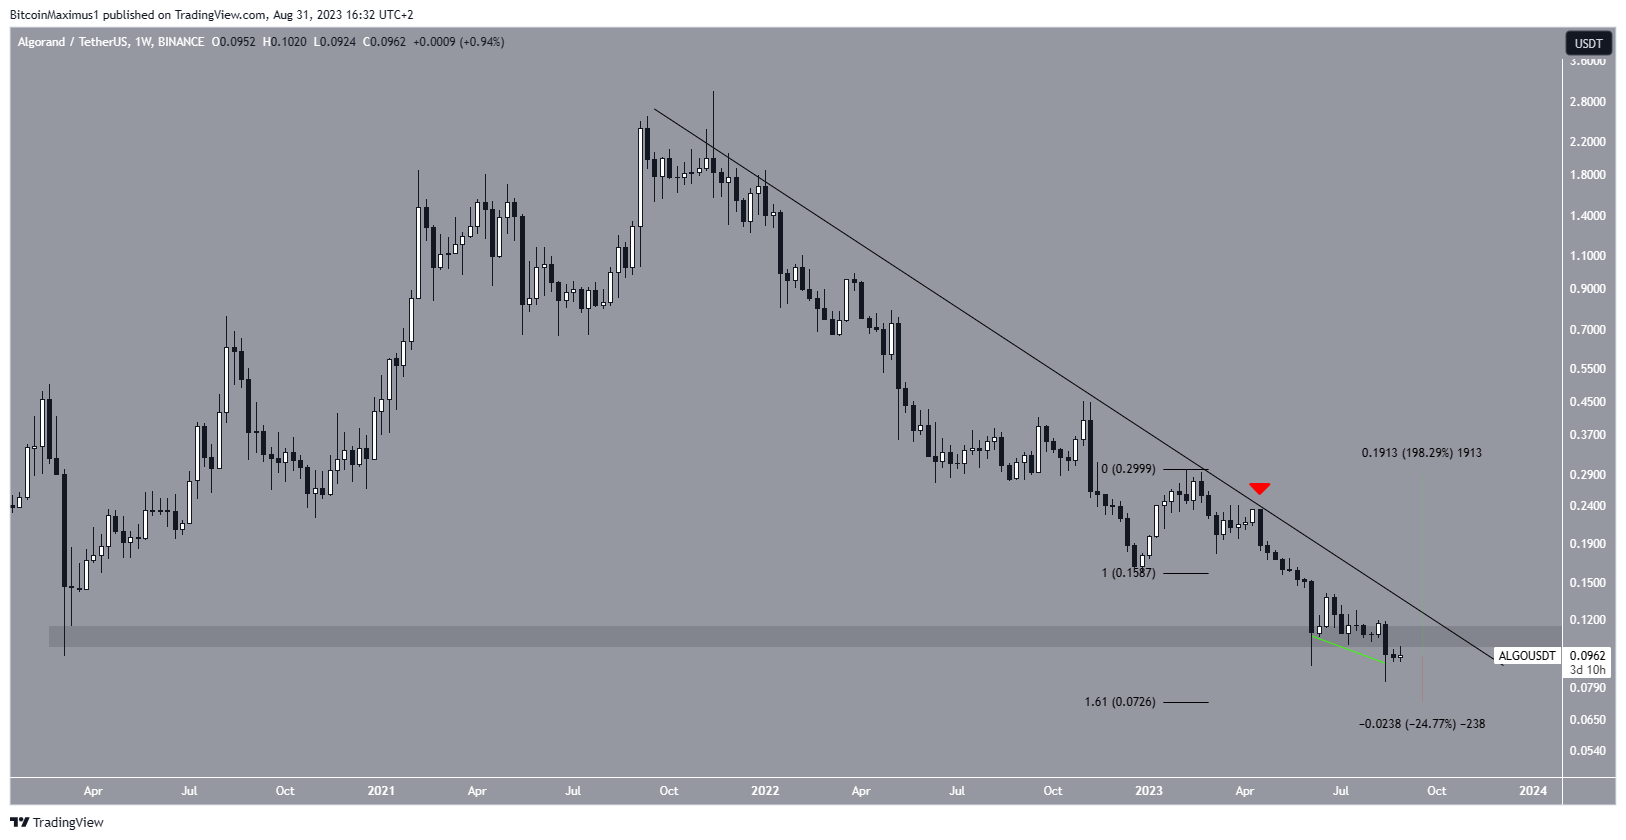
On the other hand, reclaiming the $0.11 area and breaking out from the long-term resistance line can cause a 200% increase to the next resistance at $0.29. Currently, this seems unlikely to occur.
EOS Price Approaches All-Time Lows
The EOS price has fallen since creating a lower high in June 2021. Over the past year, it bounced at the $0.90 horizontal support area several times. However, the June breakdown invalidated the validity of the support area. The decrease led to a near-all-time low of $0.50 on August 17.
While EOS has increased slightly since the bounce has been largely insignificant. The price is still 50% below the $0.90 horizontal area, which is now expected to act as resistance.
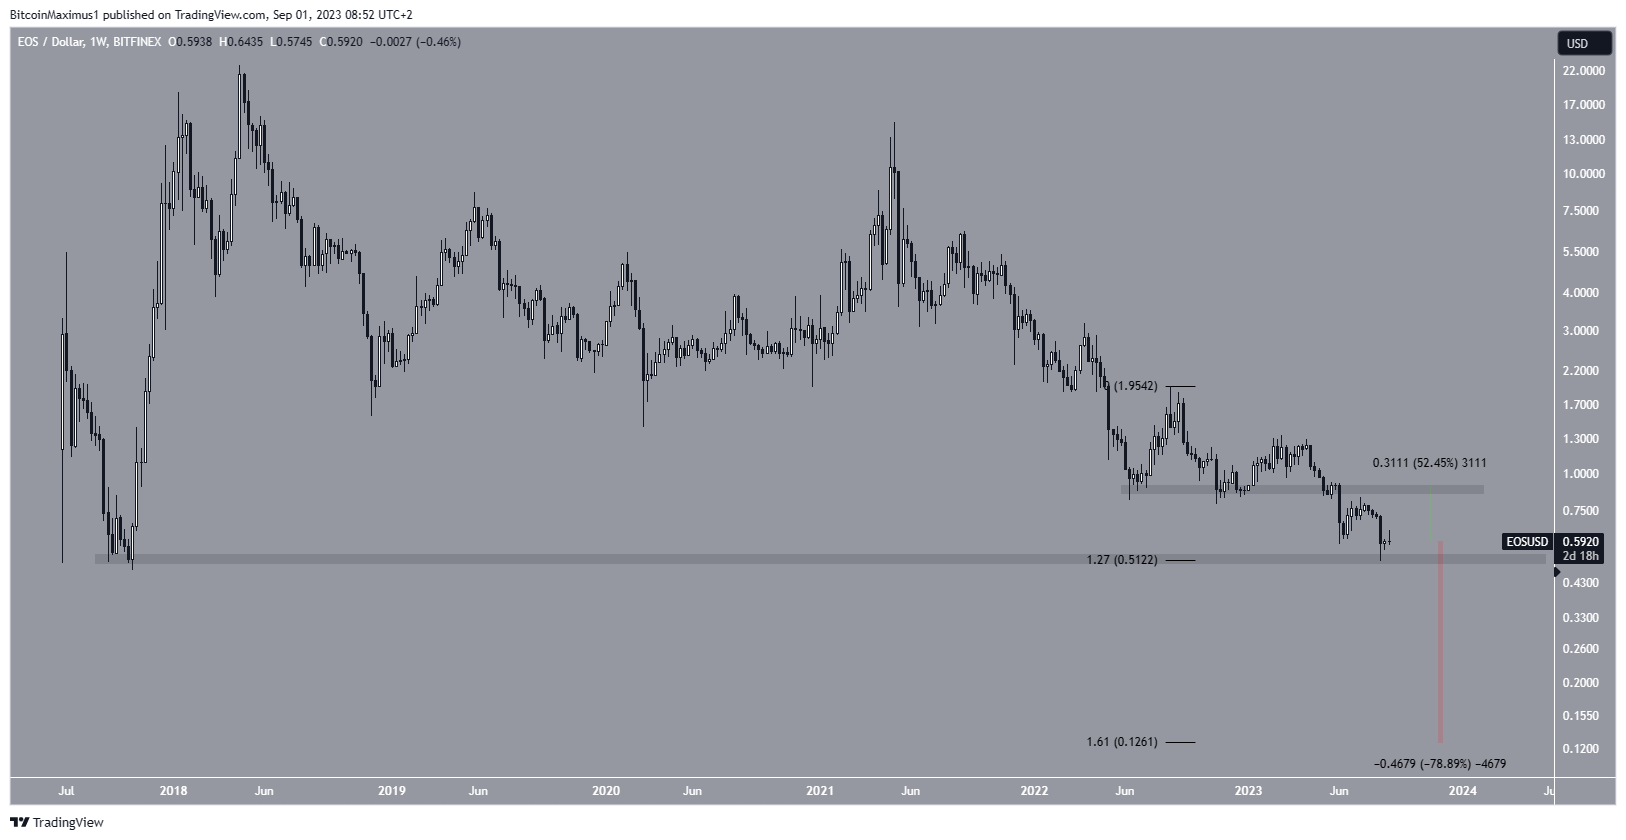
So, the most likely EOS price prediction is bearish. if EOS breaks down from the $0.50 horizontal area, it could decrease by another 80% and reach the next Fib support at $0.13.
Tezos (XTZ) Concludes Bearish Cryptos
The XTZ price has traded inside the $0.72 horizontal support area since the end of 2022. During this time, it thrice (green icons) bounced inside the area. However, each bounce has been weaker than the previous one. This signifies waning momentum and suggests that bears are gradually taking over. Therefore, an eventual breakdown from the $0.72 area could occur soon.
Read More: Best Upcoming Airdrops in 2023
The presence of a descending resistance line further supports this bearish XTZ price prediction. If XTZ breaks down, it can fall by 30%, reaching the next support at $0.50. This would be very close to the all-time low price of $0.48.
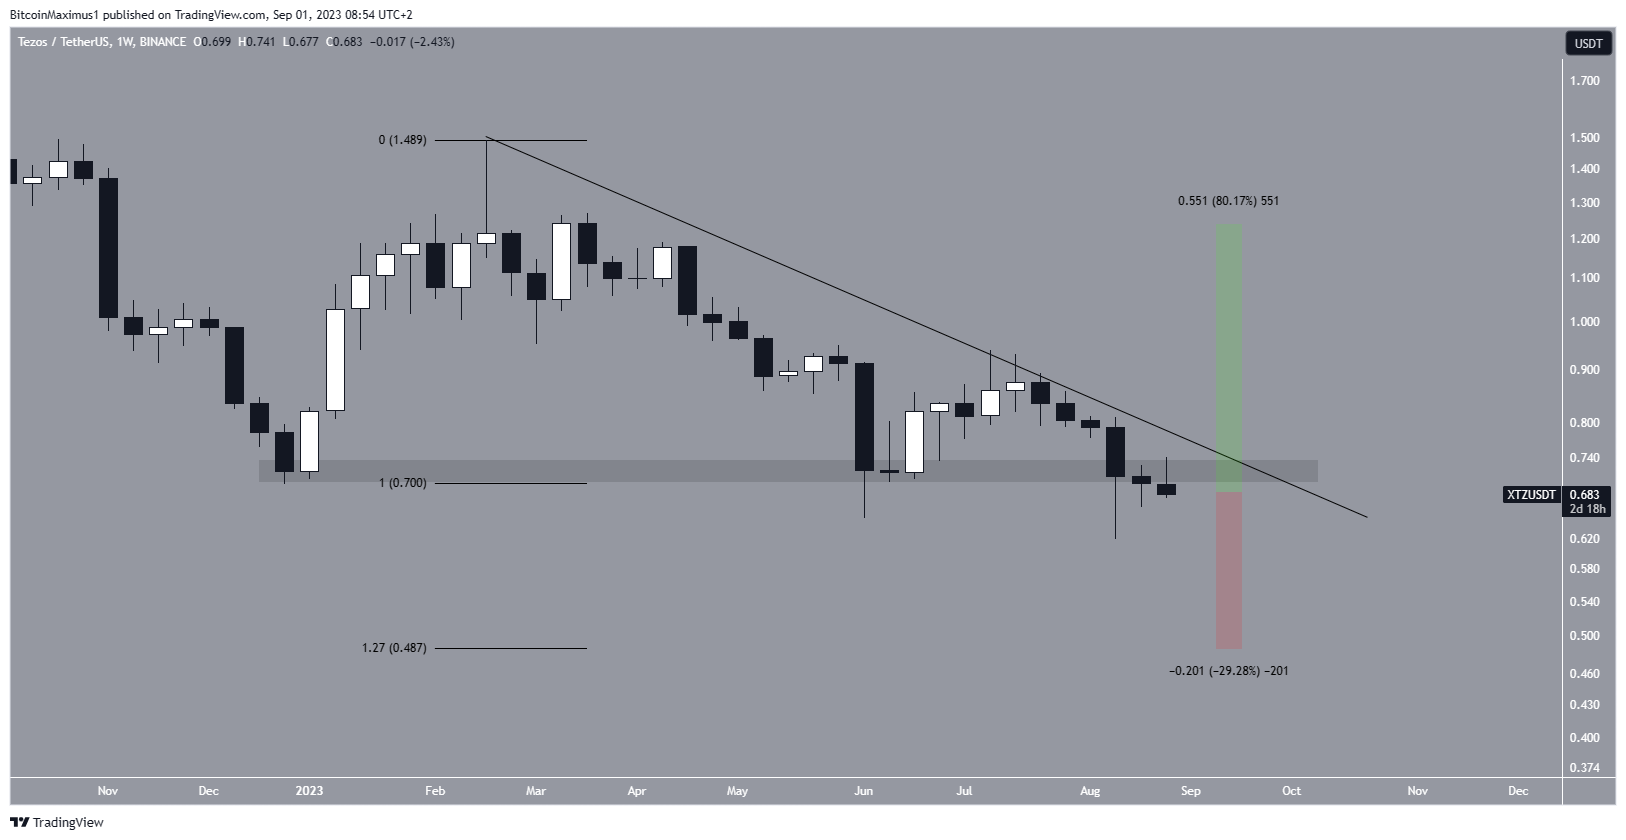
On the other hand, a breakout from the resistance line will mean that the trend is bullish and can lead to an 80% price increase to $1.25.
For BeInCrypto’s latest crypto market analysis, click here


