
Envisioned as an improvement over Bitcoin, Dash primarily focuses on creating a globally relevant payments network. Dash identifies itself as a fork of Litecoin, one of the more popular Bitcoin Forks. This Dash price prediction covers the cryptos potential price path up to 2030.
NOTE: This article contains out of date figures and information. It will be updated with fresh analysis for 2025 and beyond in the New Year. In the meantime, please see our Dash price prediction tool for the most recent, data-informed projections.
- Dash price prediction and fundamental analysis
- DASH price forecast and tokenomics
- Dash price prediction and other key metrics
- DASH technical analysis and price prediction
- Dash (DASH) price prediction 2023
- Dash (DASH) price prediction 2024
- Dash (DASH) price prediction 2025
- Dash (DASH) price prediction 2030
- Dash (DASH’s) long-term price prediction until the year 2035
- Is the Dash price prediction model accurate?
- Frequently asked questions
Dash price prediction and fundamental analysis
Dash, the project, aims to further the progress of decentralized payments. And in doing so, it aims to become cheaper and faster than Bitcoin — the very codebase it took inspiration from.
Did you know? Dash was originally christened XCoin followed by another name change to Darkcoin. This crypto came into existence in 2014, and introduced the novel concept of Masternodes.
Dash boasts a two-tiered approach to decentralized payments. While the first tier offers a standard blockchain built on a PoW consensus, the second tier offers scope for private transactions and instant finality. Hence, Dash has a wide range of use cases.
From a fundamental perspective, Dash aims to make transactions more secure. As for the native crypto, DASH is the currency used to make the aforementioned decentralized payments.
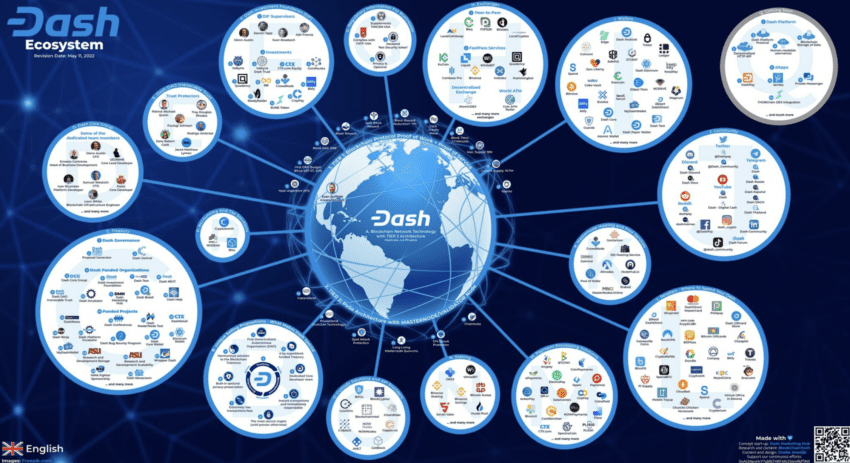
Further, Dash boasts one of the oldest DAOs, with on-chain crypto-specific governance playing a major role in its operations. Here are some of the additional insights that can help you make better fundamental calls:
- The Dash ecosystem promises a 1-second transaction finality.
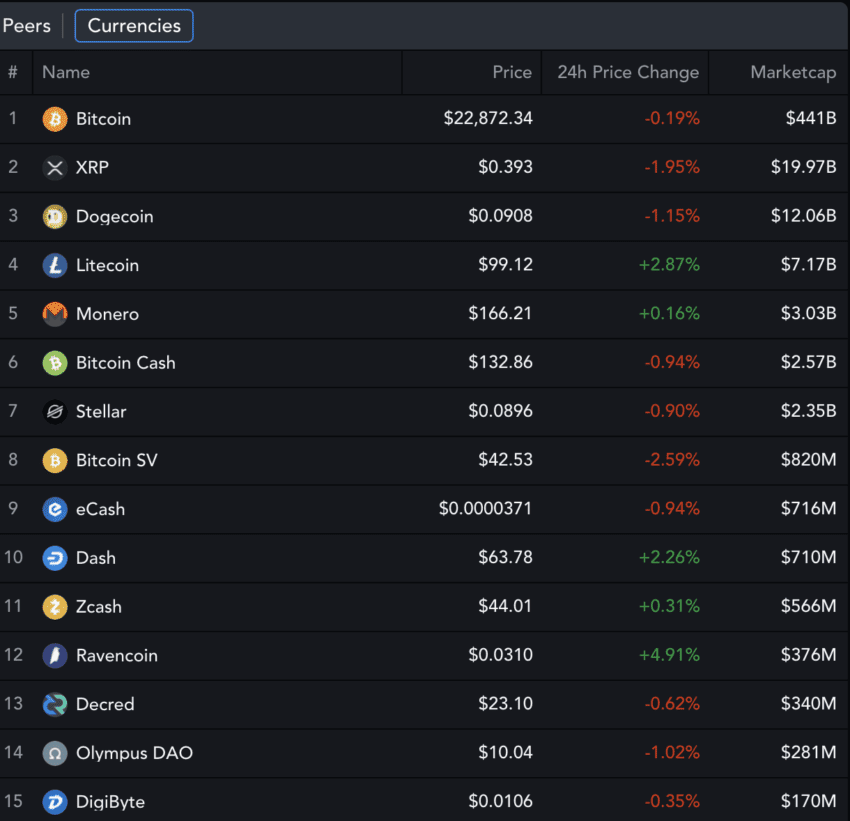
- As of Q4 2021, over 265 parties and exchanges had DASH listed.
- The median transaction counts up until Q4 2021 stood at over 8220.
“We have great developers working for the project that are more than enough to complete it.”
Evan Duffield: Founder of Dash: X about Masternodes
Here is what the entire ecosystem looks like:
DASH price forecast and tokenomics
As mentioned, DASH is monetary crypto, with the coin only having the utility of facilitating transactions. Note that security and privacy are the traits offered by the Dash ecosystem. Also, as it is a decentralized currency, DASH has an over-the-counter trading presence and DeFi-specific utility.
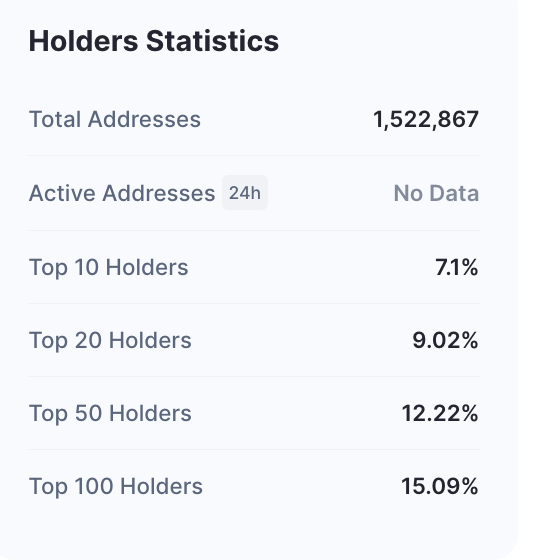
DASH comes with a supply cap of 18.9 million DASH coins, and the current decreasing issuance rate is 4.28%. Further, it’s promising from an investment point of view that the top 100 DASH holders only control close to 15% of the circulating supply, as of February 2023. Hence, the token economics model looks fairly transparent.
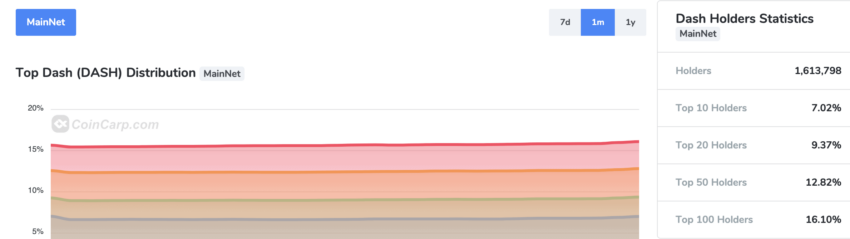
The token distribution figures haven’t changed much as in December 2023, only 16% of the supply is controlled by the 100 top holders.
Dash price prediction and other key metrics
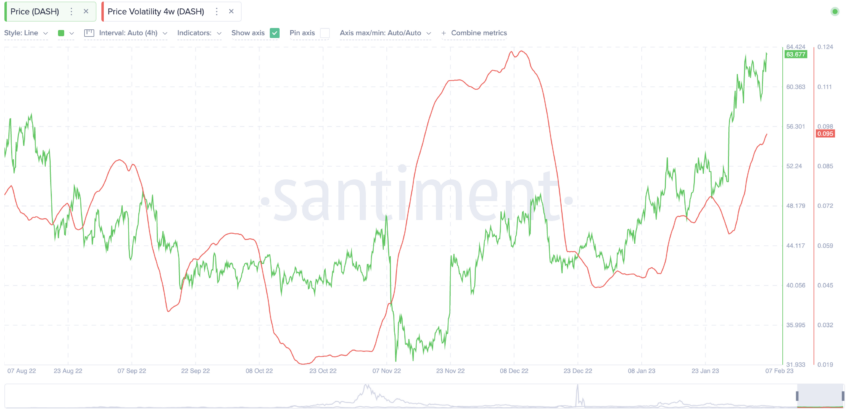
Looking at DASH’s 4-week volatility chart in February 2023, we can see an interesting trend. When a bottom is formed at the volatility counter, the prices tend to increase. However, the February trend seemed upward, which led to a short-term correction at DASH’s counter.
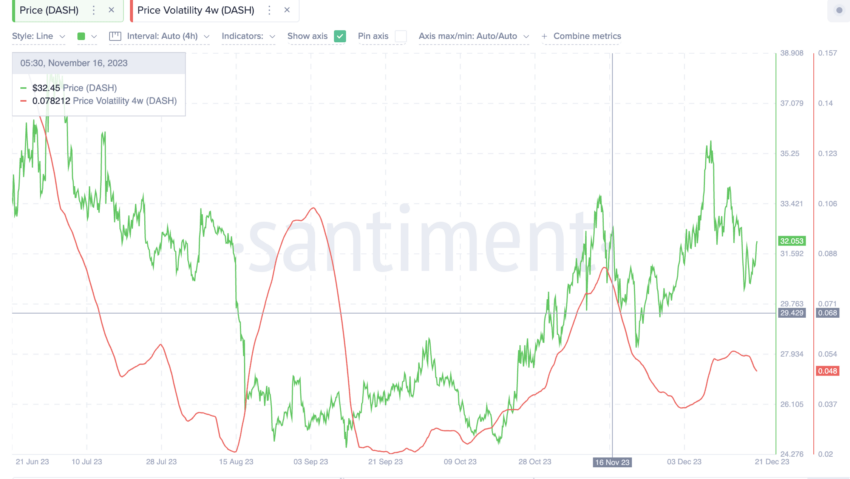
Now if we look at the latest volatility chart, as of December 2023, the level seems to have dropped and seems low despite attempting a rise. This shows that the price of DASH might finally be going into the low volatility zone, which is an optimistic indicator.
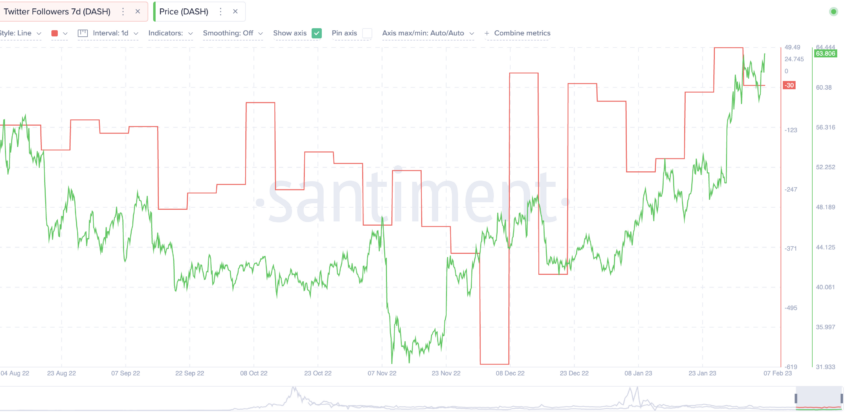
Since August 2022, the price has only breached the Twitter follower trendline twice. The first time was in early August, after which there was a considerable price drop despite the steady follower count. Something similar happened on Feb. 7, 2023— a development that triggered some consolidation at DASH’s counter.
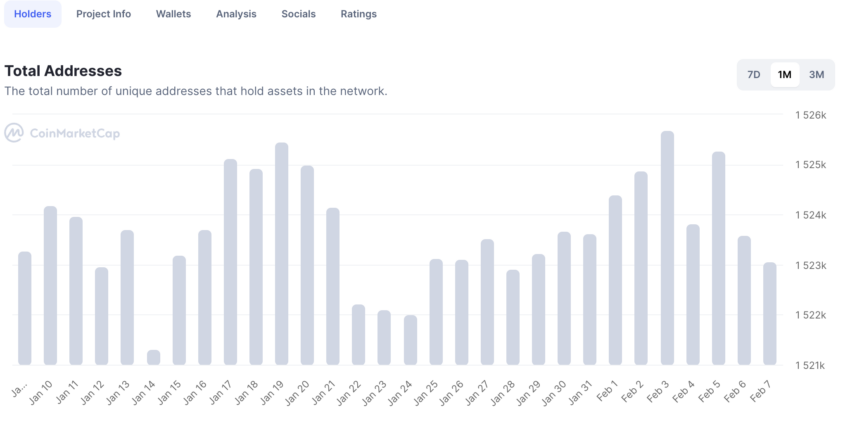
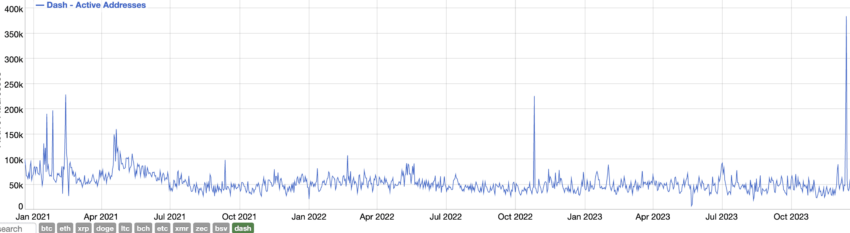
Even the number of unique DASH holding addresses has blown hot and cold over in February 2023.
Also, if the active address count is to be tracked, the numbers have spiked recently, closer to December 2023. This development might be bullish, price-wise.
We will examine the short-term price action and expectations during technical analysis.
DASH technical analysis and price prediction
Yes, Dash boasts ultra-fast transaction speed and offers optional privacy. Yet, it is important to delve deeper into the technical analysis to know where the future price of Dash coin is headed. However, before we move any further, here are a few insights to keep in mind:
- Looking at DASH’s year-long trading volume chart, you can see the market cap and trading volume dropped gradually.
- The drop in trading volume might lead to a short-term correction.
- Lately, the market cap has made a couple of higher highs, which might indicate that the tables are turning for the DASH prices.
- The short-term chart signifies a bullish zone for the price of DASH.
Our early 2023 analysis
We evaluated the price chart of DASH successfully, as the resistance level of $64.84 was breached. Here is how we approached the same previously.
Even though the formation looks similar to a descending triangle, DASH seems to be trading close to the upper descending trendline. Any breach above the line or the price level of $64.84 might push the future price toward $72.81. Moreover, a drop below $56.88 might just invalidate this trend.
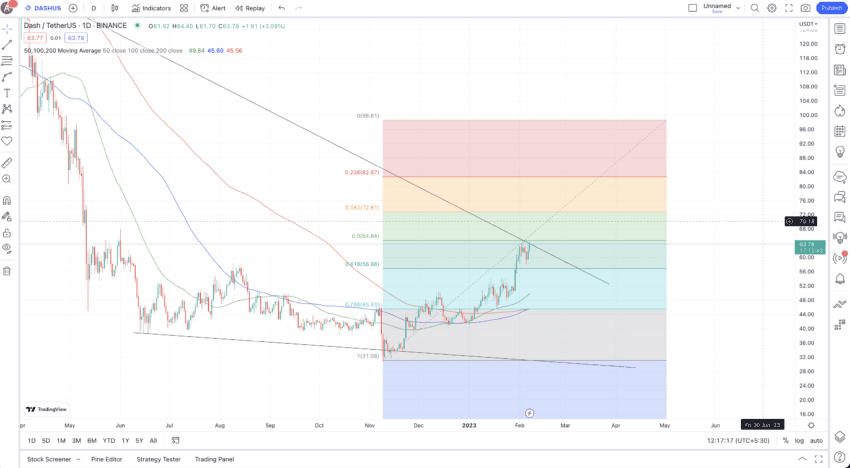
What is optimistic, though, is the blue line (100-day moving average) crossing above the red line or the (200-day moving average). If this golden crossover becomes clearer over the next few trading sessions, we might see DASH’s price increase from the current levels.
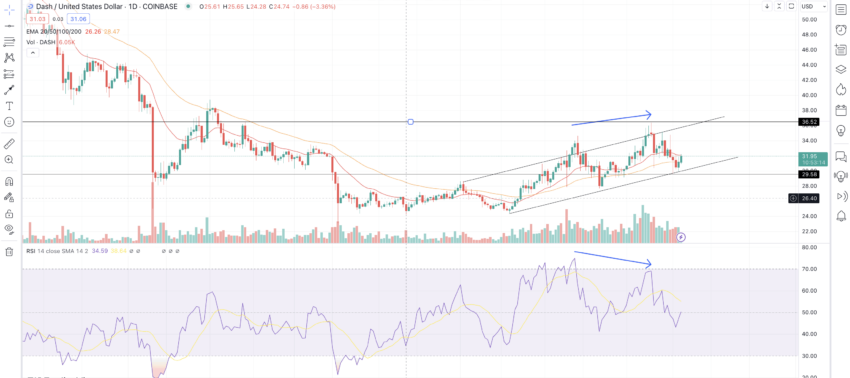
Our December 2023 analysis
The ascending channel pattern followed by a recently concluded bearish RSI-led divergence doesn’t look bullish for DASH in the short term. Additionally, DASH is taking support near the lower trendline, and a breach under $29.58 could push the prices lower. However, a breach above the upper trendline and the crucial resistance of $36.52 can push the prices higher in 2024.
Pattern identification
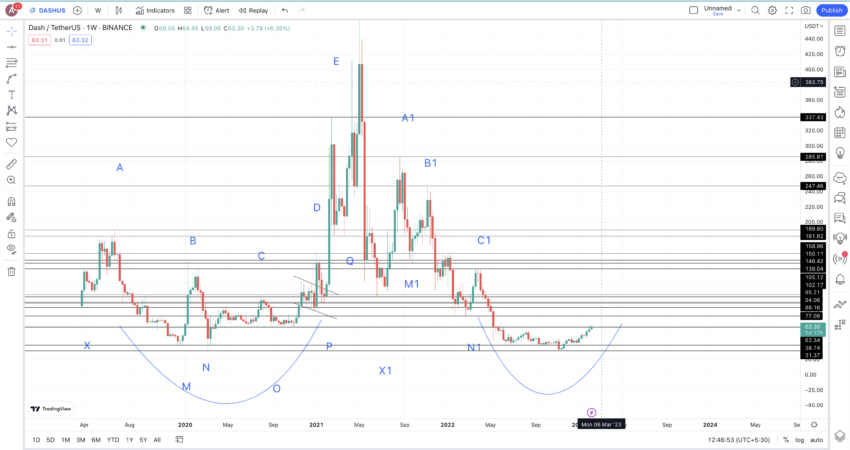
Let us now look at the weekly chart to analyze the broader trend. Notice that you can see a cup forming at DASH’s counter. And the formation looks similar to the one marked previously on the chart via the blue curve.
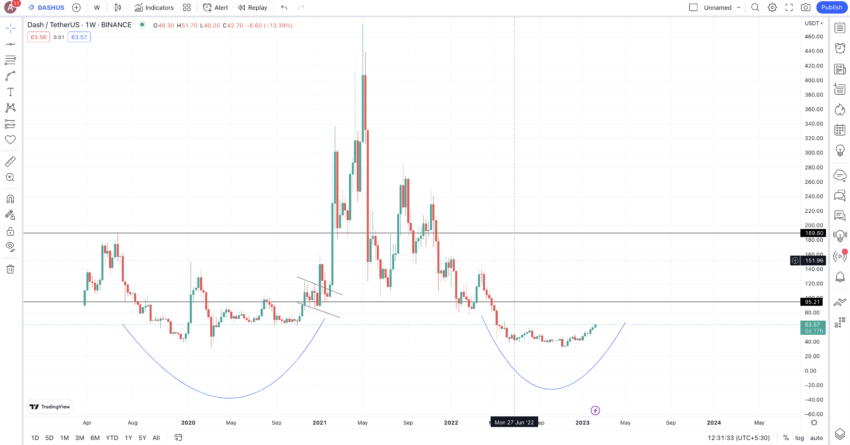
This shows that the weekly price chart doesn’t follow a foldback pattern but a forward marching pattern. It is time to mark the key highs and lows on the price chart to locate the next DASH price forecast levels.
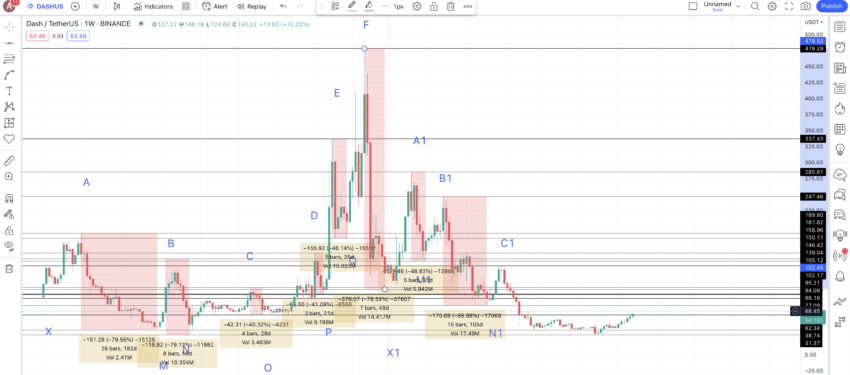
Here is the weekly chart with all the lows and highs marked for your reference. Each level might also act as resistance and support for DASH, offering several price prediction options.
Price changes
Let us now plot the price change percentages and distances between the lows and the highs. We shall use two separate tables, as it will then be easier to calculate the average values.
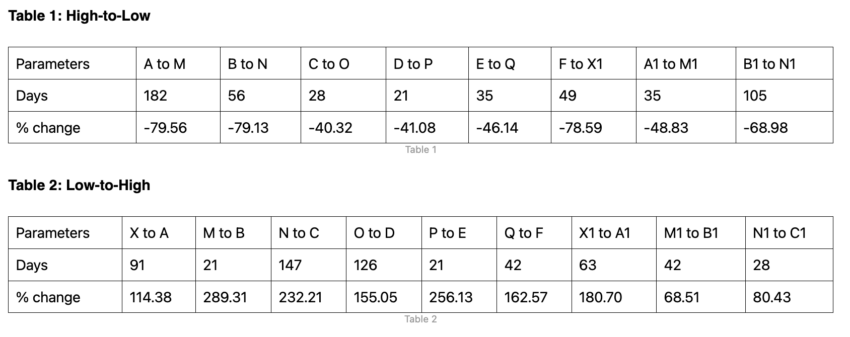
Based on the table data, we can determine the average values for the subsequent high-to-low and low-to-high movements. The average for a high-to-low activity is approximately 58.7275% over 61 days, with a maximum timeframe of 182 days. This longer timeframe might be expected if the cryptocurrency market continues its upward trend.
Conversely, for a low-to-high movement, the average is about 170.62% over 68 days, with a potential maximum timeframe of 147 days, which could occur if the crypto market shows weaker performance. It’s important to note that these average price percentage changes are provisional. The actual movements could vary within the range outlined in the tables, depending on the state of the Dash Network and the overall health of the broader cryptocurrency market.
Checking the levels
We shall now use the findings to start Dash price forecast points.
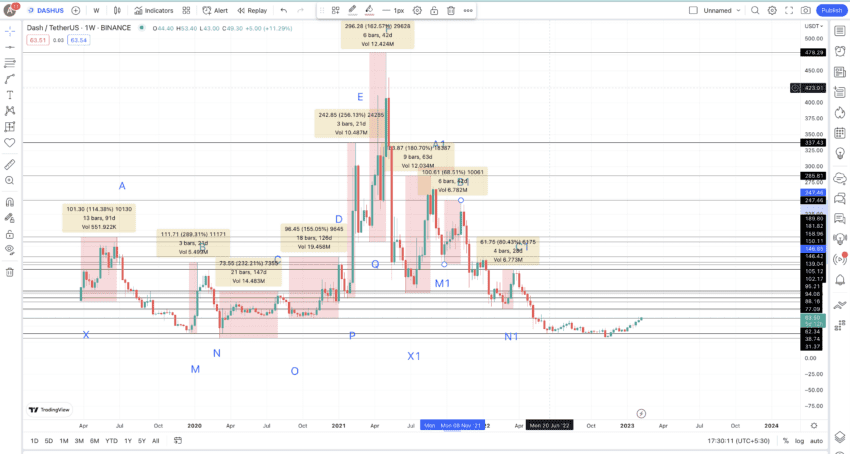
But before we proceed, let us plot the next low from the last point we have on the chart — C1. Using the average high-to-low data, we can expect a dip of almost 58.73% in 182 days max. Notice that the next low, or O1, surfaced at $31.67 in early November, following a dip of -77.25%. Further, notice that it aligns with values from our previous high-to-low table.
Dash (DASH) price prediction 2023
We expected a high of almost $86. Yet, DASH didn’t disappoint, and we still managed to go as high as $74.33. Here is how our analysis read:
From the last low or O1, we can expect DASH to increase by 170.62% in 68 days (maximum 147 days) per the low-to-high average. This kind of surge looks possible, considering the current state of the crypto market and the momentum at DASH’s counter.
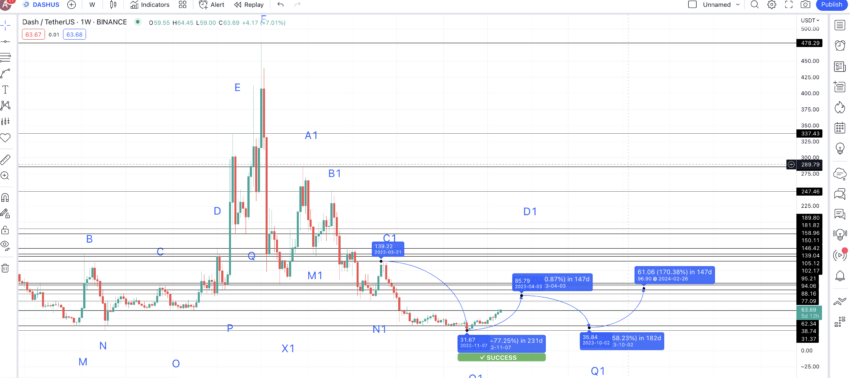
Suppose we take the maximum distance and plot the same path. The next high, or D1, surfaces at $85.79. Remember that cup-and-handle formation we were discussing previously? If D1 surfaces at $85.79, we can expect the future price of DASH to almost complete the bullish cup-and-handle formation by April 2023.
The low can still follow the average drop of approximately 58.73%, making the DASH price prediction for 2023 surface at a low of $35.84. Note that this point or P1 is higher than the previous low, or O1. This might indicate a strong upward momentum. Due to lower adoption, DASH ended up touching the lows of $24.73 in 2023.
Dash (DASH) price prediction 2024
Now we have the DASH price forecast low in 2023 and hypothetically strong price action in sight —post the near-term correction. So, we can extrapolate the same to 2024. We can do this using the low-to-high average of 170.62% and in 68 days (maximum 147 days depending on market conditions).
This puts the DASH price prediction for 2024 at $96.90 by February 2024. And the next low, following the data from the tables above, might surface at $40 — using the 58.73% drop. We can mark this point as Q1. So, from Q1 or the low in 2024, we can plot the next high for DASH at $108.69.
However, as DASH dropped to a low of $24.73 in 2023, the next 2024 high could even go up to $66.92.
Projected ROI from the current level: 203% max
Dash (DASH) price prediction 2025
Outlook: Very bullish
This DASH price prediction level will surface in early 2025. The low, for that matter, can be anywhere close to $44.86. Do note we have made highly realistic projections till 2025. This is because other cryptocurrencies, like XRP, LTC, Monero, and ZCash, will pose stiff competition to the growth of DASH.
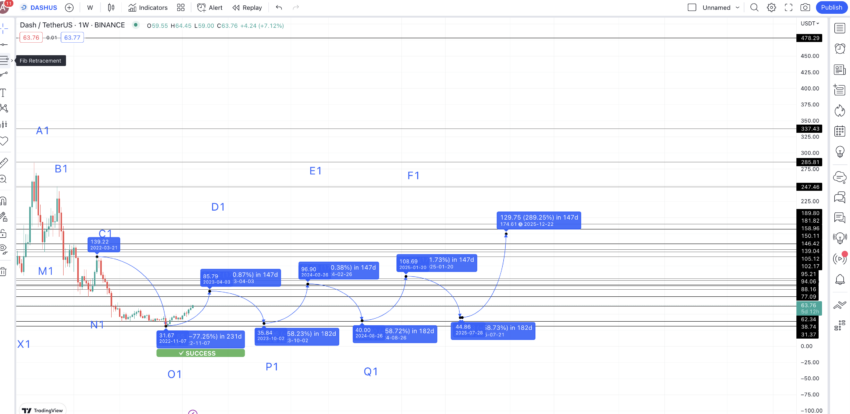
From the low in 2025, we can expect DASH to reach a high of 289.31% — the maximum price percentage high per Table 2. This assumption is due to the continued strength at DASH’s counter, which might help it break through the key resistance level of $158.96. Hence, the next high can be $174.61 by the end of 2025. This could be the actual DASH price prediction high for 2025.
Projected ROI from the current level: 446%
Dash (DASH) price prediction 2030
Outlook: Very bullish
Now that we have DASH’s 2025 high (year-end) and 2025 low, we can use the Fib levels to project the path further. The same growth trajectory puts the 2030 price level at $1575.71 — very close to the DASH’s all-time high of $1642.22.
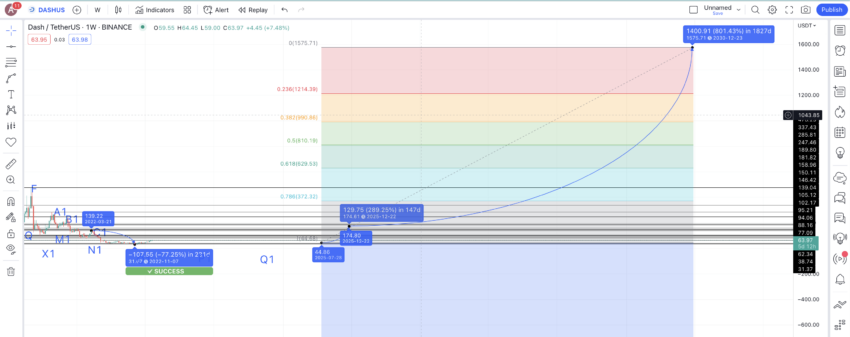
Projected ROI from the current level: 4834%
Dash (DASH’s) long-term price prediction until the year 2035
Outlook: Very Bullish
Based on the price projections above, we expect DASH to reach its highest price level by 2031. Here is a table that traces the path till 2035, allowing you to make projections as a long-term DASH HODLer.
You can easily convert your DASH to USD here
| Year | | Maximum price of DASH | | Minimum price of DASH |
| 2023 | $74.33 | $24.73 |
| 2024 | $66.90 to $96.90 | $40 |
| 2025 | $174.61 | $44.86 |
| 2026 | $235.72 | $146.14 |
| 2027 | $377.15 | $294.17 |
| 2028 | $603.45 | $374.14 |
| 2029 | $905.18 | $706.04 |
| 2030 | $1575.71 | $976.94 |
| 2031 | $2363.56 | $1465.41 |
| 2032 | $3072.63 | $2396.65 |
| 2033 | $4148.05 | $3235.48 |
| 2034 | $5392.47 | $4206.12 |
| 2035 | $6470.96 | $5047.35 |
Is the Dash price prediction model accurate?
This Dash price prediction model captures the essence and utility of the Dash Network. On top of that, the Dash technical analysis is data-backed and considers both the short and long-term outlook of the ecosystem. Therefore, our Dash price forecast theory is well-informed and as realistic and attainable as any prediction in this dynamic crypto market.
Frequently asked questions
How much will DASH be worth in 5 years?
Is DASH good long-term?
Is DASH better than Bitcoin?
Disclaimer
In line with the Trust Project guidelines, the educational content on this website is offered in good faith and for general information purposes only. BeInCrypto prioritizes providing high-quality information, taking the time to research and create informative content for readers. While partners may reward the company with commissions for placements in articles, these commissions do not influence the unbiased, honest, and helpful content creation process. Any action taken by the reader based on this information is strictly at their own risk. Please note that our Terms and Conditions, Privacy Policy, and Disclaimers have been updated.