


The Algorand (ALGO) price recently decreased from the $0.11 horizontal support area. It reached a new all-time low price on August 17.
Readings from the weekly and daily timeframes are bearish. However, a breakout from a long-term descending resistance line could trigger a significant price increase.
Algorand Price Reaches All-Time Low, Trades Below Support
The weekly timeframe technical analysis shows that the ALGO price has fallen under a descending resistance line since its all-time high price of $2.99 in November 2021. So far, the line has been in place for 714 days. More recently, it rejected ALGO in April 2023 (red icon), catalyzing the ongoing downward movement.
Crypto investing, simplified. Get ALGO price predictions here.
On August 17, ALGO fell to a new all-time low price of $0.08. The same week, it also closed below the $0.11 horizontal support area, which had been in place since March 2020. Since the price broke down, the $0.11 area is expected to provide resistance. It is also worth mentioning that Algofi shut down in July. Algofi was the largest decentralized finance protocol in Algorand, contributing more than 50% of its total value locked (TVL).
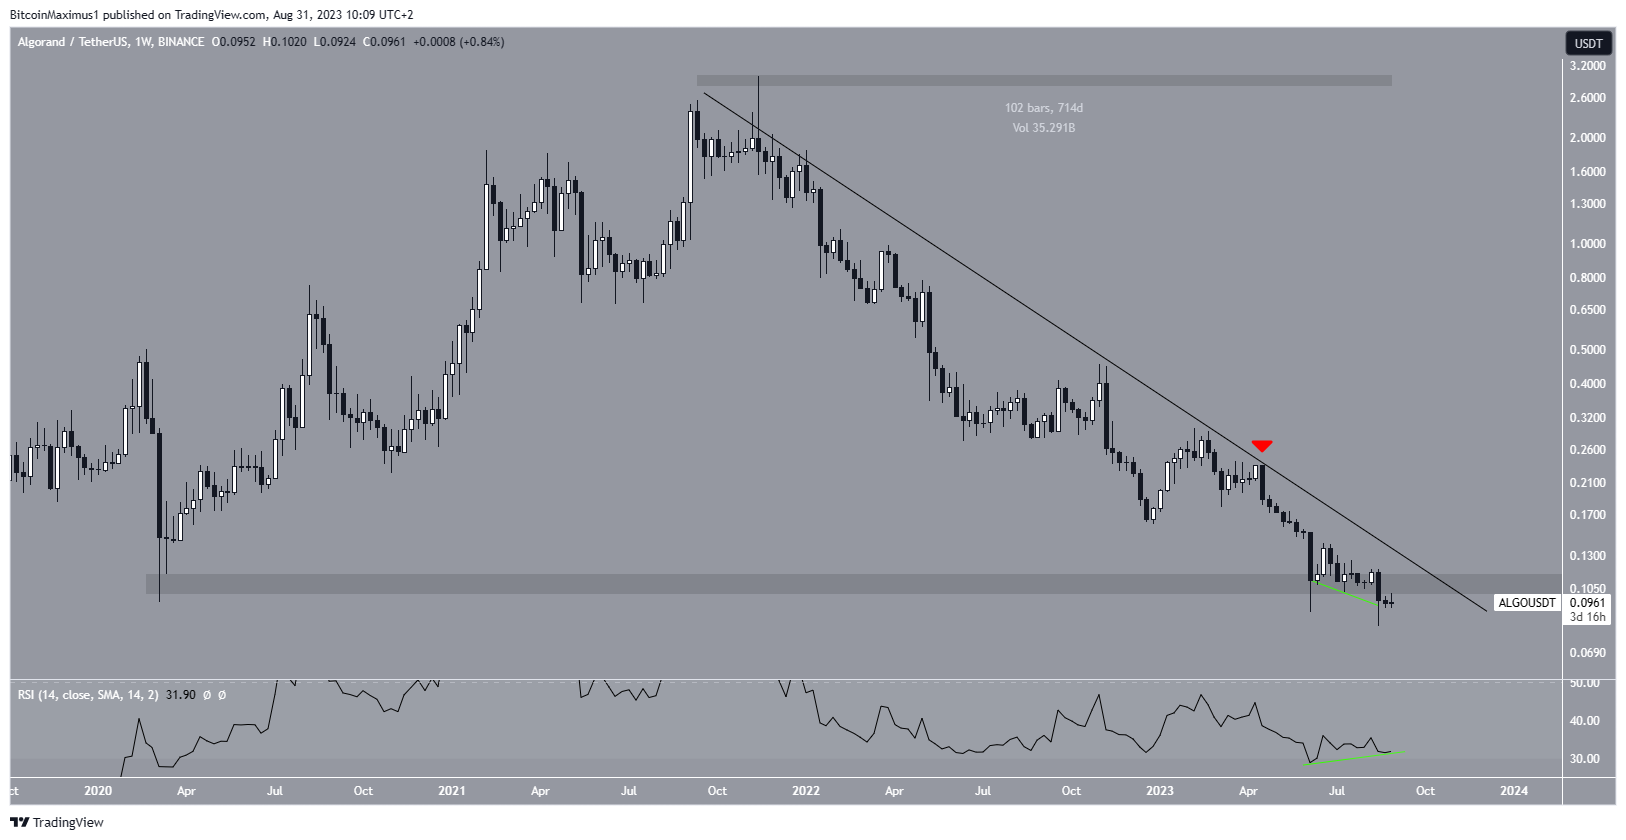
While the weekly RSI is leaning bearish, it also offers hope for a potential bullish trend reversal. With the RSI as a momentum indicator, traders can determine whether a market is overbought or oversold and decide whether to accumulate or sell an asset. Bulls have an advantage if the RSI reading is above 50 and the trend is upward, but if the reading is below 50, the opposite is true.
The RSI is below 50, a sign of a bearish trend. However, the indicator has also generated a bullish divergence (green line). A bullish divergence occurs when a momentum increase accompanies a price decrease. An upward movement often follows it.
Therefore, the weekly timeframe readings are insufficient to determine if ALGO will reclaim the $0.11 support area or if it will continue falling to new lows.
ALGO Price Prediction: Will Price Reclaim $0.11 Level?
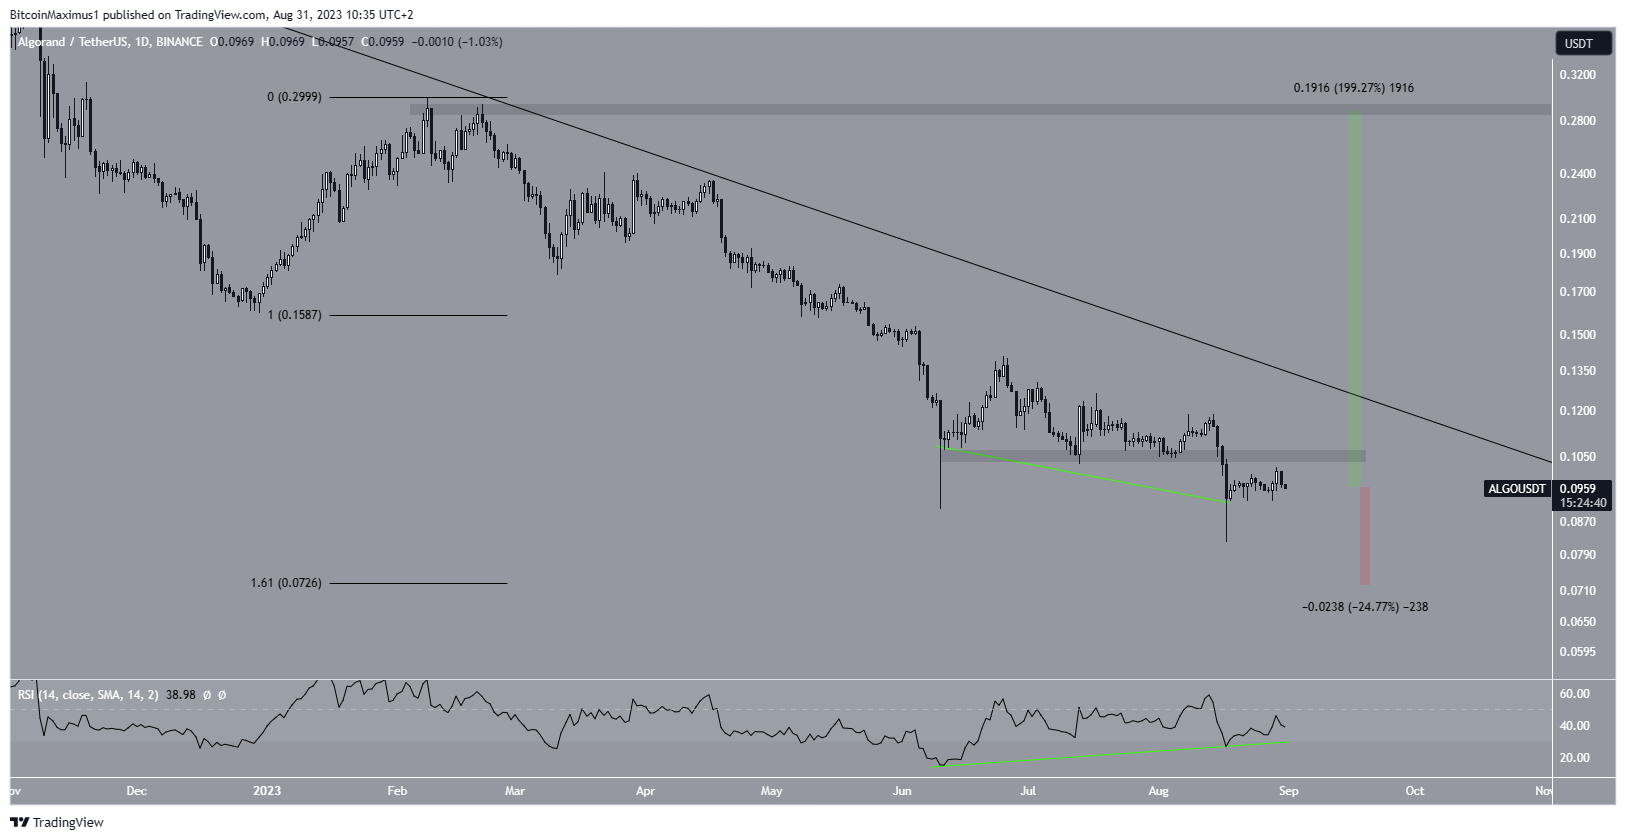
The technical analysis from the daily timeframe is similar to the weekly one. This is especially visible in the RSI, which has generated considerable bullish divergence (green line). As outlined prior, this is a bullish sign that often leads to bullish trend reversals.
However, an increase has yet to begin. Rather, the price hovers below the minor $0.10 horizontal area, providing resistance. So, the price action and RSI are not in alignment regarding the future price trend. Rather, the reaction to the $0.10-$0.11 resistance and the long-term resistance line can determine the future trend.
A successful breakout can lead to a 200% increase to the next resistance at $0.29. On the other hand, failure to do so can cause a 25% drop to the next support at $0.072.
To conclude, the future ALGO price prediction will determine whether the price gets rejected at the $0.11 area again or if it reclaims it instead.
A rejection will lead to a 25% drop, while a reclaim and future breakout can instead cause a 200% price increase.
Trade With AI – 9 Best AI Crypto Trading Bots to Maximize Your Profits
For BeInCrypto’s latest crypto market analysis, click here.


