


The Ripple (XRP) price has fallen since November 2023, accelerating its decrease in 2024.
While the price bounced on January 23, it failed to sustain any upward movement and has lost most of its gains.
XRP Descends Below Support
The technical analysis of the daily time frame shows that XRP has fallen under a descending resistance trend line since July 2023. The trend line caused multiple rejections, the most recent in December (red icon).
The XRP price accelerated its decrease afterward and broke down from a horizontal support area. The drop culminated with a low of $0.49 yesterday.
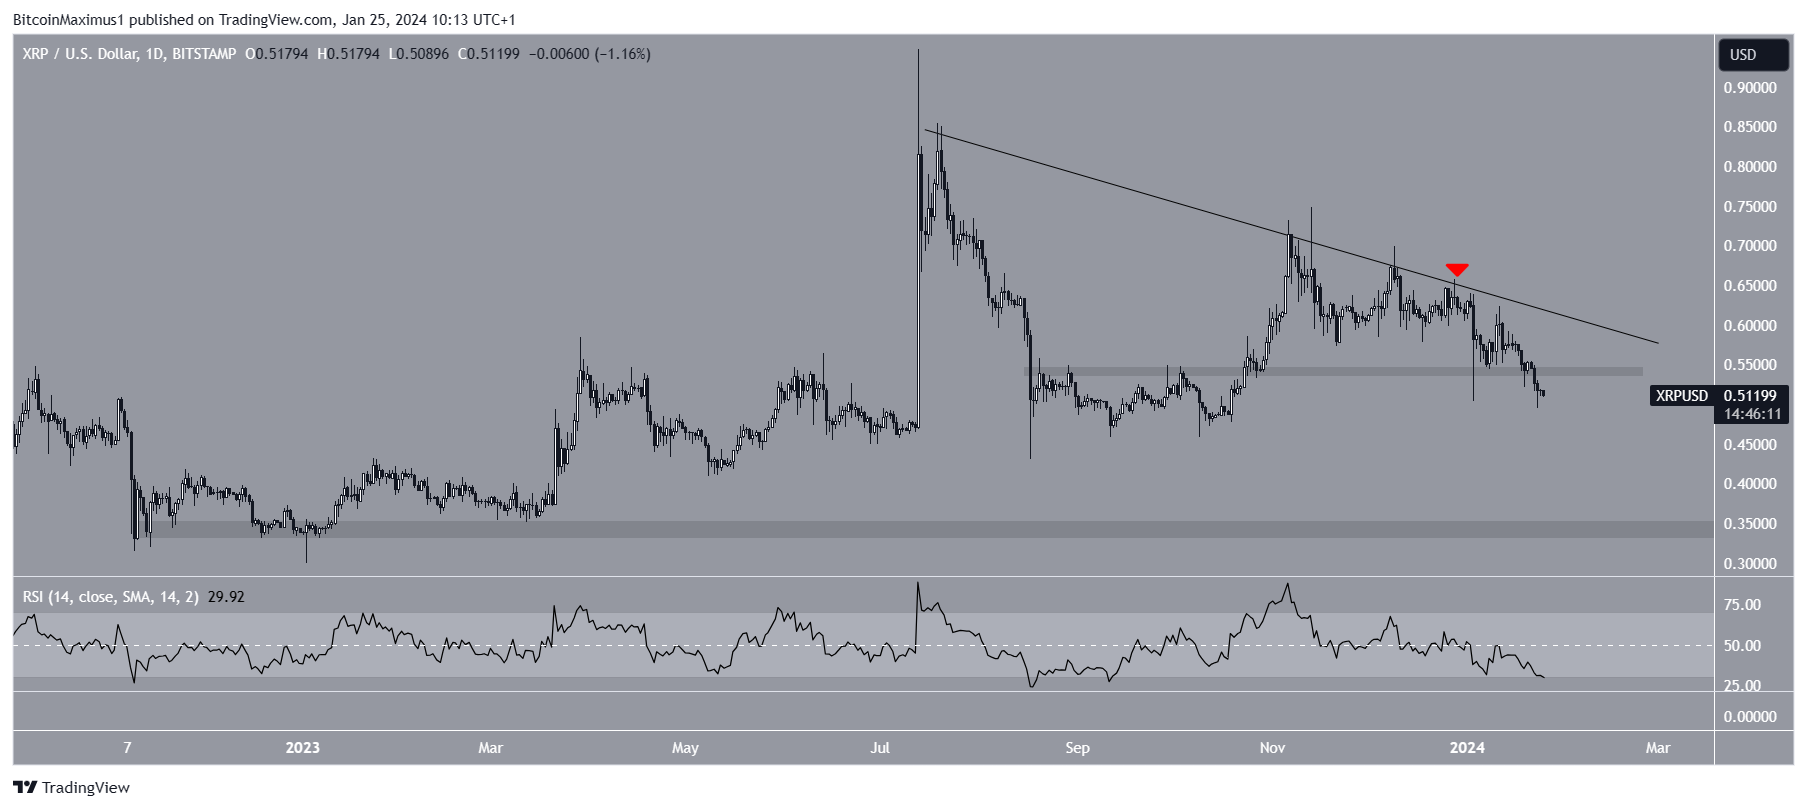
The daily Relative Strength Index (RSI) gives a bearish reading. The RSI is a momentum indicator traders use to evaluate whether a market is overbought or oversold and whether to accumulate or sell an asset.
Readings above 50 and an upward trend suggest that bulls still have an advantage, while readings below 50 indicate the opposite. The indicator is falling below 50 and has nearly crossed into oversold territory.
XRP Price Prediction: When Will Price Bottom?
A closer look at the technical analysis of the daily chart shows that the XRP price has traded inside a descending parallel channel since November 2023.
While such channels usually contain corrective patterns, XRP is in its lower portion, a sign of weakness.
Cryptocurrency Trader XRP Whale said that the price has reached a bottom, creating a bullish Gartley pattern.
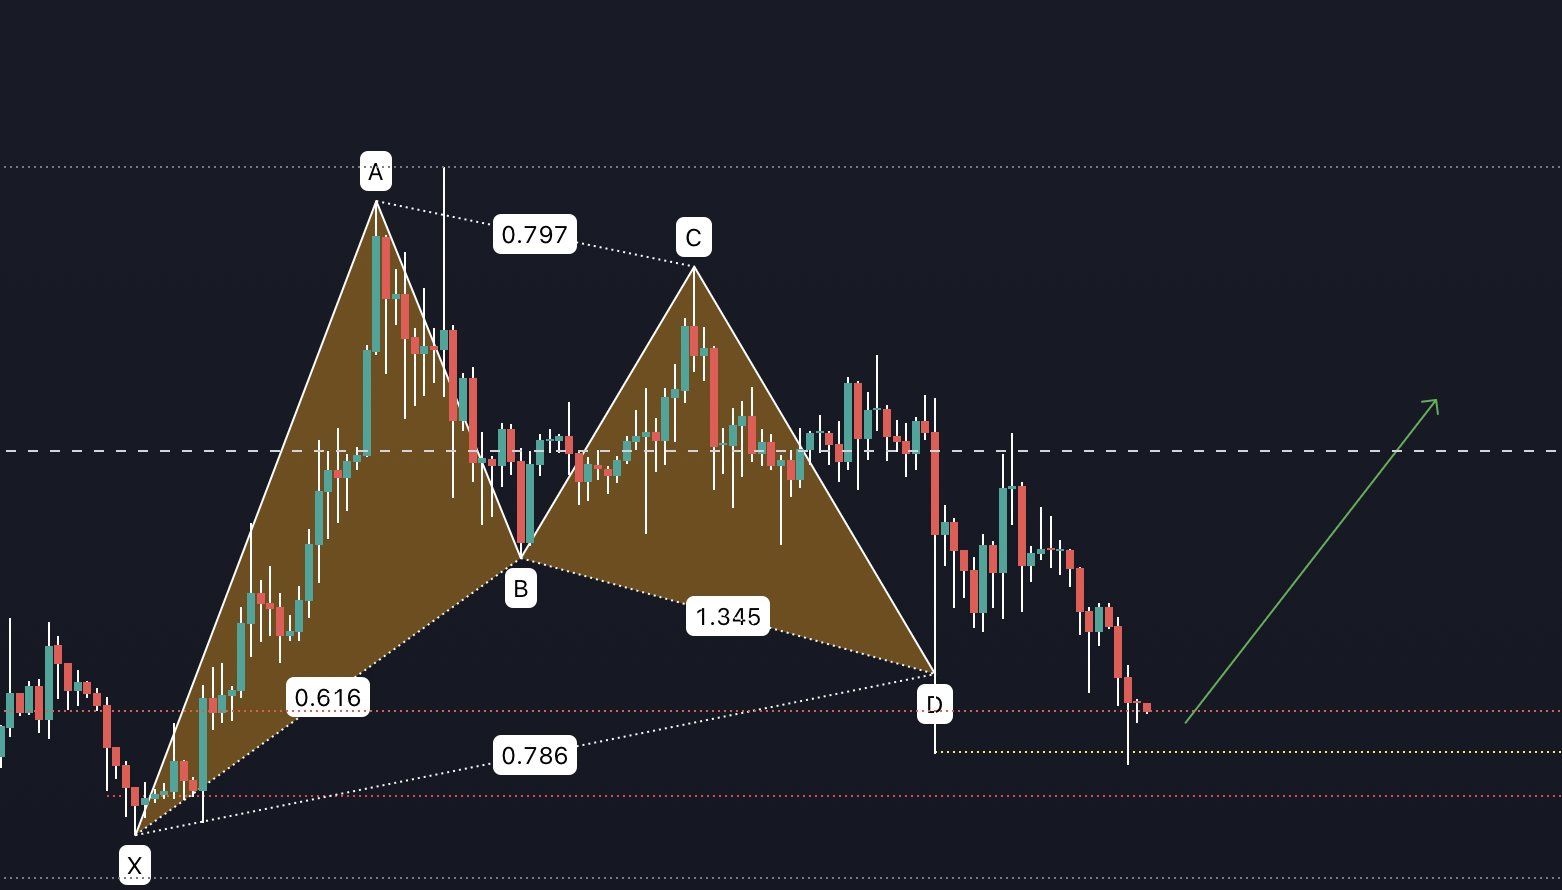
Cryptoes also believes that the price has reached a bottom due to bouncing at a long-term support area.
Read More: How to Sell Ripple
Despite these bullish predictions, the XRP price has not bounced significantly since reaching the channel’s support trend line. Additionally, the daily RSI is bearish, as mentioned above.
So, if the XRP price breaks down from the channel, it can fall 12% to the closest support at $0.44.
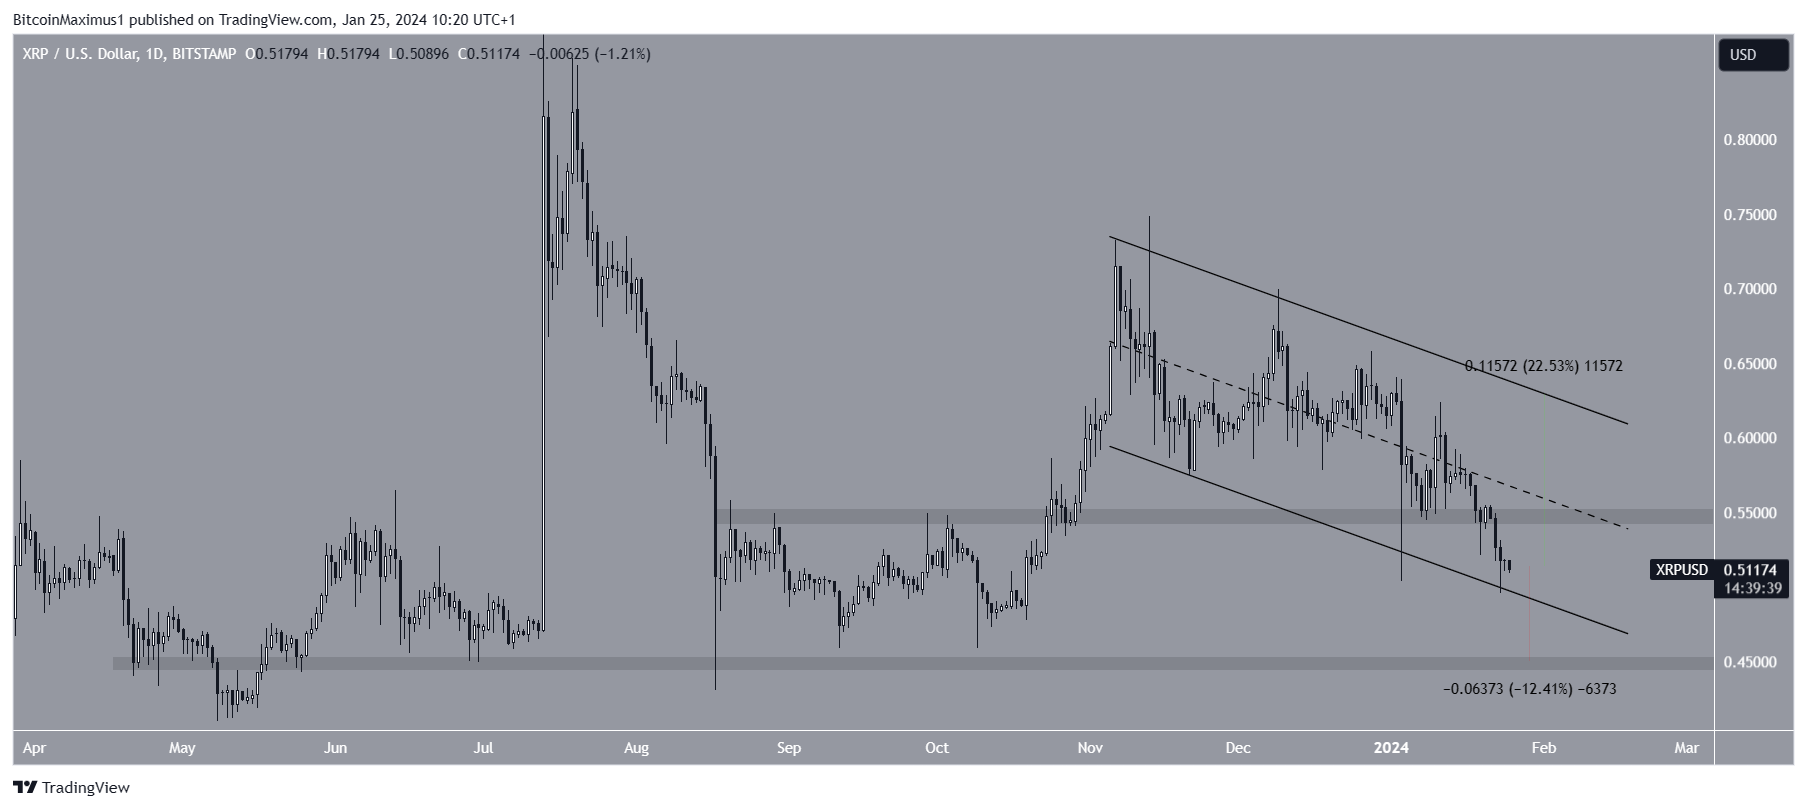
Despite the bearish XRP price prediction, reclaiming the $0.55 horizontal resistance area and the channel’s midline can trigger a 23% increase in the channel’s resistance trend line.
For BeInCrypto‘s latest crypto market analysis, click here.


