The XRP price is at risk of breaking down from an ascending support trend line that has existed for nearly 400 days.
XRP broke down from a short-term bearish pattern, another sign of a bearish trend. Is this the start of a long-term correction?
Will XRP Break Down From Long-Term Support?
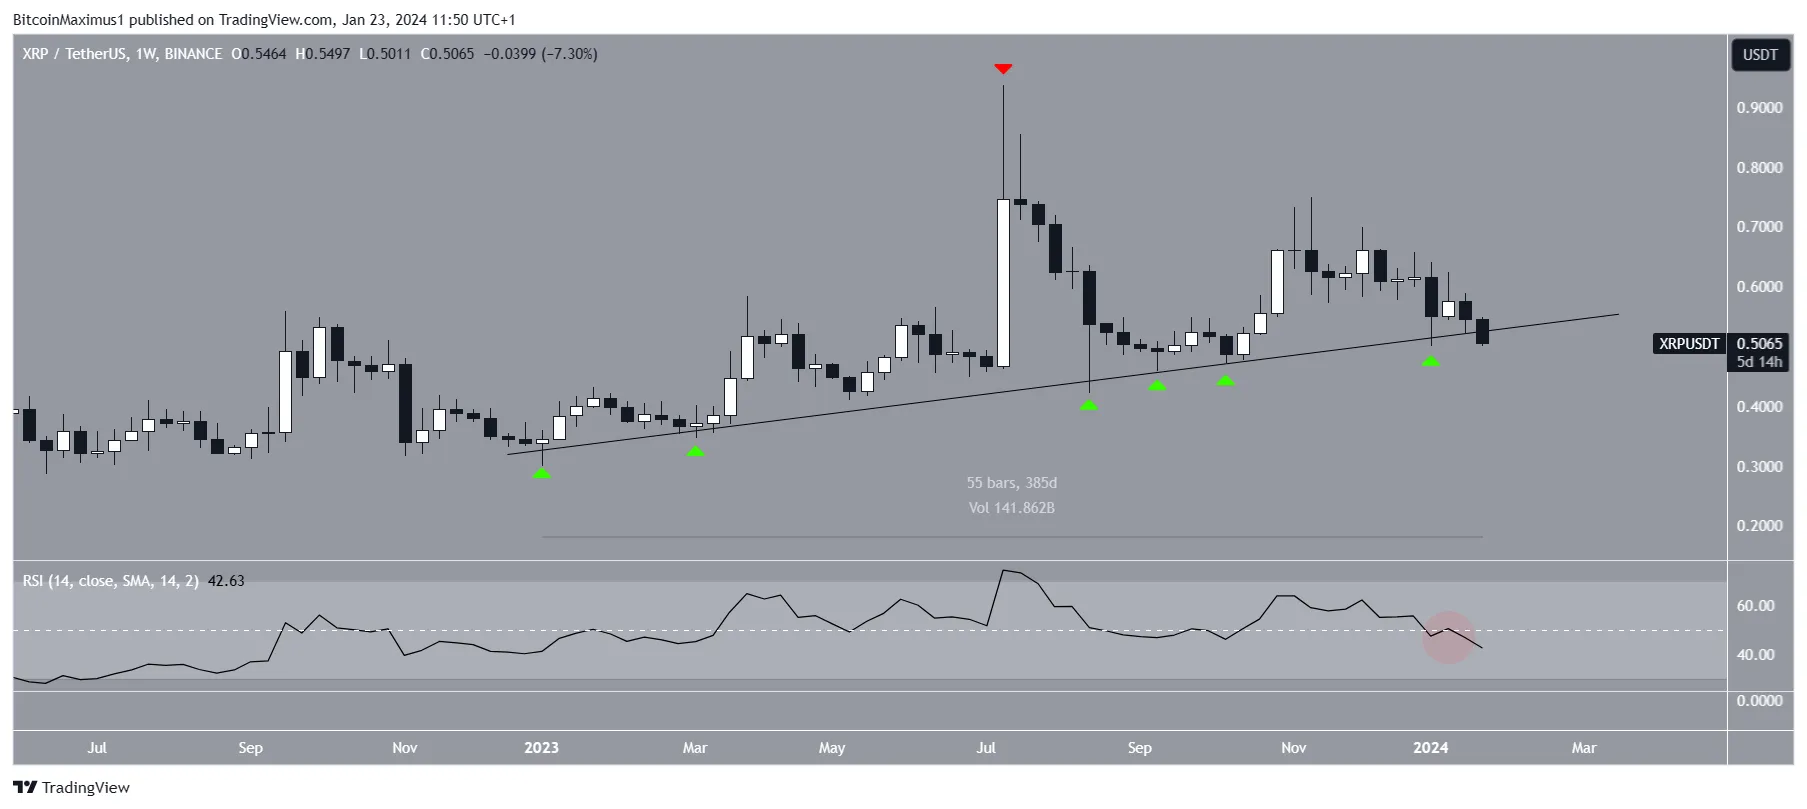
The weekly time frame technical analysis shows that the XRP price has increased alongside an ascending support trend line since the start of 2023. The upward movement led to a 2023 high of $0.94 in July (red icon). However, the price has fallen since.
After several bounces at the support trend line (green icons), XRP is finally breaking down from it, though it has yet to reach its weekly close. So far, the XRP trend line has existed for nearly 400 days.

The weekly Relative Strength Index (RSI) gives a bearish reading. When evaluating market conditions, traders use the RSI as a momentum indicator to determine whether a market is overbought or oversold and whether to accumulate or sell an asset.
If the RSI reading is above 50 and the trend is upward, bulls still have an advantage, but if the reading is below 50, the opposite is true. The indicator is below 50 (red circle) and falling, both signs of a bearish trend.
What do Analysts Say?
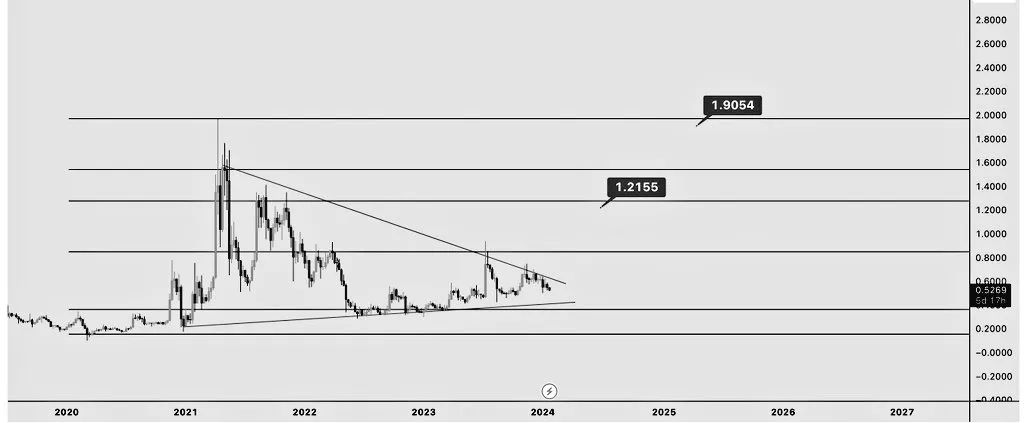
Despite the ongoing decrease, cryptocurrency traders and analysts on X are still bullish. Bit_Luxe believes the price will soon increase above $1.

TD Sequential indicator flashes buy signal amid recent dip! Despite bearish pressure here i spot a potential rebound highlighting a buying opportunity!
Finally, Rob Art believes that the decrease is merely a healthy correction.
Read More: How to Sell Ripple
XRP Price Prediction: Where to Next?
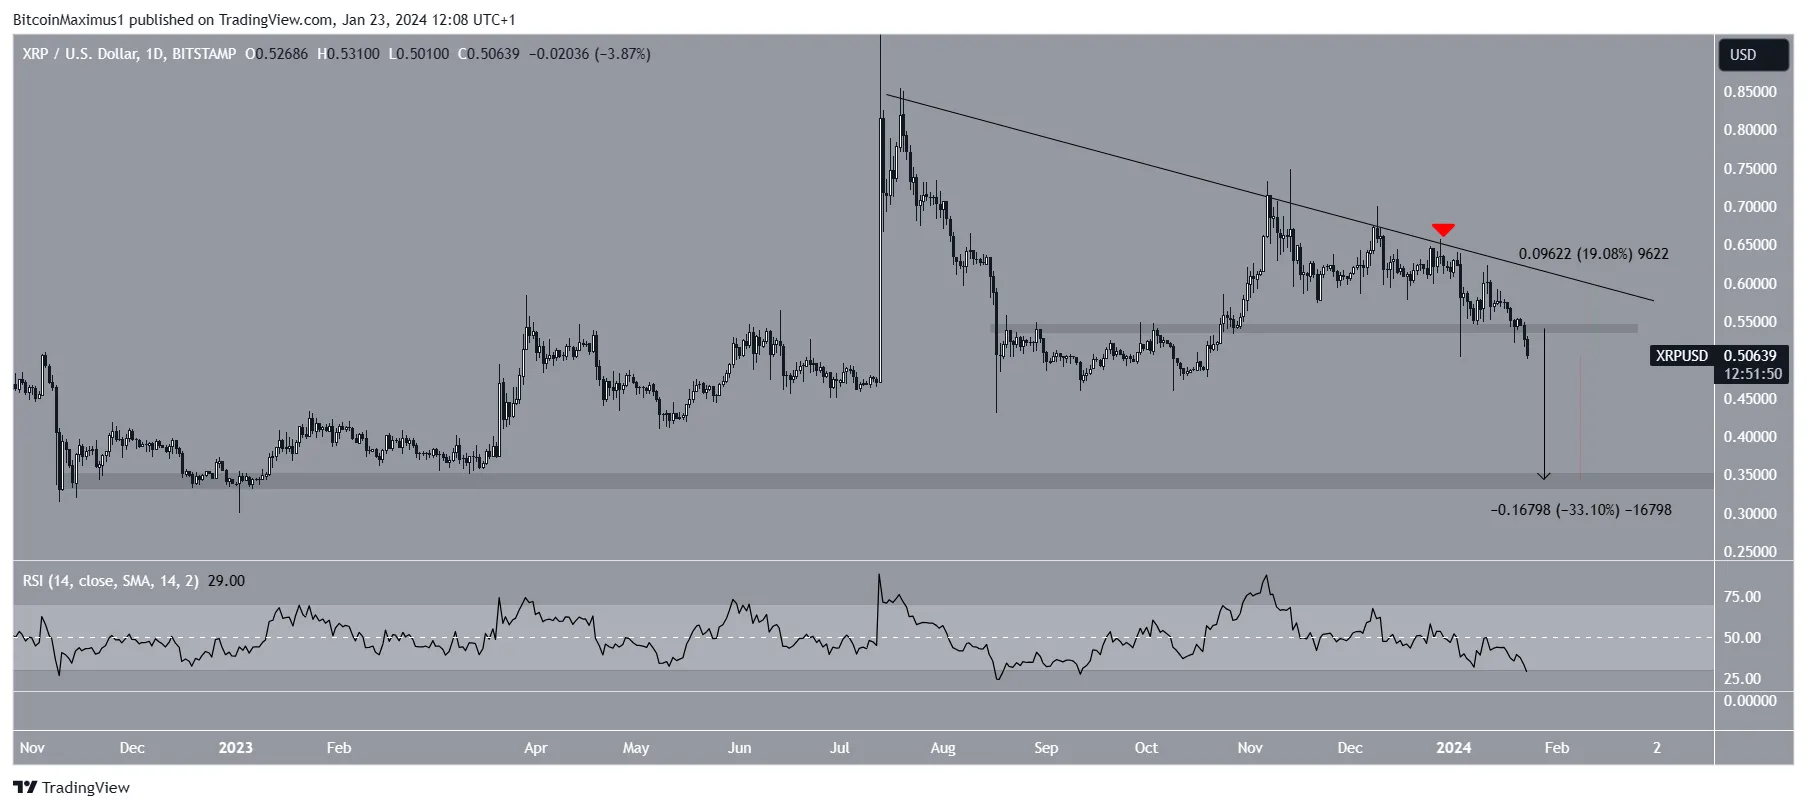
The six-hour time frame readings align with the daily one, supporting the possibility that XRP will continue falling. The chart shows that XRP has decreased under a descending resistance trend line since July 2023. The trend line has been validated numerous times, most recently in December (red icon).
Additionally, the XRP price had traded above the $0.52 horizontal area, which created a descending triangle when combined with the resistance trend line. XRP broke down from the area yesterday.
The six-hour RSI supports continuing the decrease, since it is below 50 and falling.
A breakdown that travels the entire pattern’s height (black arrow) will take XRP to the closest support at $0.34, a decrease of 33% measuring from the current price.

Despite this bearish XRP price prediction, reclaiming the $0.54 area will invalidate the breakout and can lead to a 20% increase to the descending resistance trend line.
For BeInCrypto‘s latest crypto market analysis, click here.
Disclaimer
In line with the Trust Project guidelines, this price analysis article is for informational purposes only and should not be considered financial or investment advice. BeInCrypto is committed to accurate, unbiased reporting, but market conditions are subject to change without notice. Always conduct your own research and consult with a professional before making any financial decisions. Please note that our Terms and Conditions, Privacy Policy, and Disclaimers have been updated.


