


The XRP price holds above a long-term horizontal support area from which it previously broke out.
XRP trades below a short-term descending resistance trend line, creating a descending triangle.
XRP Approaches End of Triangle
The XRP price has increased alongside an ascending support trend line since the start of 2023. The increase culminated with a high of $0.95 in July, a new yearly high.
The upward movement also caused a breakout from a long-term horizontal resistance area, which had been in place since September 2022.
However, XRP has fallen under a descending resistance trend line since then. The price was rejected numerous times (red icons).
The XRP trend lines combined create a symmetrical triangle, considered a neutral pattern. XRP is rapidly approaching the end of the pattern, at which time a decisive movement is expected.
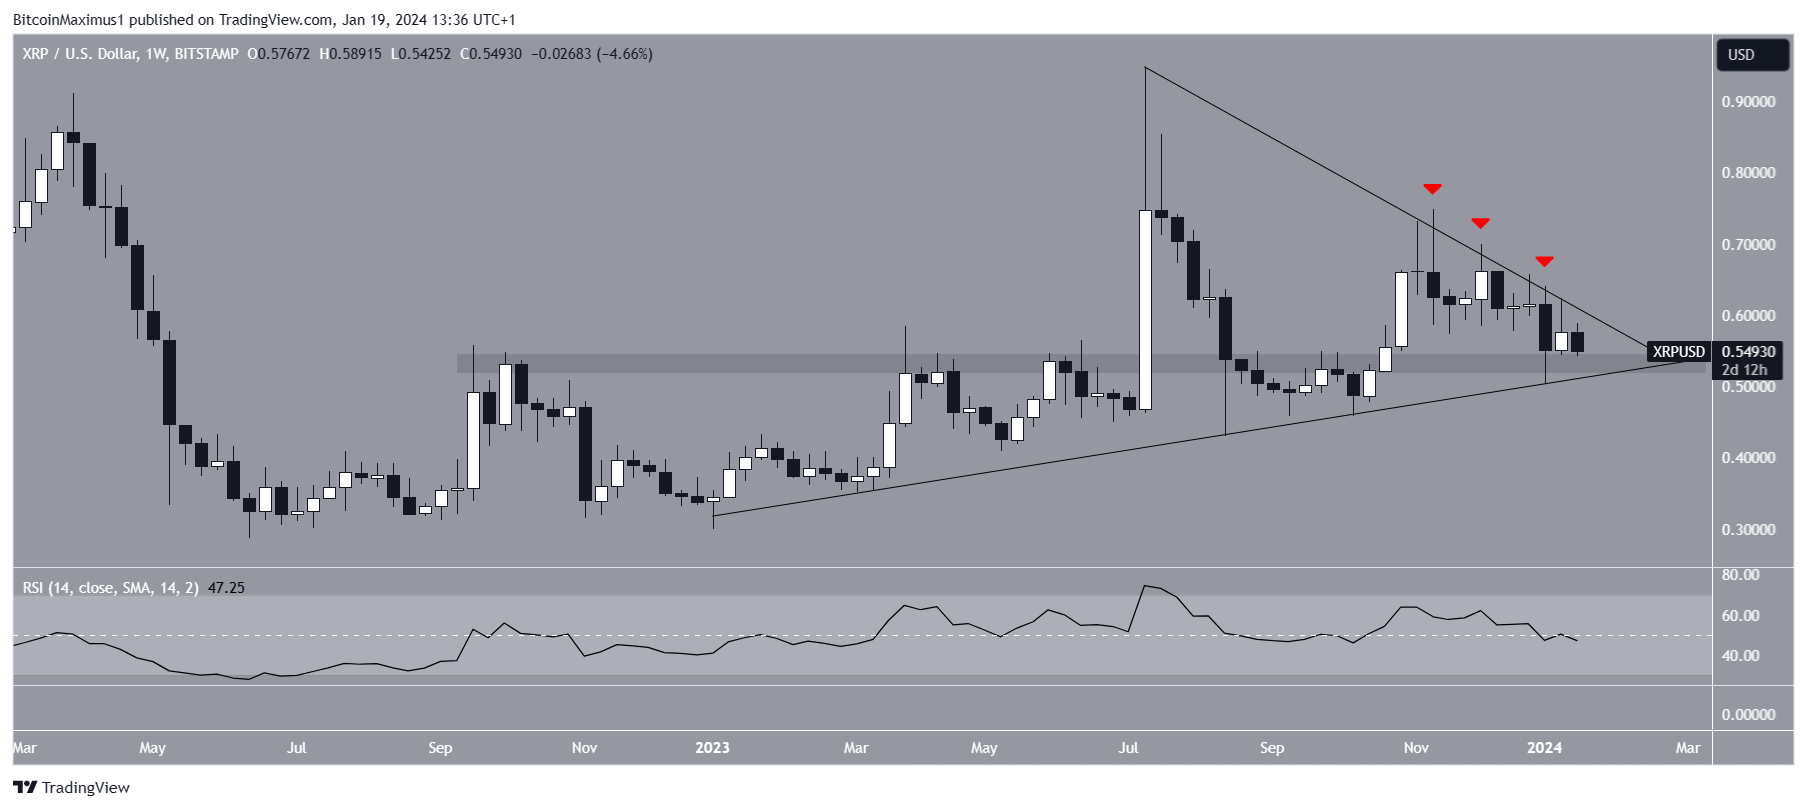
The RSI is a momentum indicator traders use to evaluate whether a market is overbought or oversold and whether to accumulate or sell an asset.
Readings above 50 and an upward trend suggest that bulls still have an advantage, while readings below 50 indicate the opposite.The weekly RSI does not help determine the trend’s direction. The RSI is at 50, a sign of an undetermined trend.
Read More: Getting Started With XRP Wallets
XRP Price Prediction: Can Price Initiate a Bounce?
The technical analysis of the daily time frame gives a bearish outlook. This is because of the price action and RSI.
The price action shows a short-term symmetrical triangle that has existed since November 2023. If so, XRP is breaking down from its support at $0.55.
The daily RSI is also falling and below 50. While it may generate bullish divergence, this has not been confirmed yet.
If XRP reaches a daily close below the $0.55 support, it can fall 15% to the next closest support at $0.46. Interestingly, cryptocurrency analyst Ben Armstrong believes the XRP price will pump soon. He tweeted:
Call me crazy, but I believe the $XRP pump starts by end of day Monday.
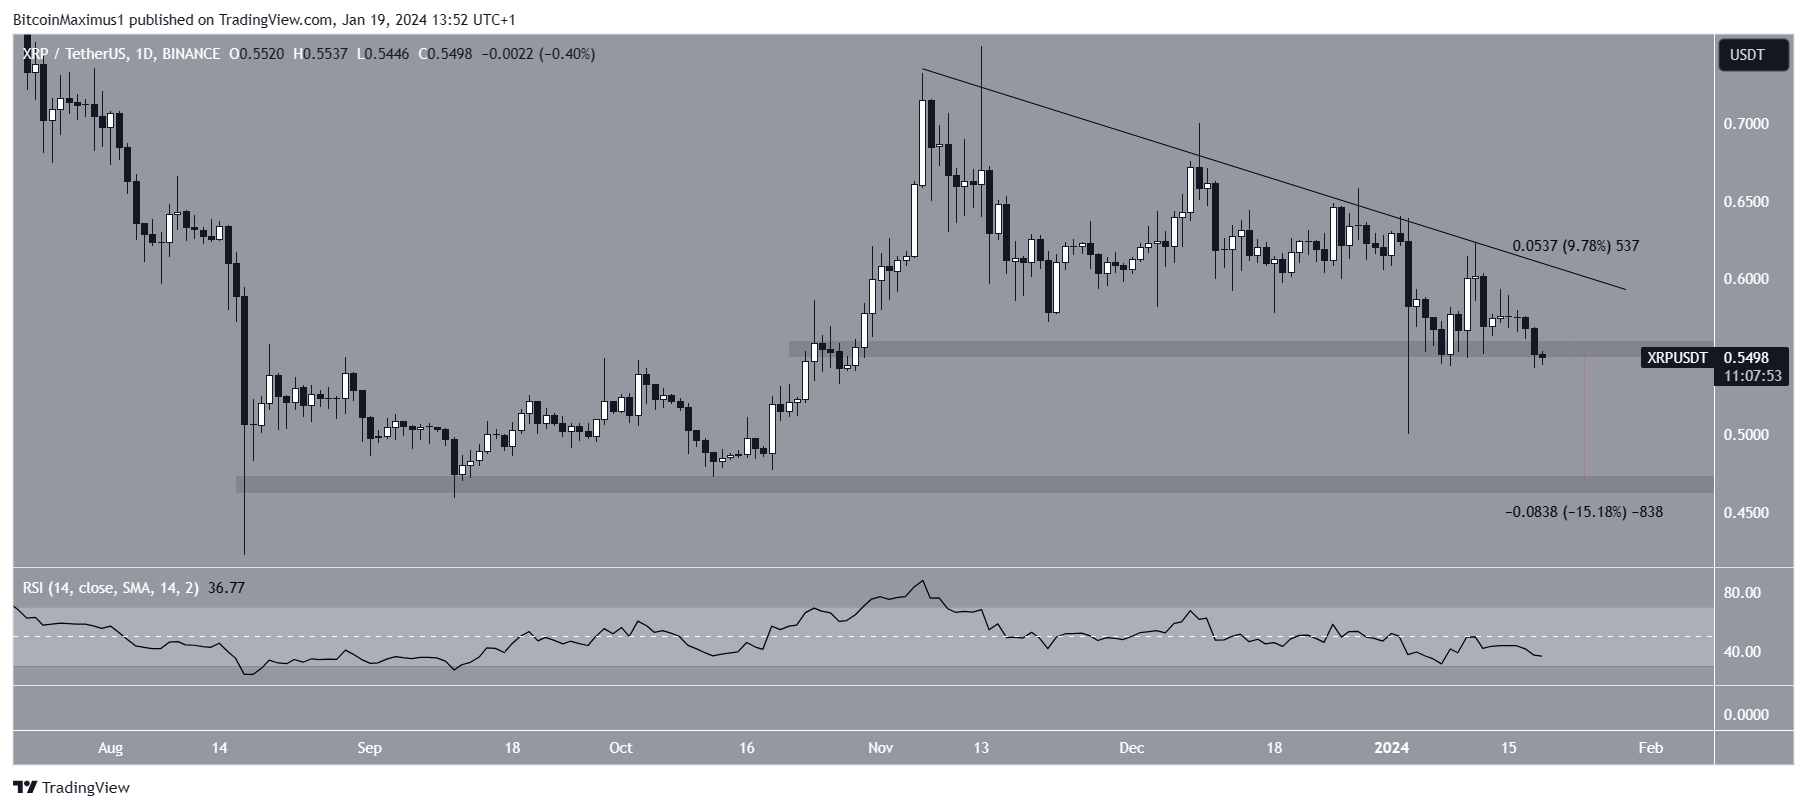
Despite this bearish XRP price prediction, a strong bounce at the $0.55 area can trigger a 10% bounce to the descending resistance trend line at $0.60.
For BeInCrypto‘s latest crypto market analysis, click here.


