

The price of Stellar (XLM) has been on a downward trend since its peak for the year on July 13. However, it is also trading within a continuation pattern. This suggests that there is a likelihood of a significant price increase in the future.
Moreover, when examining both the price action and wave count analysis, it becomes likely that the overall trend is still bullish. This indicates that there is a potential for XLM to reach a new yearly high in the near future.
Stellar Price Falls in Consecutive Weeks
The weekly time frame technical analysis for XLM shows several important developments. The main one is the breakout from a 616-day descending resistance line at the start of January. After creating a higher low and validating the line as support, XLM began another upward movement that accelerated in June.
Transform your crypto game with predictive insights. Visit now:
While XLM cleared the $0.105 horizontal resistance area, it failed to reach the next resistance at $0.23. Rather, it culminated with a high of $0.195 before falling and creating a long upper wick (red icon).
XLM has decreased in the two weeks following the high and is now trading at $0.14. XLM is gradually approaching the $0.105 support area.
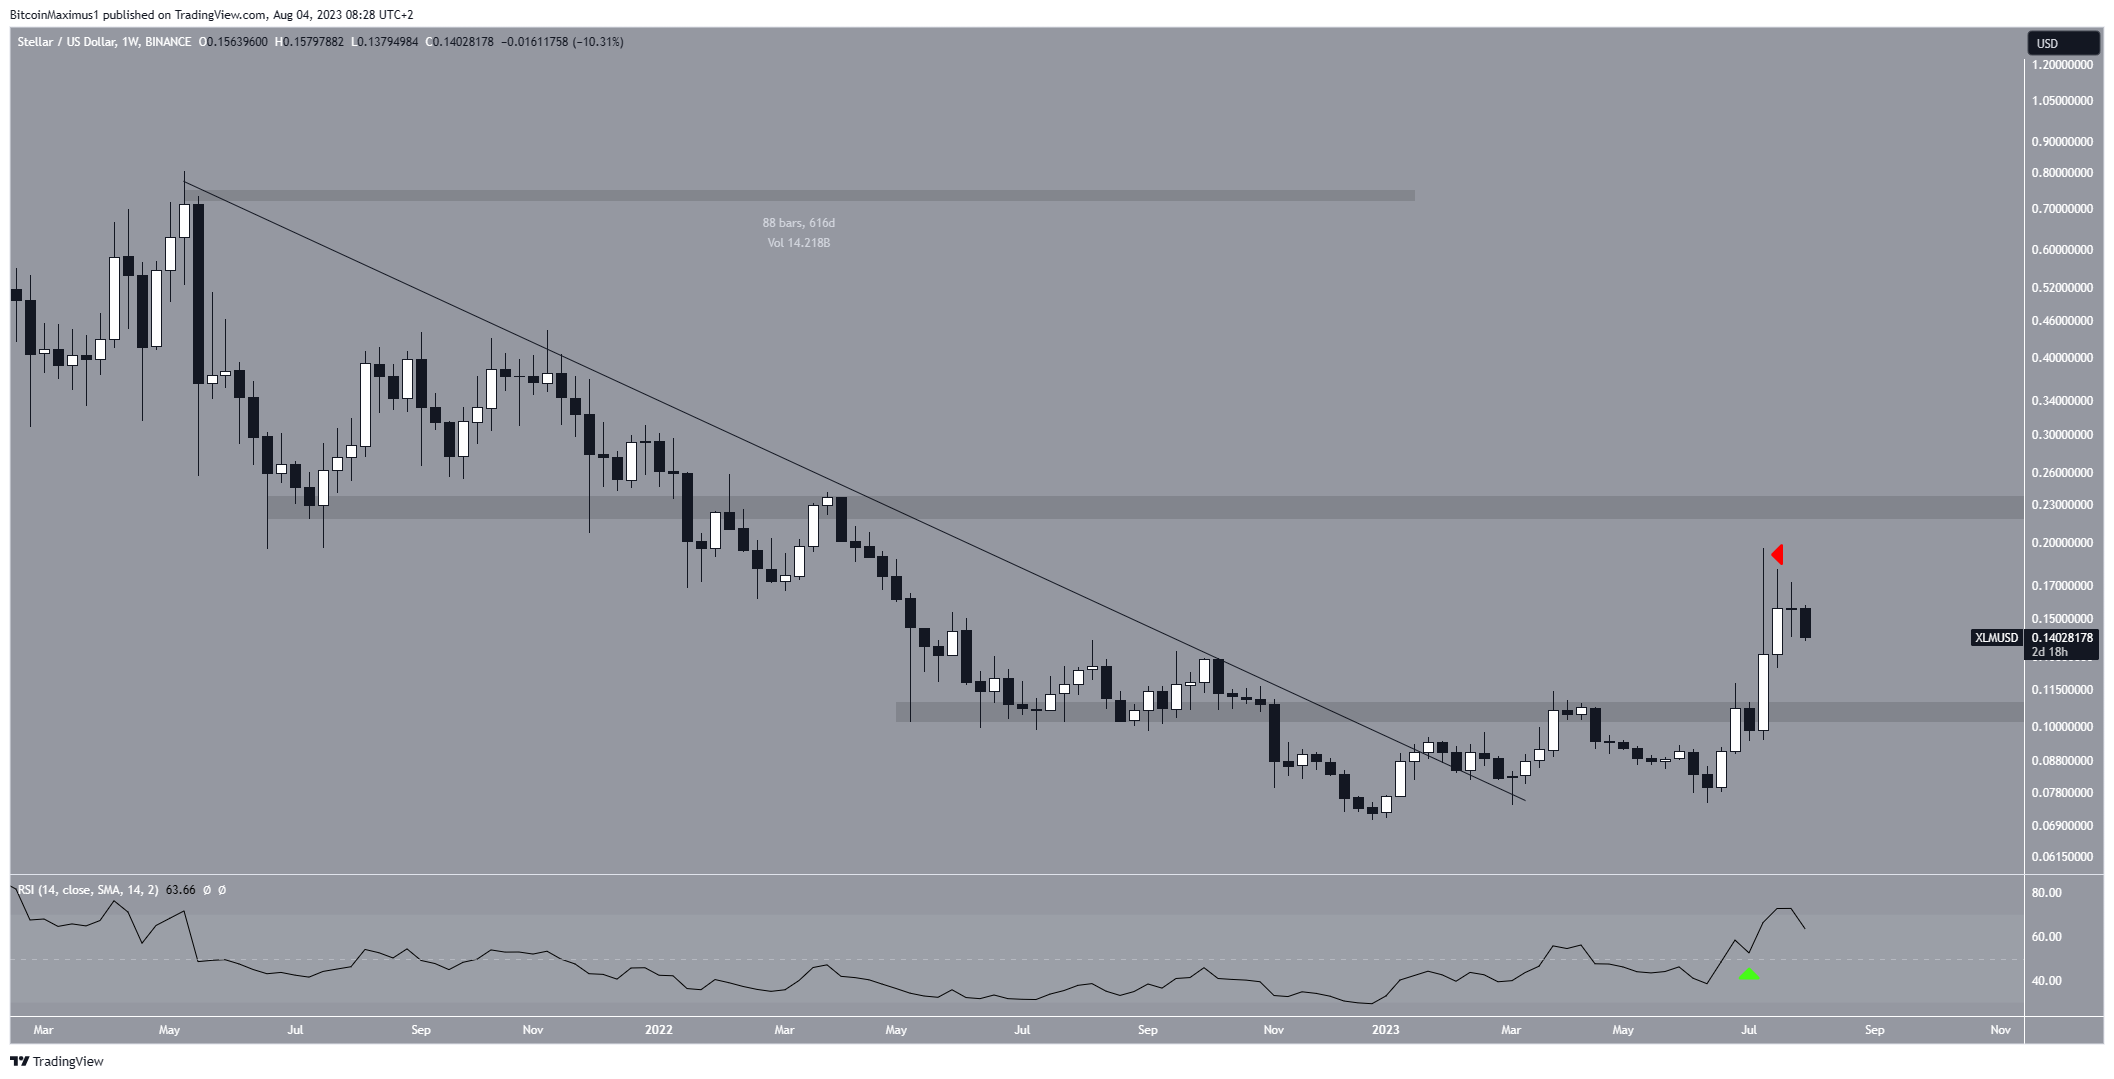
On the weekly chart, the Relative Strength Index (RSI) is providing a mixed signal. When evaluating market conditions, traders use the RSI as a momentum indicator to determine if a market is overbought or oversold, and to decide whether to accumulate or sell an asset.
If the RSI reading is above 50 and the trend is upward, bulls still have an advantage, but if the reading is below 50, the opposite is true. In the case of XLM, the RSI is falling but is above 50, a sign of an undetermined trend.
XLM Price Prediction: Wave Count Predicts Bounce
After analyzing XLM’s price movements using the Elliott Wave theory, a positive outlook emerges for its future price. However, a significant bounce is required at the current level for the bullish outlook to remain intact. The Elliott Wave theory, employed by technical analysts to study long-term price patterns and investor psychology, is being used to predict market trends.
Based on the current Elliott Wave count (white lines), XLM’s price appears to be in the fourth wave of a five-wave upward movement. This fourth wave has taken the shape of a triangle pattern, which is commonly observed during this phase of the wave.
If this count proves accurate, it suggests that XLM’s price has already reached a local low (green icon) and is now in the process of validating the triangles support line once more (white icon). Additionally, it implies that XLM is approaching the end of its consolidation pattern.
Consequently, it is expected that XLM will break out from the triangle pattern and experience a rise towards the next resistance level at $0.23.
This anticipated increase amounts to slightly more than 60% from the current price. Once the five-wave uptrend is complete, there might be a corrective phase.
To confirm this bullish count, a close above the triangle’s resistance line is essential.
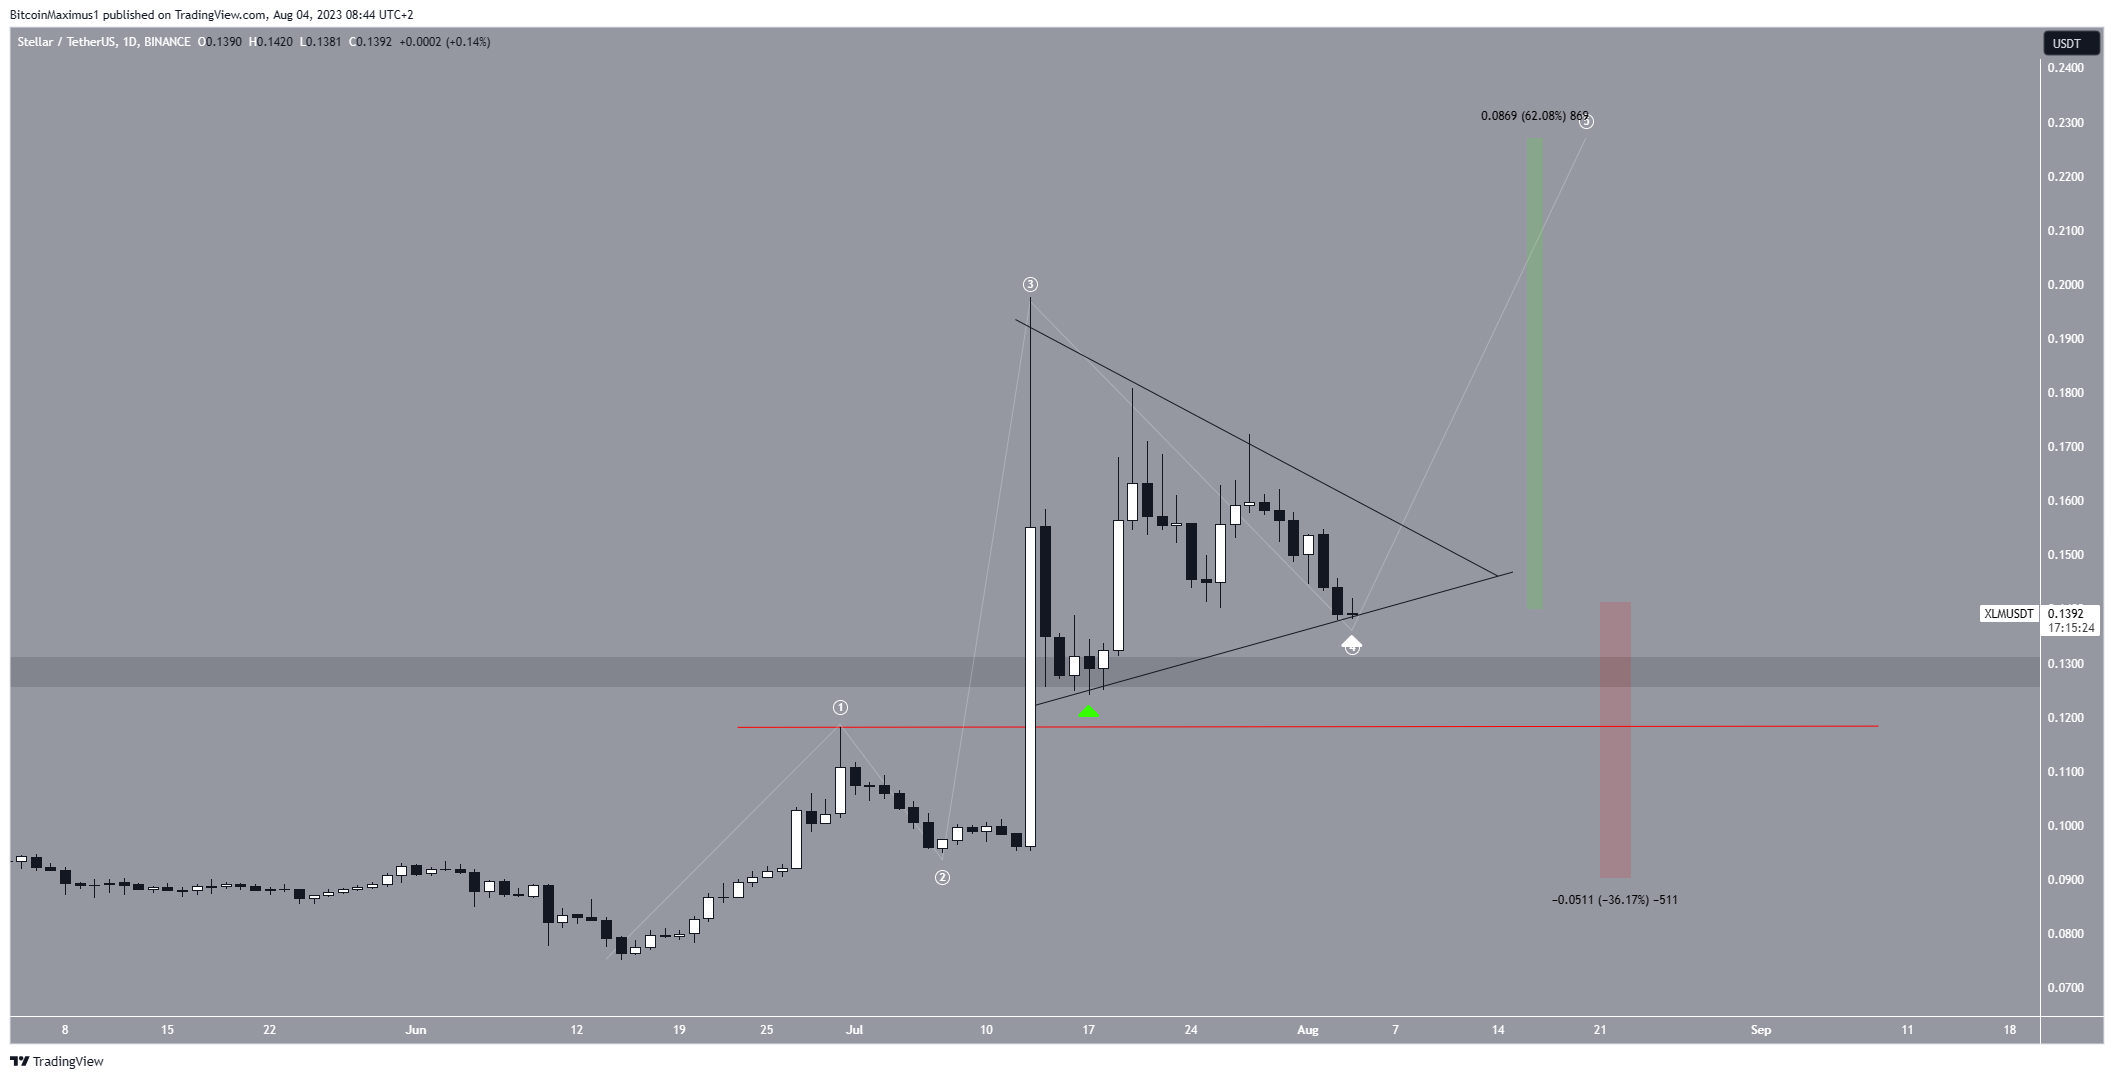
Nevertheless, despite this bullish XLM price prediction, a decrease below the wave one high (red line) at $0.12 would indicate a bearish trend.
In that scenario, the XLM price would likely decline to the next support level at $0.09, which is approximately a 36% drop measured from the current price.
Read More: 11 Best Crypto Portfolio Trackers in 2023
For BeInCrypto’s latest crypto market analysis, click here.
Disclaimer
In line with the Trust Project guidelines, this price analysis article is for informational purposes only and should not be considered financial or investment advice. BeInCrypto is committed to accurate, unbiased reporting, but market conditions are subject to change without notice. Always conduct your own research and consult with a professional before making any financial decisions. Please note that our Terms and Conditions, Privacy Policy, and Disclaimers have been updated.
