


The UNI price has increased swiftly since October and broke out from a long-term descending resistance trend line last week.
Is this long-term breakout a sign of things to come, or will the price fail to sustain its increase? Let’s find out!
Uniswap Breaks Out from 480-Day Resistance
The UNI price has traded above a long-term horizontal support area since April 2022. While doing so, it also followed a long-term descending resistance trend line. In July 2023, the trend line caused a rejection, leading to another retest of the long-term support in October. The UNI price has increased since.
Last week, the altcoin broke out from the descending resistance trend line. At the time, the trend line had been in place for 480 days.
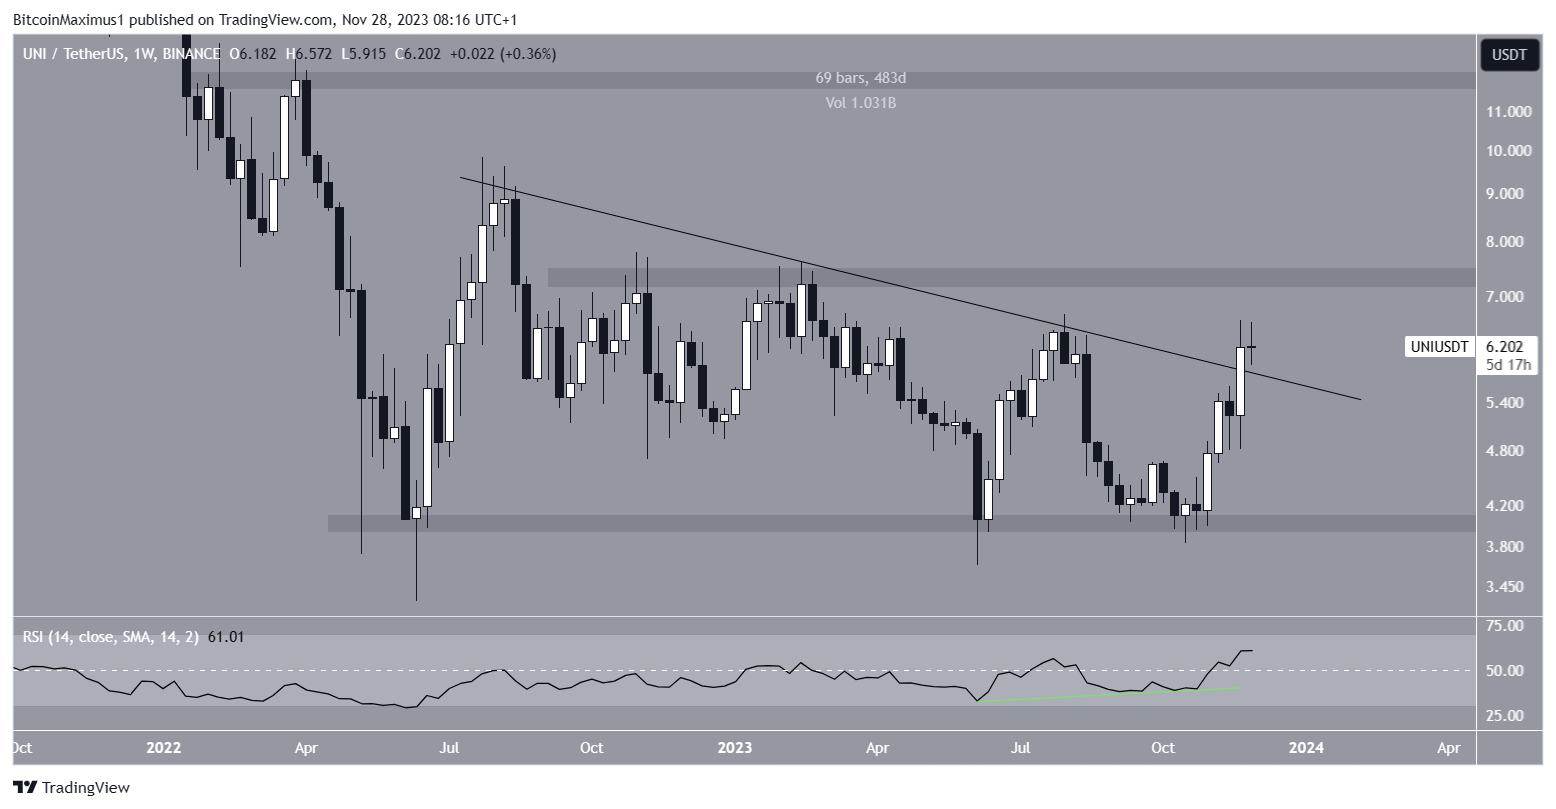
Interestingly, the weekly Relative Strength Index (RSI) generated a bullish divergence before the increase. Market traders use the RSI as a momentum indicator to identify overbought or oversold conditions and to decide whether to accumulate or sell an asset.
Readings above 50 and an upward trend indicate that bulls still have an advantage, whereas readings below 50 suggest the opposite. A bullish divergence occurs when a momentum increase accompanies a price decrease. The RSI has increased since and is now above 50.
Read More: 9 Best AI Crypto Trading Bots to Maximize Your Profits
What Are Analysts Saying?
Cryptocurrency traders and analysts on X give a bullish outlook for the future UNI price trend.
RektCapital believes that the price is breaking out from a long-term structure. He stated that:
Uniswap is on the cusp of a breakout from this macro market structure Needs to break the top of this pattern and reclaim it as support to enter a new macro uptrend
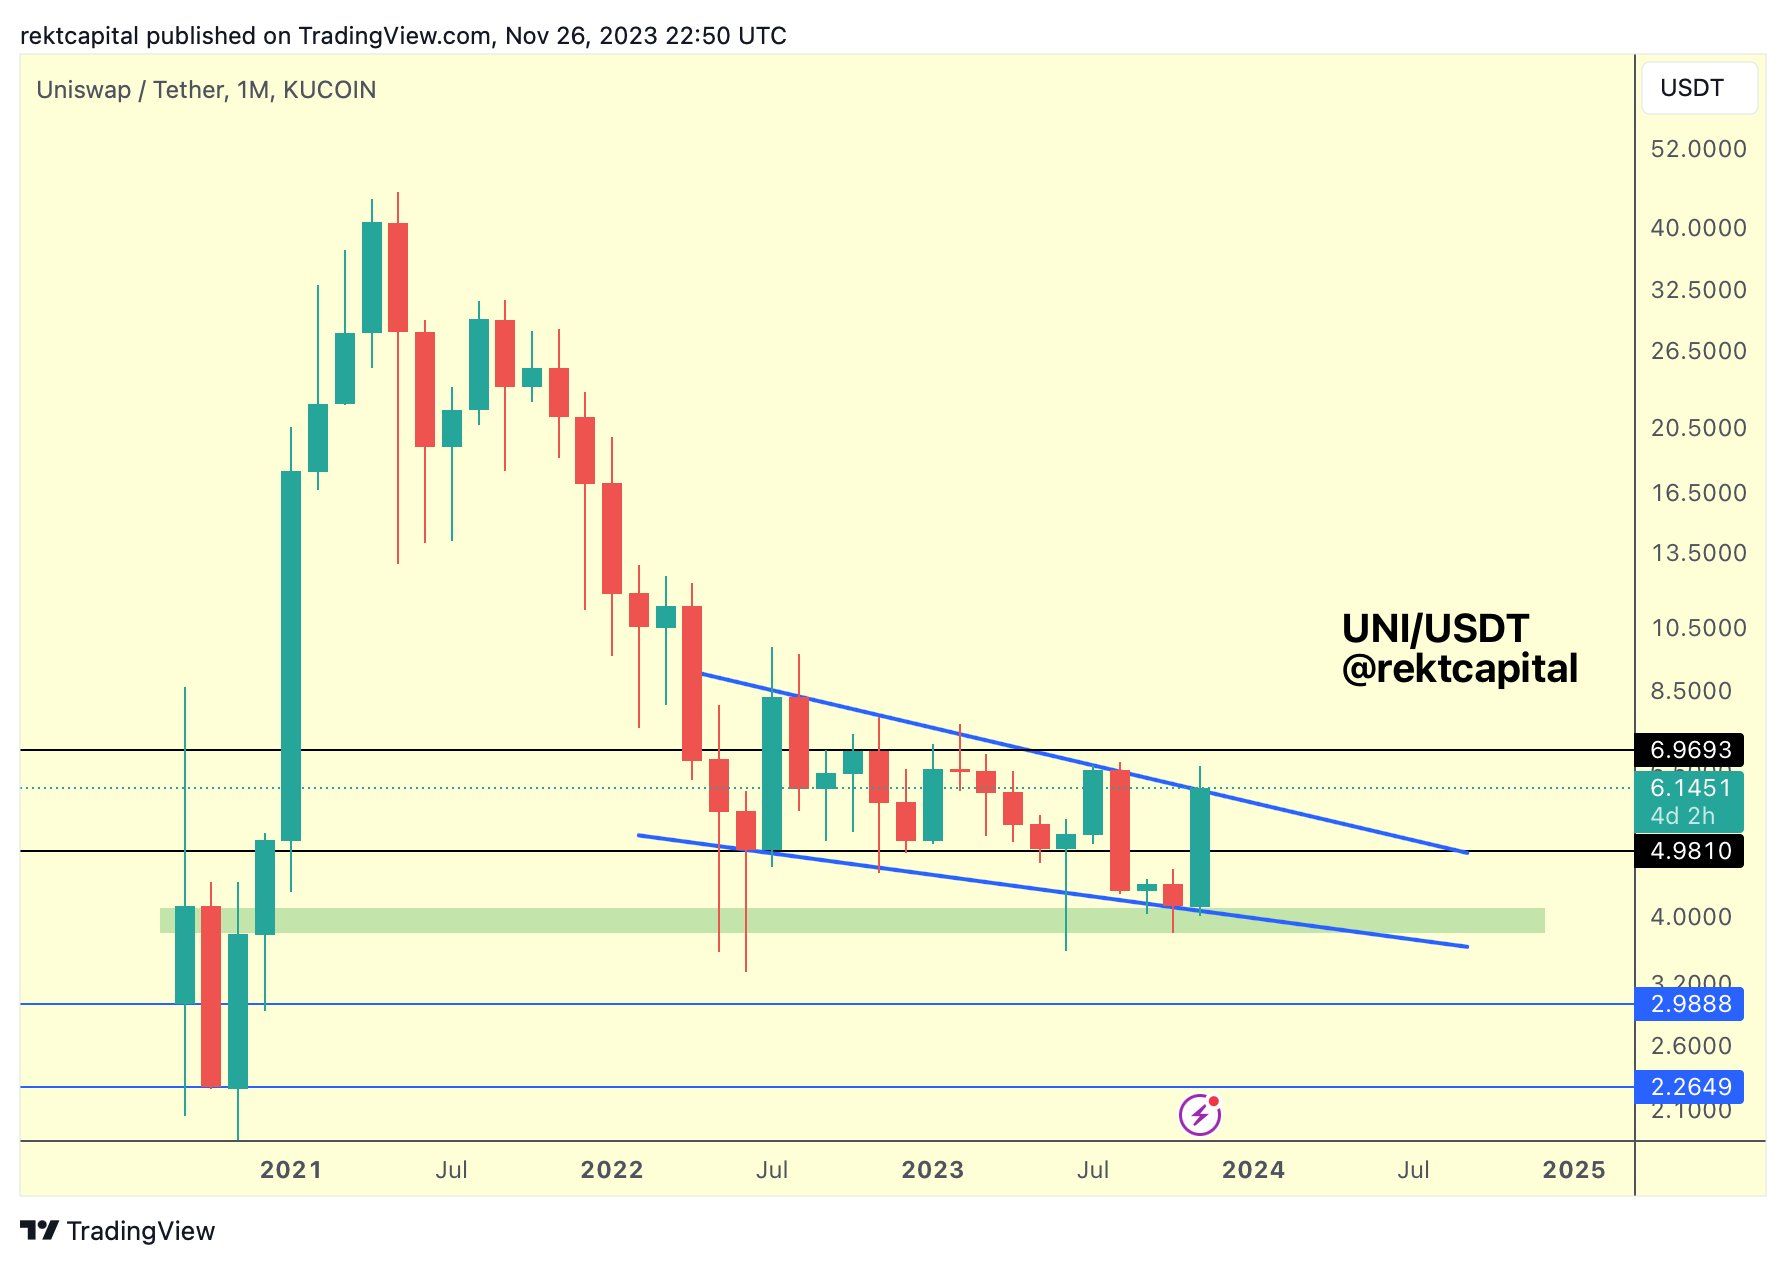
JJCycles is bullish for the same reason, though he believes that the UNI price has already broken out from the descending resistance trend line.
The Uniswap Decentralized Exchange (DEX) is also performing admirably.
The monthly trading volume of $16.50 billion is the highest since April at $16.62 billion. Since there are two more trading days left in the month, the November volume will likely eclipse that of April. Volume in the last 24 hours is also up more than 20%, reaching $713 million.
The narrative of Decentralized Exchanges has gained traction since Binance CEO Changpeng Zhao stepped down after the U.S. Department of Justice ruled that the exchange would have to pay a $4.3 billion fine.
Read More: 9 Best Crypto Demo Accounts For Trading
UNI Price Prediction: How Long Will Rally Continue?
While the weekly time frame chart shows that the UNI price trend is bullish, the daily one indicates that an initial retracement is expected before the price continues its ascent.
This is because of the Elliott Wave count and the RSI. Technical analysts employ the Elliott Wave theory to identify recurring long-term price patterns and investor psychology, which helps them determine the direction of a trend.
The most likely count suggests that the altcoin has completed a five-wave upward movement and will now correct. This possibility is supported by the daily RSI, which has generated a bearish divergence (green).
Therefore, if the UNI downward movement continues, the price can fall by another 20% and reach the 0.618 Fib retracement support at $4.85.
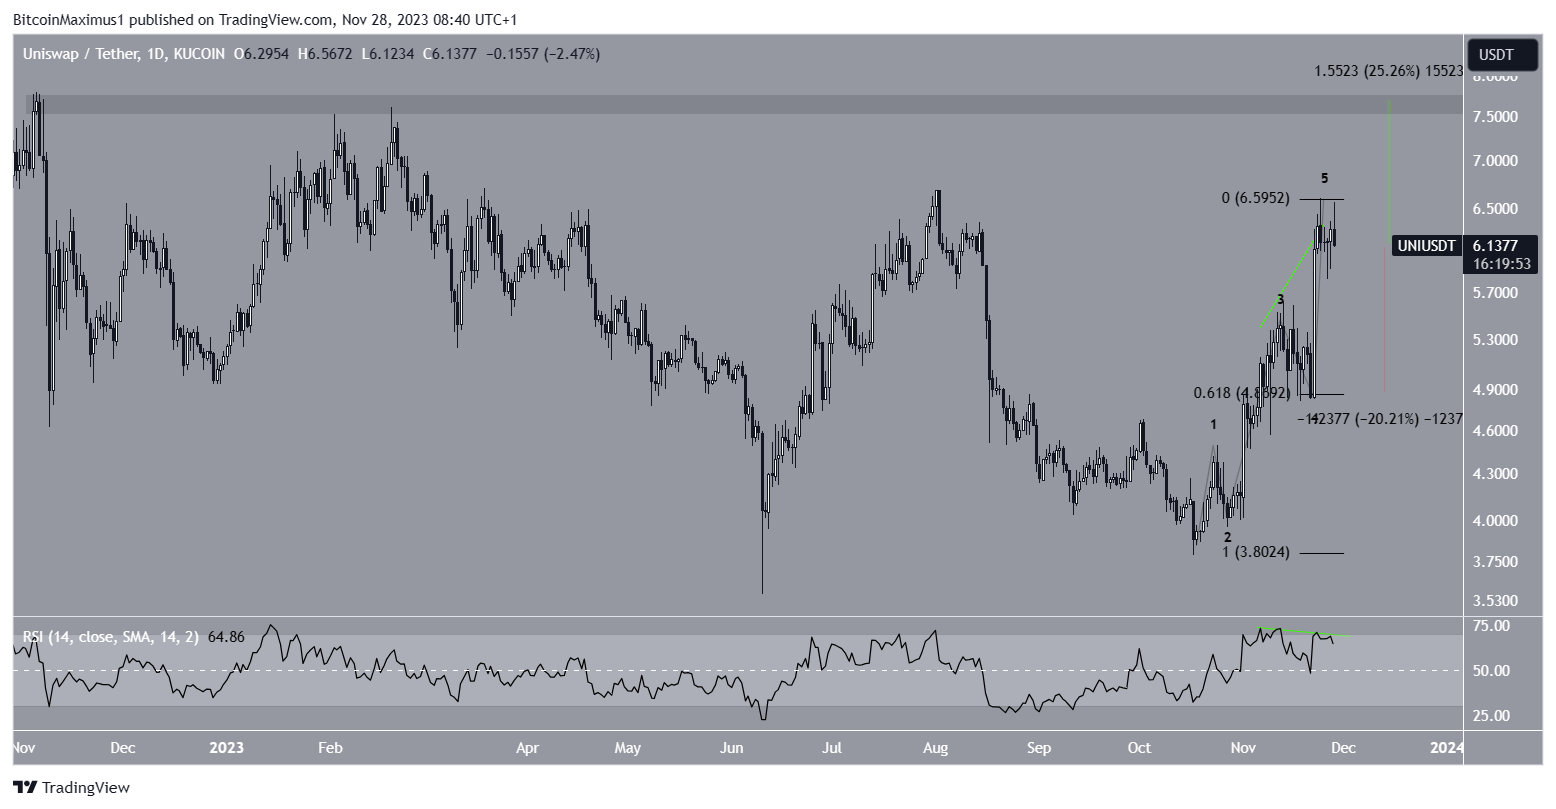
Despite this bearish UNI price prediction, an increase above the November 24 high at $6.60 will mean the correction is complete and can cause a 25% increase to the next resistance at $7.60.
Read More: Top 9 Telegram Channels for Crypto Signals in 2023


