This Cartesi (CTSI) price prediction aims to shed light on the token as an investment prospect. It will also help you make realistic future price projections per the trading volume, market cap, fundamentals, historical data, and other insights. But first, some background on Cartesi.
Remember “Hello World’? It’s the first command you type when programming, regardless of the language you are exploring. While every real-world programming journey requires you to start with an operating system — Windows, macOS, and Linux notwithstanding — Cartesi is a definitive, blockchain-specific solution. It’s an OS that helps you iron out your development-centric dependencies by letting you connect real-time tools to a decentralized ecosystem. Sounds pretty innovative, right? Read on to learn about the project’s future in this Cartesi price prediction deep dive.
- Cartesi price prediction based on fundamental analysis
- Cartesi tokenomics: Can it impact the prices?
- Cartesi market cap, trading volume, and trading markets
- CTSI price prediction via on-chain metrics
- Cartesi price forecast using social activity
- Cartesi price prediction using technical analysis
- Cartesi (CTSI) price prediction 2023
- Cartesi (CTSI) price prediction 2024
- Cartesi (CTSI) price prediction 2025
- Cartesi (CTSI) price prediction 2030
- Cartesi (CTSI) long-term price prediction until 2035
- How accurate is the Cartesi price prediction?
- Frequently asked questions
Cartesi price prediction based on fundamental analysis
Cartesi is a layer-2 solution that focuses on solving infrastructure-specific issues for developers. The OS lets you program smart contracts in standard programming languages, facilitating a move beyond Solidity.
The aim: bringing blockchain to mainstream software.
However, that’s not the money-spinner here. Cartesi brings innovative solutions to achieve the above-mentioned use case. These include:
- Optimistic rollups;
- Side-chains, and;
- The LVM (Linux Virtual Machine).
In layman’s terms, this blockchain might soon become the go-to hangout spot for developers who prefer decentralization and scalability.
That makes the Cartesi price prediction surprisingly solid. Here are a few fundamental things you need to know about Cartesi before moving to the price forecasts:
- Dates back to 2018. Hence, it has a historical foundation.
- It does not depend on Solidity or any blockchain-specific language to thrive.
- Focuses on increasing the developer pool.
- Has a celebrated set of investors behind it.
- Native token CTSI pays for transactions made to node owners.
- You can stake CTSI to turn a block producer, making Cartesi a proof-of-stake (PoS) network.
- Standard staking, without block production authority, is also available.
- Built on the Ethereum network, CTSI is an ERC-20 token and, therefore, compatible with most crypto wallets.
Did you know? Being proof-of-stake (PoS) increases the chances of institutional adoption of the project, owing to its eco-friendly traits.
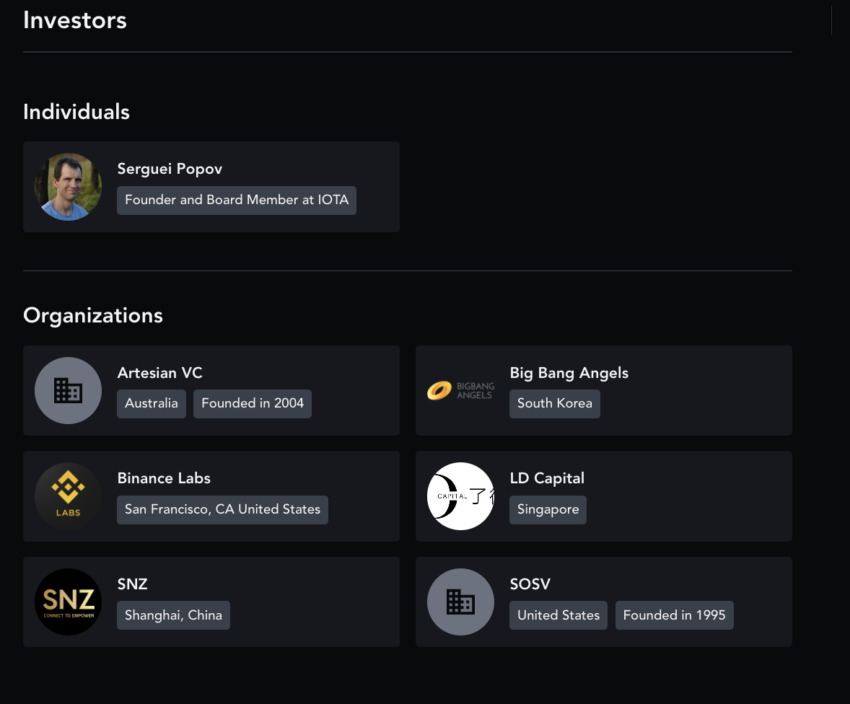
Overall, Cartesi looks promising as a project. This is especially true in a crypto market focused on building good products with reliable infrastructure.
Cartesi tokenomics: Can it impact the prices?
Firstly, the supply of CTSI tokens is limited. That’s a good thing. Also, the token’s purpose is to drive adoption and speed up ecosystem development. This makes sense, considering it is a developer-specific innovation.
Now let’s delve deeper and understand the token sale patterns across different funding rounds:
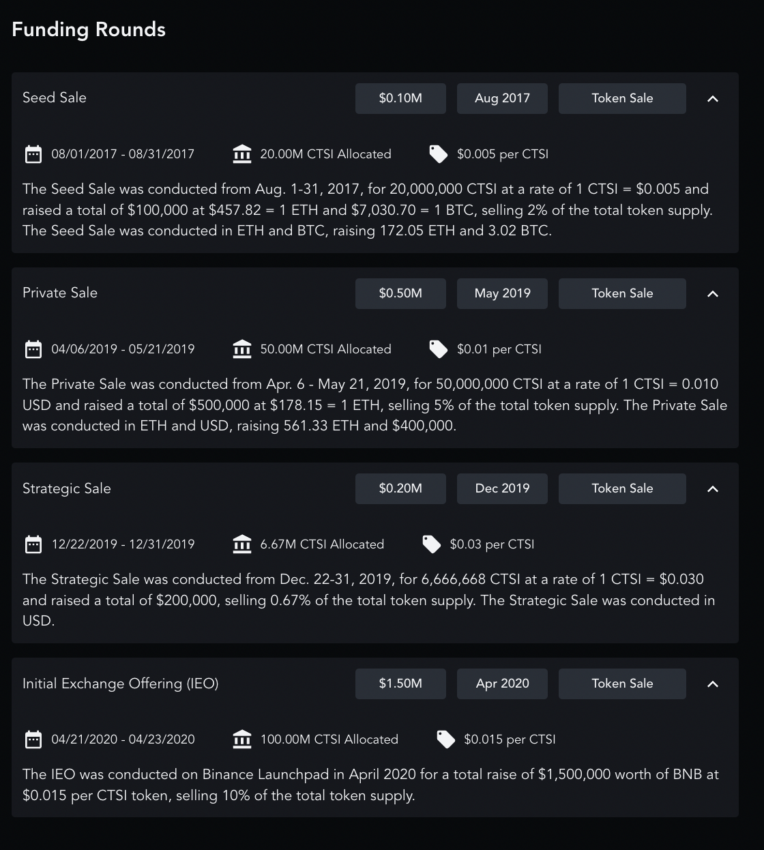
If you look at the snapshot above, it is clear that CTSI tokens were offered as part of multiple sale initiatives. These include a seed sale, private sale, strategic sake, and IEO. Do note that Binance-backed IEO concluded on April 23, 2020, after which CTSI was listed on Binance. We shall shortly come to the price chart.
Here is the existing supply breakdown for the CTSI tokens. Note that this supply breakdown is for 82.33% of the total 1 billion tokens, as 17.67% were distributed across multiple pre-sale events.
57.33% of tokens locked for the project and founders might be a red flag, but we need more evidence to comment further.
As of July 8, 2021, 20.83% of CTSI tokens were circulated. Here is a transparency report showing the same. As of Dec. 10, 2022, 65% of tokens are circulated.
Also, here is how the circulating supply has impacted the price action to date.
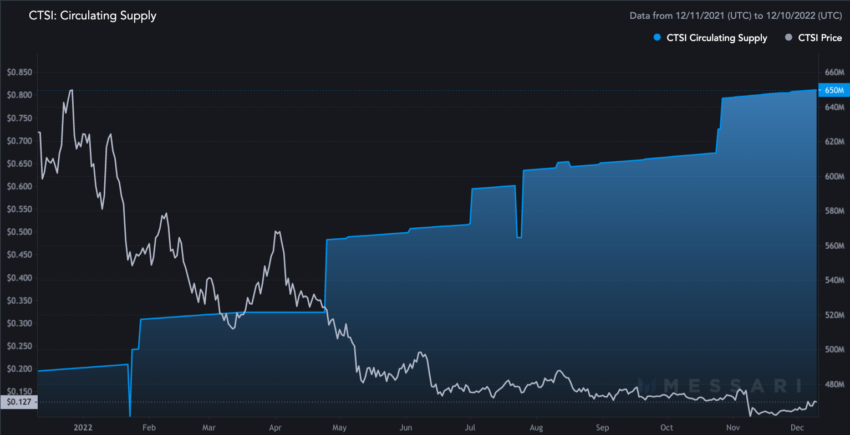
Finally, CTSI tokens follow a proper vesting schedule for the team, advisors, and even the foundation reserve to keep sell-off pressure to a minimum.
All the tokens are expected to be unlocked by the end of 2027. Hence, the CTSI price prediction post-2027 should show more strength.
Cartesi market cap, trading volume, and trading markets
Let us now look at Cartesi’s market cap and trading volume setup to understand its current volatility compared with when it was at its peak.
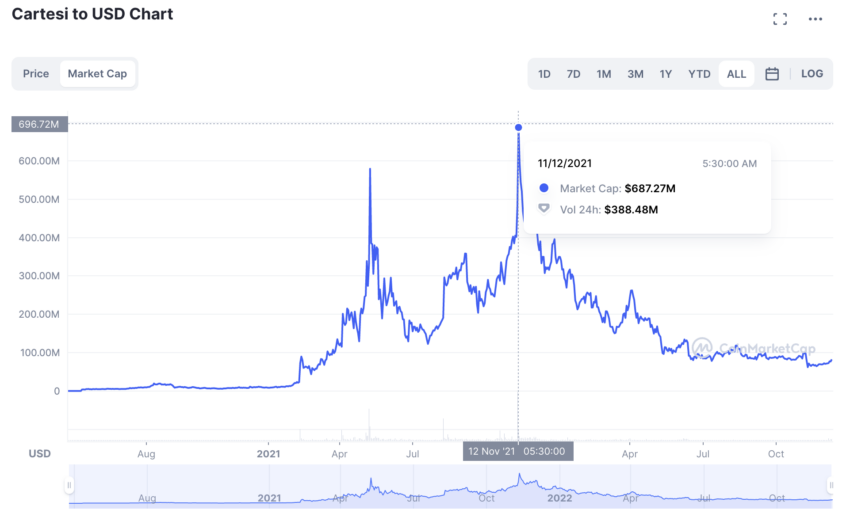
Cartesi’s market cap was the highest on Nov. 12, 2021. Market cap: $687.27 million and trading volume: $388.48 million. The trading volume to market cap ratio as of Nov. 12, 2021: 0.56.
Currently, as of Dec. 10, 2022, Cartesi’s market cap is $82.38 million. Its trading volume is $54.29.
The turn-over ratio as of today is 0.65.
Hence, the CTSI token is less volatile at this time, which seems positive for the price action going into 2023. As per latest update, this is one of the many reasons why CTSI surged past $0.3 in 2023.
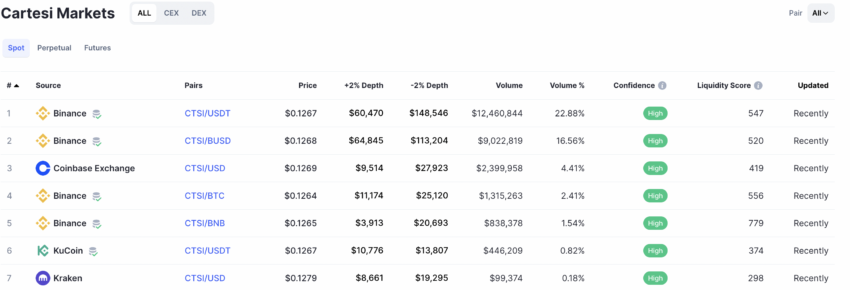
Coming to trading markets, CTSI has an extensive exchange spread. The CTSI-USDT pair on Binance is the most popular, holding 22.88% of the overall CTSI trading volume as of December 2022. The liquidity score is also good enough to show decent trading action.
CTSI price prediction via on-chain metrics
Cartesi’s development activity has been on an upward swing over the past few months, as of 2022 data. The activity has been up for quite some time, showing developers are taking the blockchain OS seriously.
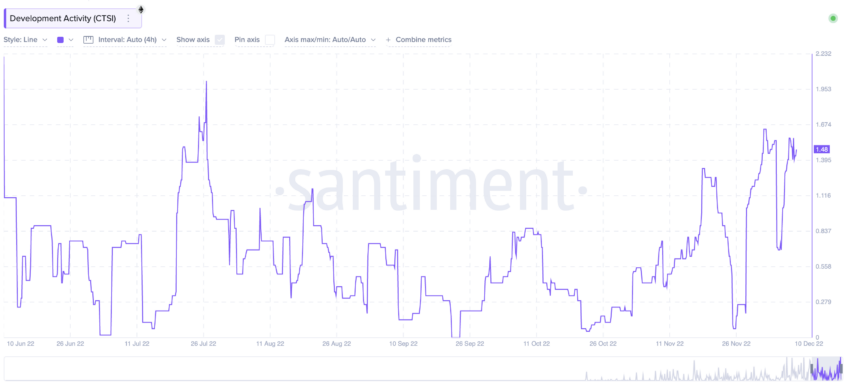
Do note that the corresponding price action also moved up for a while during this time. However, the bear market soon prevailed.

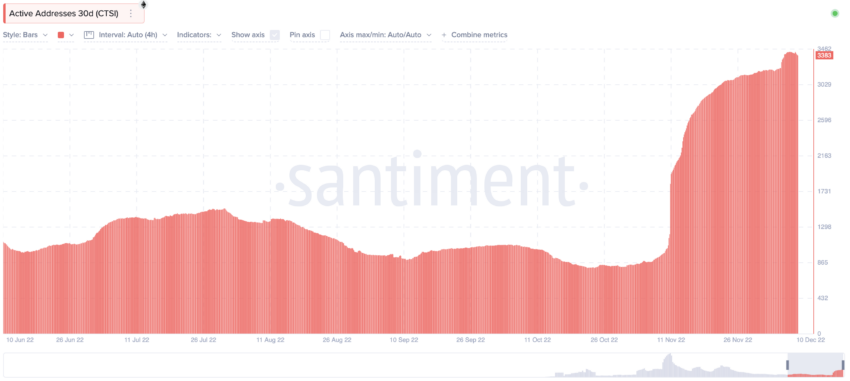
Check the growing number of active addresses in 2023 — a metric that shot through the roof over the past month — November 2022.
Most importantly, the MVRV ratio until November 2022 showed a gradual trend toward decreasing selling pressure.
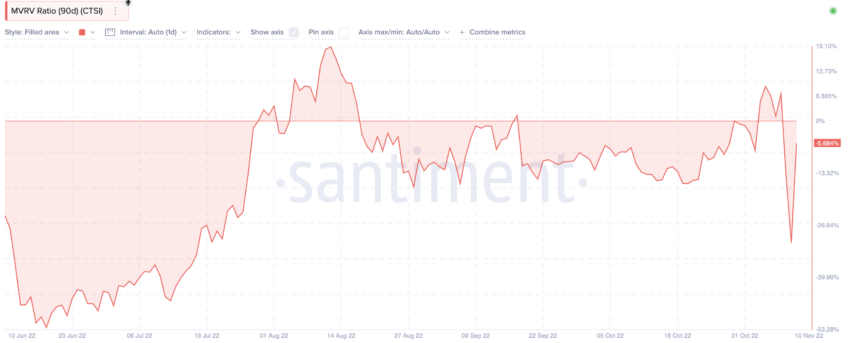
Note that CTSI’s MVRV was this low in June 2022, and a short rally followed.
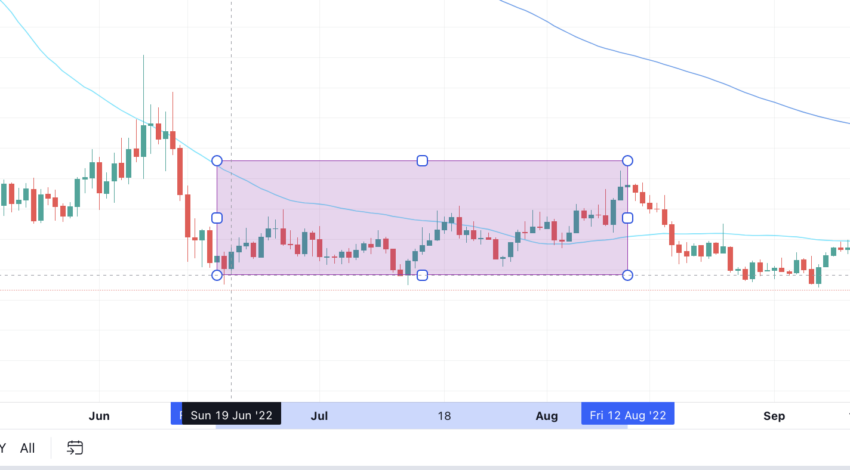
Overall, the metrics suggest a possible price uptrend over the next few months.
Cartesi price forecast using social activity
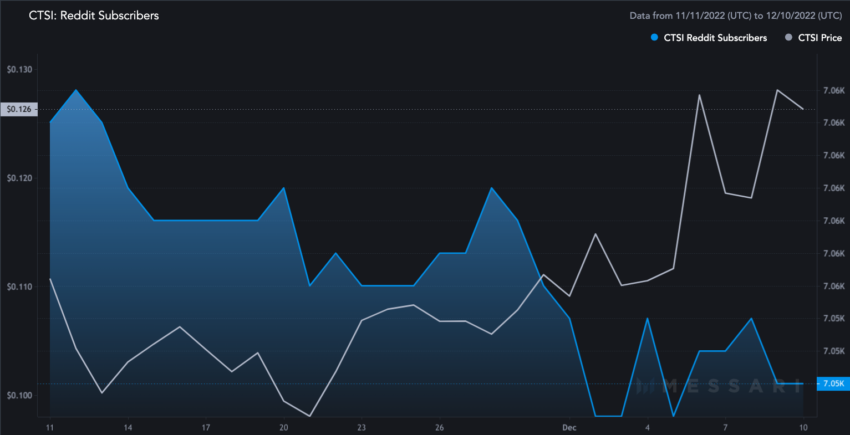
Cartesi’s Reddit subscribers have dropped in the past 30 days. This might be due to a lack of interesting revelations regarding project growth. However, the prices went up during that time, signifying most hands were busy accumulating.
On the other hand, Cartesi’s Twitter followers grew over the past month. This was in line with the increase in prices.
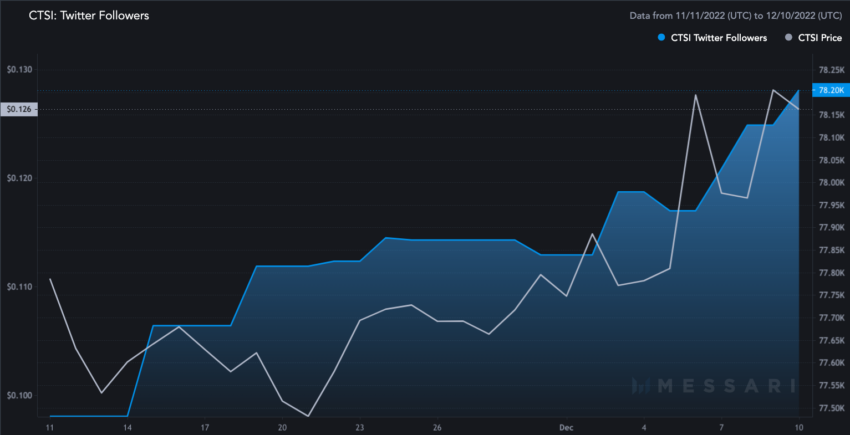
Hence, Cartesi’s Twitter following positively correlates to CTSI’s price action.
Cartesi price prediction using technical analysis
Now, we will move to CTSI’s technical analysis, using historical data to predict patterns and future price action. Before we do, here’s what we currently know about the CTSI token:
- The maximum price of the Cartesi token (CTSI) is $1.75, reached on May 9, 2021.
- Currently, CTSI ranks 236 in terms of market cap.
Now let us look at the daily chart, and here is a pattern in sight, from 2022:
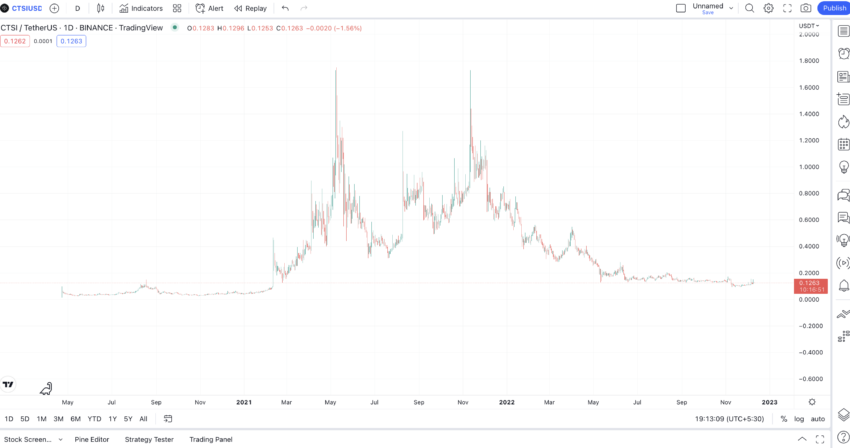
CTSI-USDT forms a symmetrical pattern as per the daily chart.
CTSI starts at point (A), makes a small high (B), pushes through to make another high, and peaks at (D). Now consider point H, the lower high as the middle point, kickstarts another pattern with the peak at X. Then comes a lower high at Y, another lower high at Z, and finally, the current level (O).
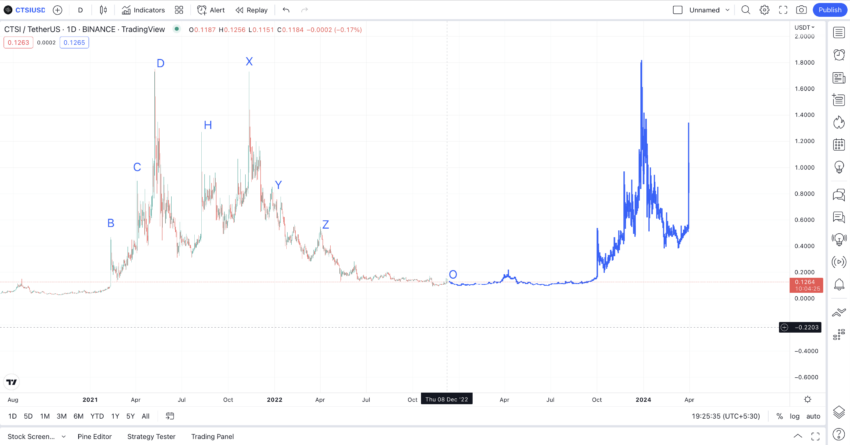
See that the pattern A-B-C-D-H is a mirror image of the pattern H-X-Y-Z-O.
Measuring the price change
Outlook: Bullish
This Cartesi price prediction assumes the pattern will be repeated. Hence, from O, we should move to another B, like high, and so on and so forth.
Here is what the projected path looks like for CTSI.
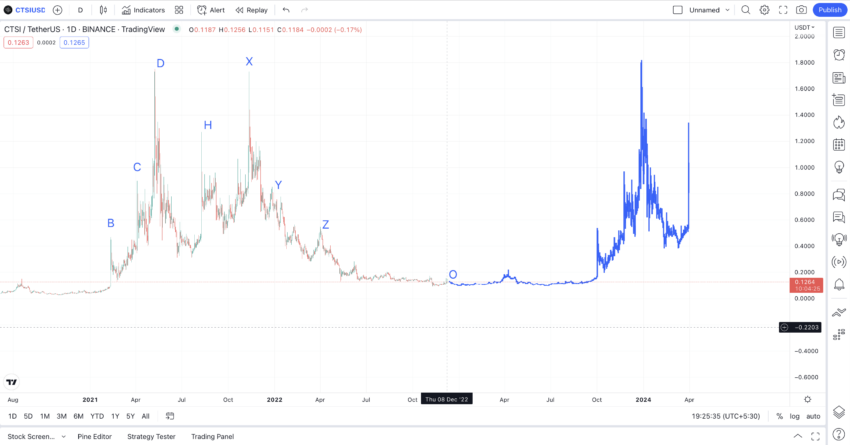
Next, we consider the distance between A and B and Z to O. In doing this, we can see if point O is the end of the previous pattern.
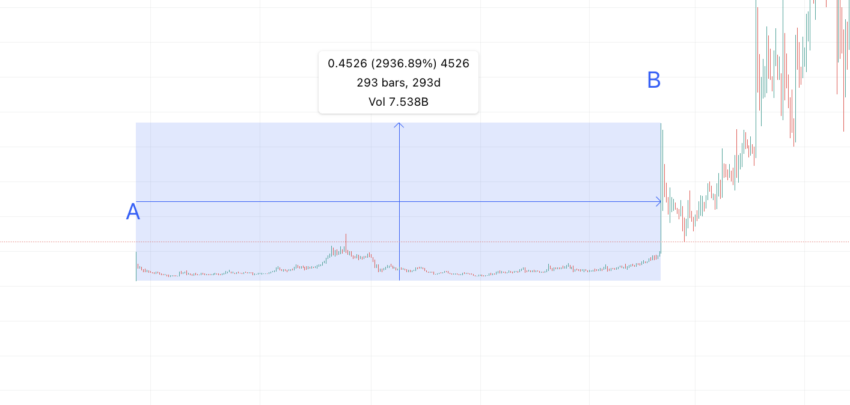
A to B took 293 days and a 2936.89% growth.
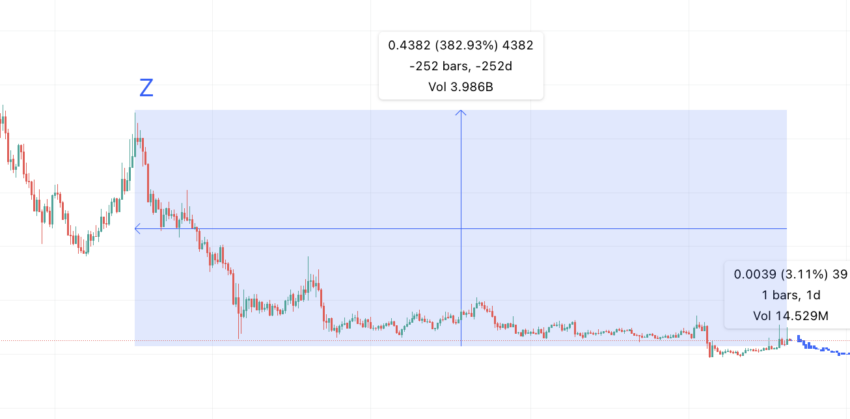
O to Z took 252 days and a 382.93% growth.
The time taken is similar. So we can take the average starting point to the first high as the average of 293 and 252 days. That comes out to be 272.5 or 273 days approximately.
The percentage growth dropped by a factor of 7.66 or 7.5 to round it off.
If the same bear market conditions exist, we can expect CTSI to show the next high within 273 days. However, the percentage growth would be 382.93/7.5, which is 51%.
Cartesi (CTSI) price prediction 2023
Our 2023 price prediction for CTSI was successful, making us all the more optimistic for 2024. Here is what we analyzed for CTSI:
Now, by extrapolating from point O, we get the next high at $0.1767 by Sept. 8, 2023.
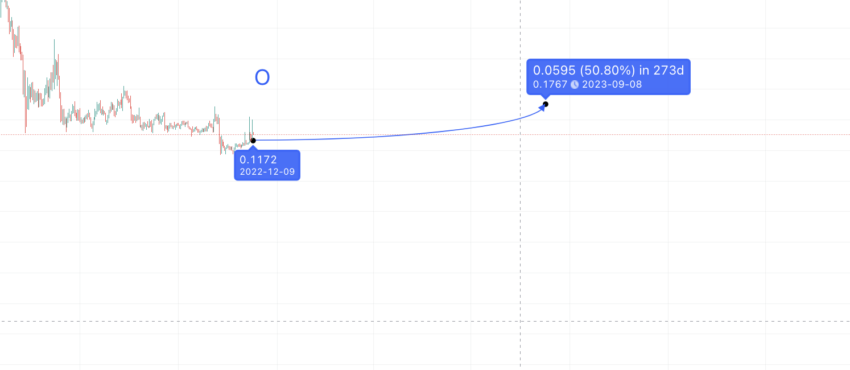
To find the low in 2023, we can retrace the path from O to Z and look for the lowest point there. This path has a low that is 30 days away from point O, with a drop of 37.86%. If we go by the mirror pattern, then it would take approximately 30 days and a 37.86% drop to form the next low.
That would be somewhere around Jan. 9, 2023, and at $0.0733.
Here is the path:
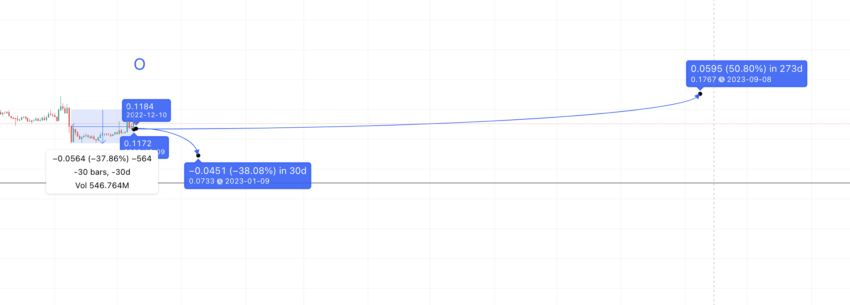
In 2023, CTSI might reach $0.1767 as a high and $0.0733 as a low.
Short-term trend using moving average lines, patterns, and momentum
Outlook: Moderately bullish
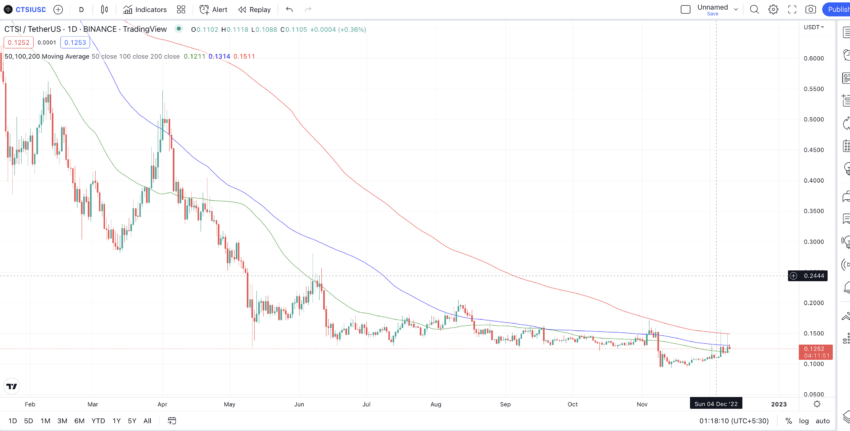
If you look at the zoomed-in chart, you will notice the green line is lower than the blue and red lines. However, the distance between the green and blue lines is reducing. The green line (20-day moving average) must cross the blue line (50-day moving average) to kickstart a rally at Cartesi’s counter.
CTSI is currently trading in a descending channel. Any break above the upper trendline can push the prices high. But will there be a trend reversal? We need to check the momentum indicator to see.

RSI is in a neutral zone for now. It must try to cross the 64 mark. Then, we will have a bullish divergence in play, provided the prices keep trading in the range.
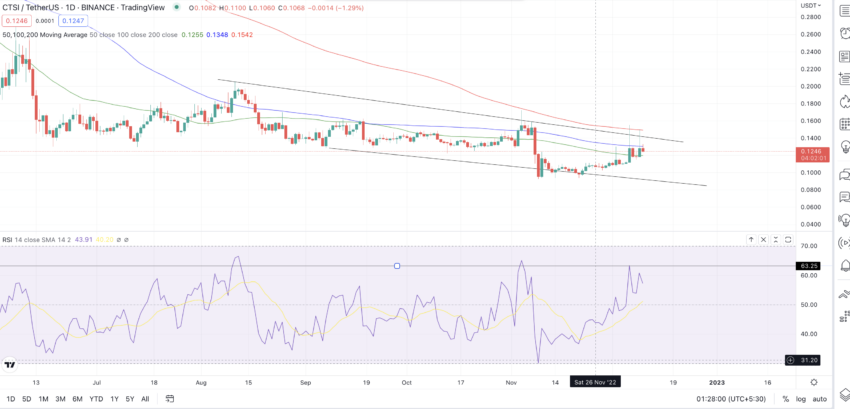
The overall sentiment looks moderately bullish. We are waiting for the RSI to give a clear indication.
Cartesi (CTSI) price prediction 2024
Outlook: Bullish
Now we have some clarity around 2023; we can plot the distances between other points to find a long-term CTSI price prediction of CTSI.
Here are the points we can plot:
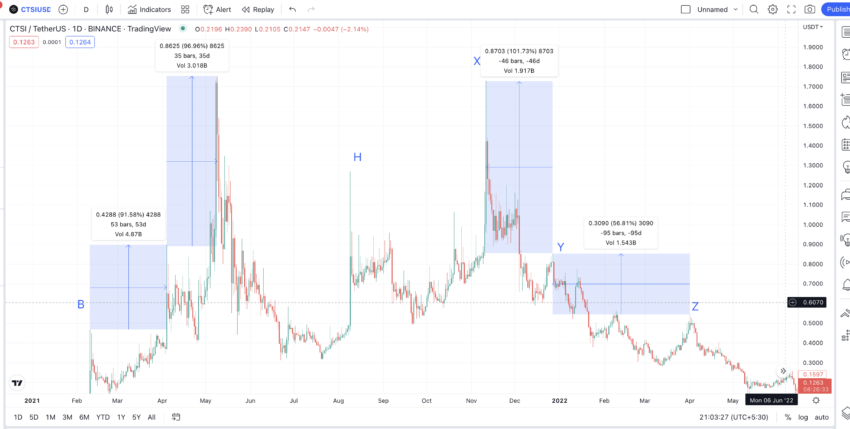
Points as per the 1st pattern:
B to C = 53 days and a 91.58% increment; C to D = 35 days and a 96.96% increment; Z to Y = 95 days and 56.81% increment; Y to X = 46 days and a 101.73% increment
So the average distance from the first high in 2023 to the next would be the average of Z to Y and B to C.
Calculations
That comes out to be 74 days and 74.19%. On drawing a path, that comes out to be $0.3071. The path shows a high in December 2023. However, if market conditions remain bearish, it might be in 2024. However, $0.30 has already been breached in 2024, which makes us optimistic about the $0.5 level in 2024.
Once that high is reached as part of the Cartesi price prediction for 2024, we can start taking the average of the next set of points.
Projected ROI from the current level: 42%
Cartesi (CTSI) price prediction 2025
Outlook: Bullish
The next set of values, per the average of (C to D and Y to X), come out as 40 days and 99%. So, the next plot would be at $0.6120.
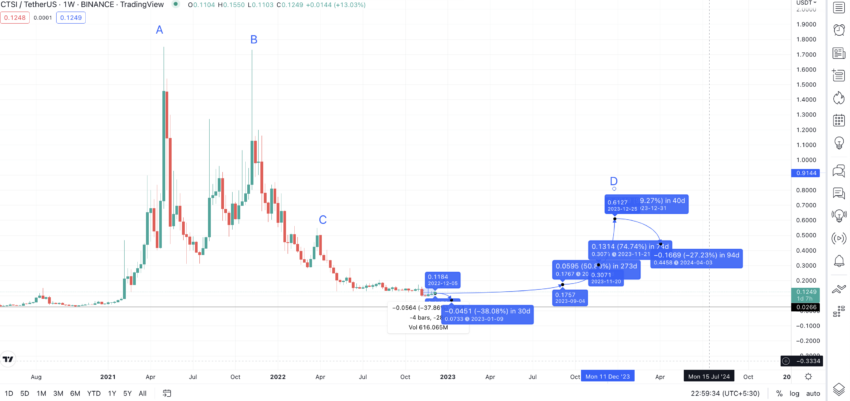
Even this high, statistically, can be seen in 2023. But as we are now in the bear cycle, a realistic expectation would be to see this happening in 2025.
For the sake of understanding, we shall extend the plots to 2025 in the next part.
The low in 2025 would be similar to the average of lows D to H and X to H.
The values are D to H = 92 days and a drop of 27.80%; X to H = 95 days and a 26.64% drop.
The average comes out to be 94 days and 27.22%.
If CTSI makes a high of $0.6120, the immediate low would be $0.4458.
Projected ROI from the current level: 70%
Cartesi (CTSI) price prediction 2030
Outlook: Very bullish
To predict CTSI’s price action long term, we need to switch over to the weekly chart. We noticed a trend:
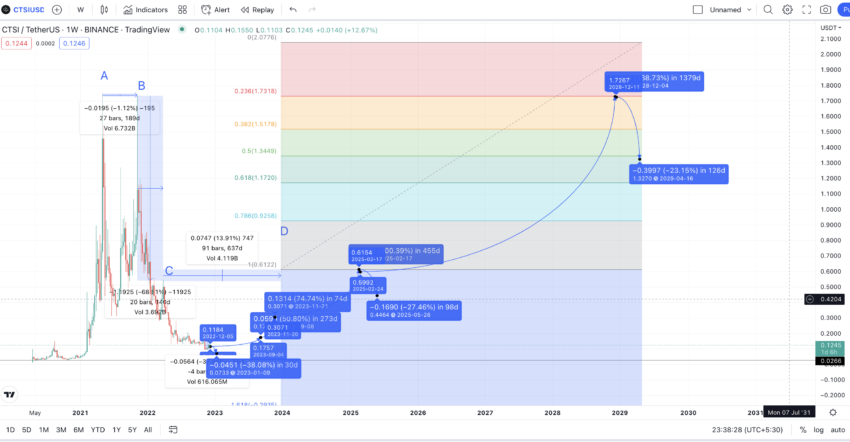
CTSI forms a lower high formation, with each peak taking more time to form compared to the previous.
The lower high pattern gets broken at D, which is the projected high of 2025. This might start a bigger rally at CTSI’s counter from 2025 to 2030.
Now let us plot the points to see where the next high could show up:
A to B = 189 days; B to C = 140 days; C to D = 637 days
Calculations
Now C to D (with D supposedly in 2025 instead of 2023) takes longer due to the bear market’s effect. D crossing above C breaks a down-trending pattern on the weekly charts we discussed earlier.
Still keeping the bear market in mind, let us assume that CTSI makes a new high after 637 days.
But the question is, where would that point be? For that, we can use the Fib levels plotted from the highs 2025.
If CTSI follows the same path as before, it can go as high as $1.73 by 2028. Notice this would be close to CTSI’s all-time high and might be where it can reach a maximum price point. The lows that year can go up to $1.347.
Once CTSI reclaims an all-time high, we can expect exponential growth in its price. For that. Let us use the Fib levels at the 2028 point.
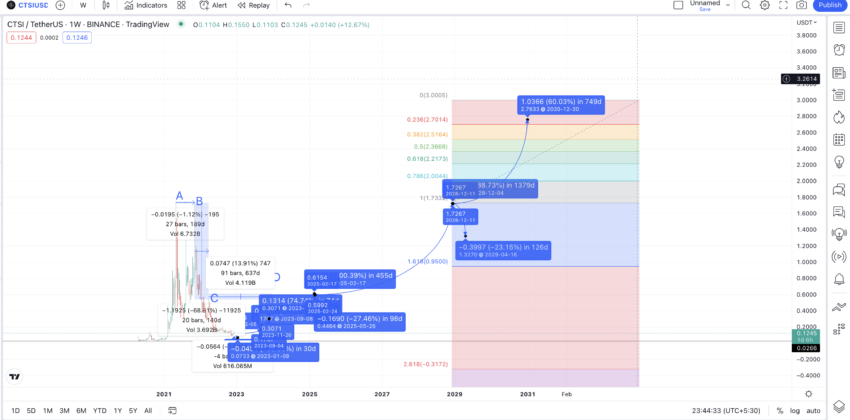
Notice how steep the slope can get if CTSI breaks the all-time high in 2028 or even 2029. By 2030, we can expect CTSI to reach $2.76 or even higher, depending on the market conditions.
Projected ROI from the current level: 666%
Cartesi (CTSI) long-term price prediction until 2035
Outlook: Exciting
You can easily convert your CTSI to USD
Now that we have a path ready for CTSI till 2030, we can discuss how it might move till 2035. If you’re considering investing in CTSI, this table might help you plan a long-term strategy:
| Year | | Maximum price of CTSI | | Minimum price of CTSI |
| 2024 | $0.5 | $0.1560 |
| 2025 | $0.6120 | $0.4458 |
| 2026 | $0.9180 | $0.4790 |
| 2027 | $1.1016 | $0.6606 |
| 2028 | $1.73 | $1.347 |
| 2029 | $2.076 | $1.40 |
| 2030 | $2.76 | $2.21 |
| 2031 | $3.58 | $2.74 |
| 2032 | $4.12 | $3.45 |
| 2033 | $4.95 | $4.18 |
| 2034 | $5.19 | $4.37 |
| 2035 | $5.47 | $4.56 |
The price of CTSI might not follow the projections linearly. Significant developments can ensure that key price levels are achieved earlier. Keep an eye out for CTSI reaching $0.6120 by the end of 2025, which is certainly a possibility.
How accurate is the Cartesi price prediction?
The Cartesi price prediction model looks practical. We have taken the tokenomics, network activity, on-chain action, and also technical analysis into consideration. However, crypto is in a bear market, and Cartesi is trading at a near 93% discount from its all-time high. So, you should always aim for an average trading price fulfillment instead of relying all on predicted highs. The actual future price might differ; this Cartesi price prediction can only indicate a potential path.
Frequently asked questions
Does Cartesi have a future?
How much will Cartesi be worth?
Can CTSI hit 10 dollars?
Disclaimer
In line with the Trust Project guidelines, the educational content on this website is offered in good faith and for general information purposes only. BeInCrypto prioritizes providing high-quality information, taking the time to research and create informative content for readers. While partners may reward the company with commissions for placements in articles, these commissions do not influence the unbiased, honest, and helpful content creation process. Any action taken by the reader based on this information is strictly at their own risk. Please note that our Terms and Conditions, Privacy Policy, and Disclaimers have been updated.


