


The Stellar (XLM) price has broken out from a descending resistance line but failed to reclaim the $0.13 horizontal area. Whether it moves above it or gets rejected can determine the future trend.
The price action in both the weekly and daily timeframe suggests that the trend is bullish and XLM will successfully move above the $0.13 area. The RSI also aligns with the Stellar price analysis.
Stellar Price Bounces at Long-Term Support
The weekly time frame technical analysis for XLM provides a mostly bullish outlook. The main reason for this is the breakout from a long-term descending resistance line in January and subsequent reclaim of the $0.105 horizontal area. Before this, the area had acted as support between April – Oct. 2022.
After failing to break out in April 2023, XLM finally broke out in July, reaching a high of $0.195. However, the price has fallen since, creating a long upper wick (red icon) in the process.
Despite the drop, XLM validated the $0.105 horizontal area and bounced. Such a retest is common after the price breaks out from its initial resistance level.
XLM now trades nearly 20% above the $0.105 area and 80% below the next resistance at $0.230.
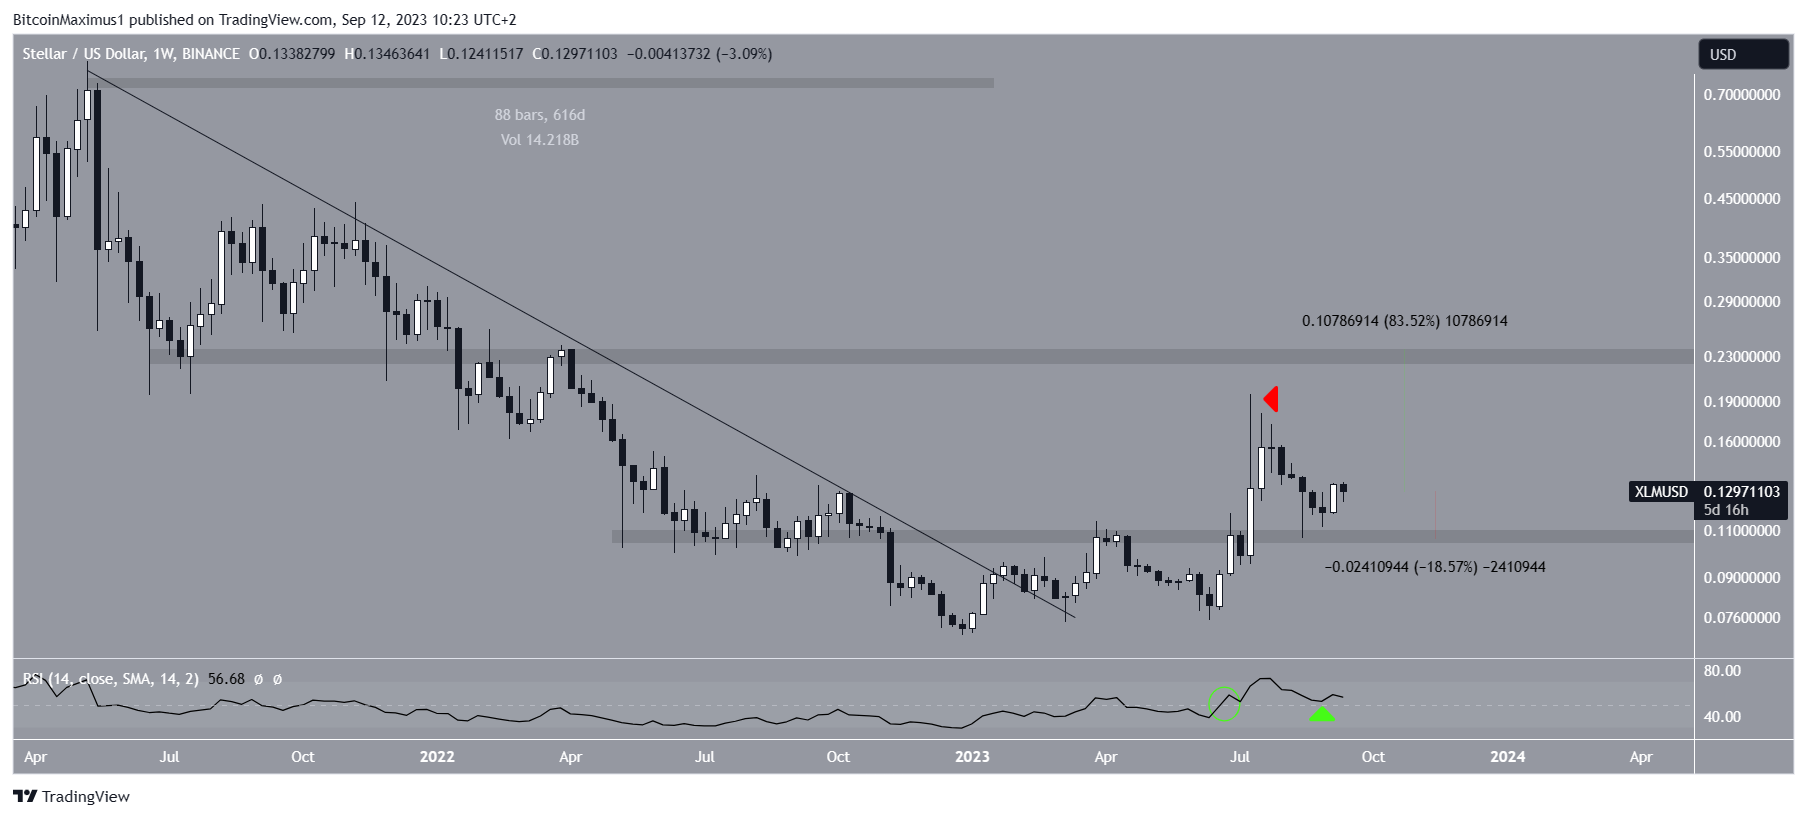
The weekly RSI is bullish, supporting the continuation of the increase. Traders commonly employ the Relative Strength Index (RSI) as a momentum indicator to gauge whether a market is overbought or oversold, aiding them in making decisions regarding asset accumulation or selling.
An RSI reading above 50 during an upward trend suggests a favorable position for bulls, while a reading below 50 indicates the opposite. In this context, the RSI initially crossed above the 50 mark (highlighted by the green circle) in June and subsequently confirmed this level as support in August (indicated by the green icon).
While it is possible that the upcoming FTX liquidation could cause a bearish reaction, the company has not reported a significant amount of XLM holdings.
Can XLM Price Sustain Its Breakout?
The daily timeframe also provides a bullish XLM outlook. However, this bullish prediction has not been confirmed yet due to the failure to reclaim a critical horizontal level.
On Sept. 4, XLM broke out from a descending resistance line that had been in place for 52 days. This was the culmination of an increase that had been ongoing since August 16 (green icon).
After the breakout, XLM reached a high of $0.135. However, yesterday’s fall returned the price to the $0.13 horizontal area. The price has to reclaim this area and validate it as support for the trend to be confirmed as bullish. In that case, a 26% increase to the next resistance at $0.160 will be expected.
However, the RSI has already turned bullish. The indicator broke out from its descending resistance line (green) and moved above 50, both signs of a bullish trend.
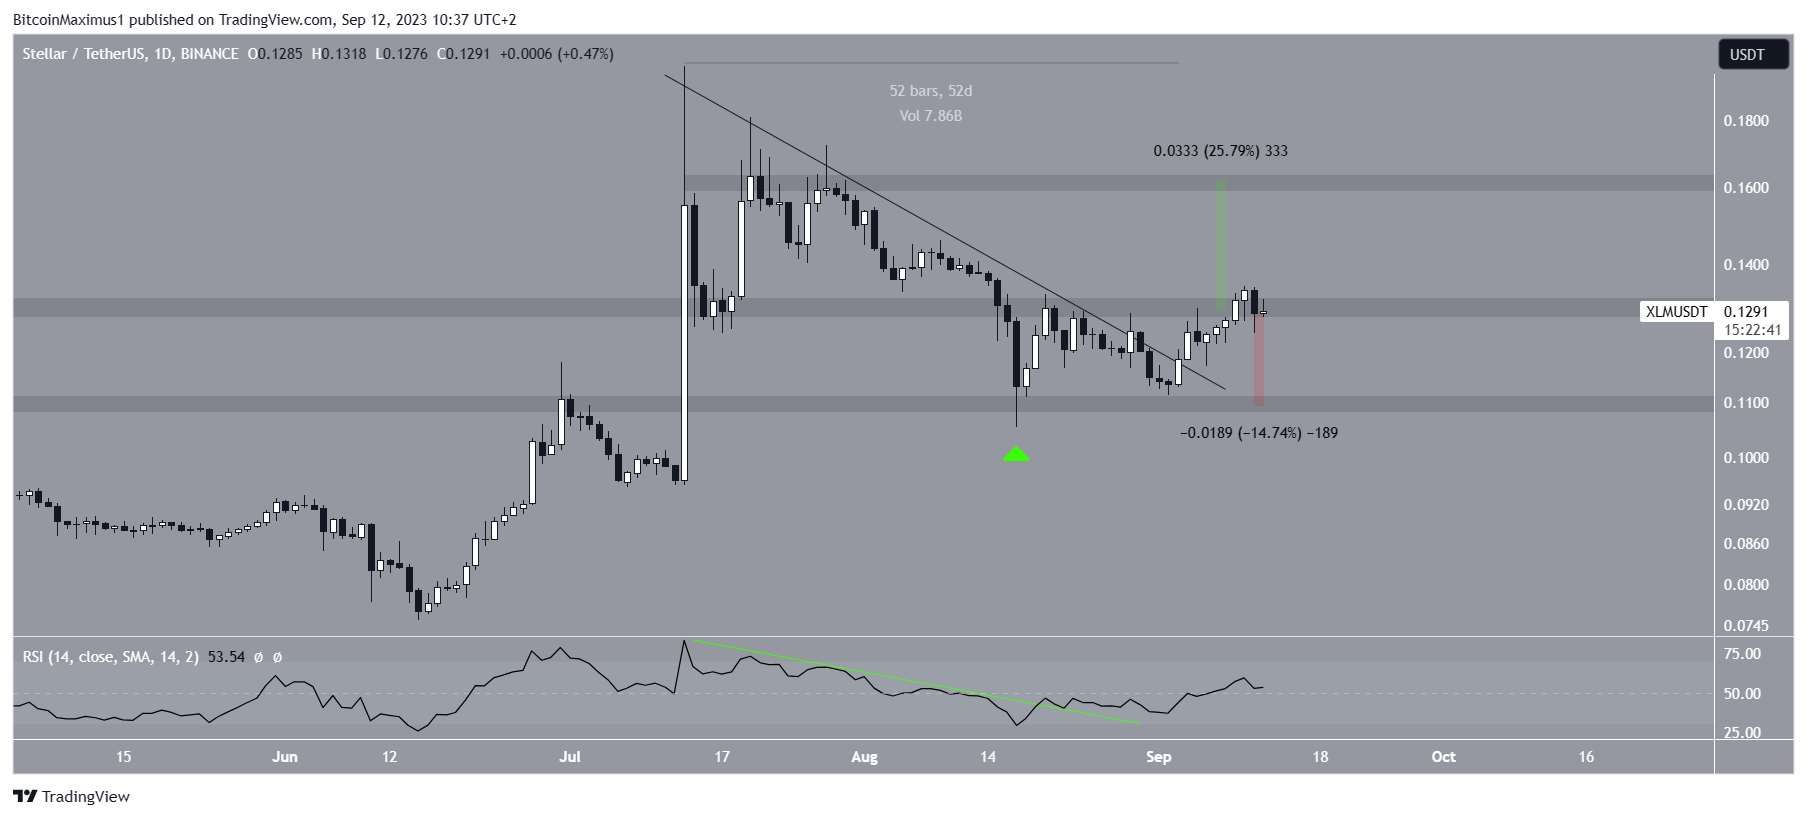
Despite this bullish XLM price prediction, a fall below the $0.13 area could lead to a drop to the $0.105 support area. This would amount to a decrease of 15%.
Interested in AI Trading? 9 Best AI Crypto Trading Bots to Maximize Your Profits
For BeInCrypto’s latest crypto market analysis, click here.


