


The Bitcoin (BTC) price has hovered slightly above the $25,700 horizontal support area for nearly a month.
While the price action is bearish, the Relative Strength Index (RSI) has given a bullish signal that previously preceded a 100% price increase.
Bitcoin Consolidates Near $26,000 Despite Bullish Divergence
The daily timeframe technical analysis gives mixed signs due to conflicting readings from the price action and the RSI.
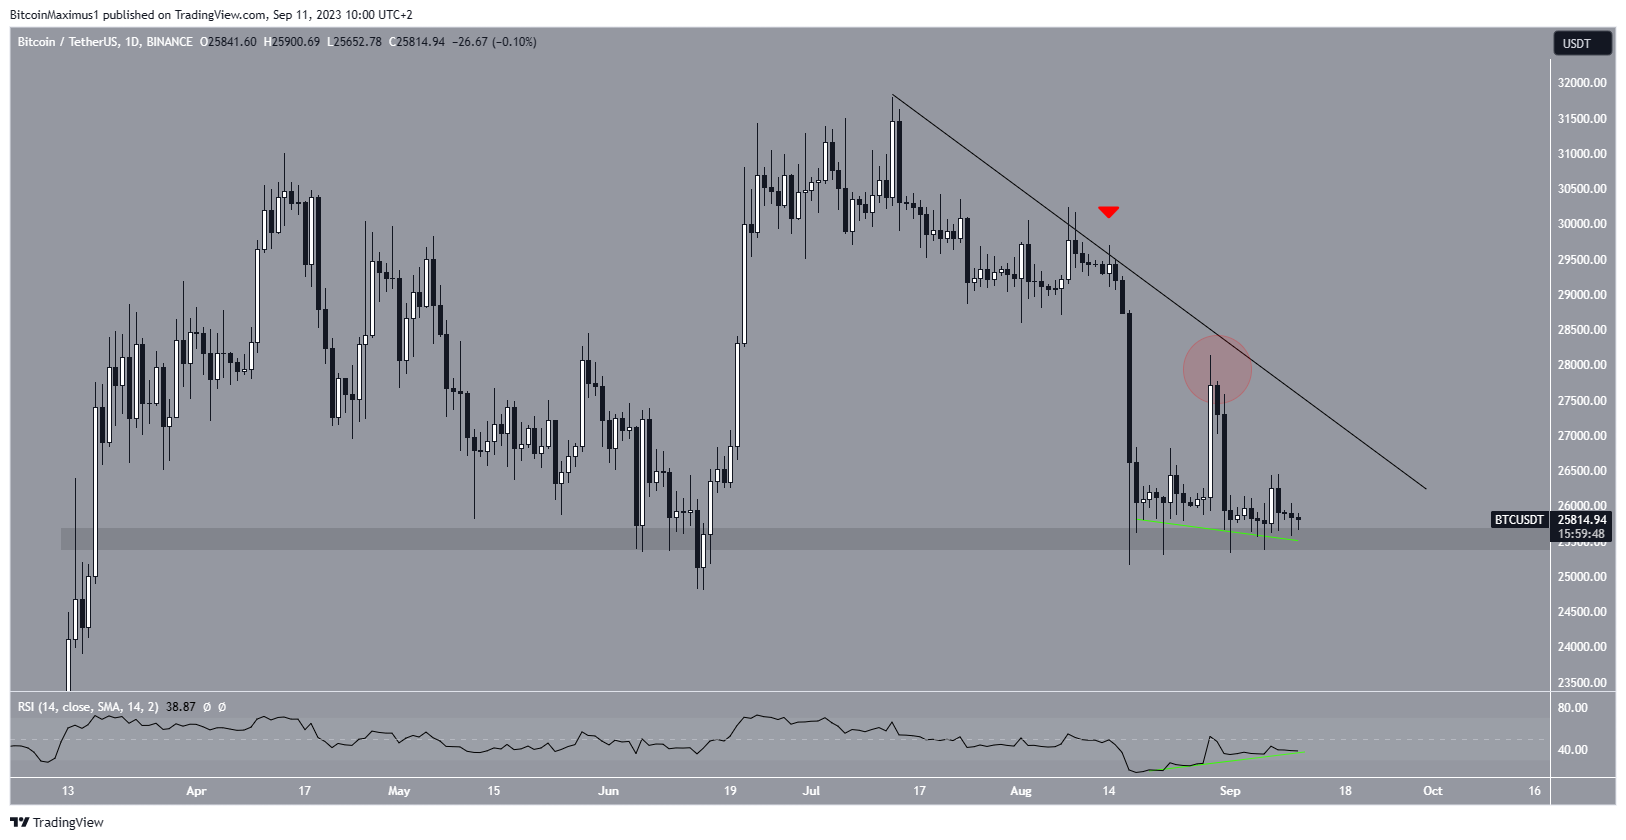
The BTC price has fallen under a descending resistance line since its $31,800 yearly high on July 13. The line was most recently validated on August 14, leading to a sharp decrease three days later that took BTC to $25,166. The price has not yet breached this low.
However, the ensuing bounces have also been weak. This is especially evident in Bitcoin’s failure to reach the descending resistance line (red circle). Now, the BTC price hovers above the $25,700 horizontal support area.
Despite these bearish readings, the Relative Strength Index (RSI) is bullish. Market traders employ the RSI as a momentum indicator to detect overbought or oversold conditions in a market and make decisions regarding asset accumulation or selling.
Readings above 50 in conjunction with an upward trend suggest that bulls maintain an advantage, while readings below 50 indicate the opposite, signaling potential bearish conditions.
While the indicator is below 50, it has increased since August 18. More importantly, the RSI has generated significant bullish divergence (green line).
This is an occurrence in which a momentum increase accompanies a price decrease. It indicates that the drop is not legitimate and is often associated with bullish trend reversals.
While the technical analysis is mixed, crypto investors still believe in Bitcoin. A recent report noted that nearly half of the world’s crypto millionaires hold wealth in Bitcoin. Additionally, the impending approval of a Bitcoin ETF could positively impact the future price.
BTC Price Prediction: What Does History Say About This Bullish Divergence?
The aforementioned bullish divergence in the daily timeframe is notable since it also marks a movement outside of the RSI oversold territory.
In the last year, the RSI fell into oversold territory and then moved outside it only three times (green dots). Furthermore, a bullish divergence in this oversold territory occurred only once, in November 2022.
This divergence catalyzed a 100% upward movement, preceding the entire increase that led to the yearly high. If another 100% increase occurs, the BTC price would reach $52,000.
In any case, a breakout from the resistance line will be required for the trend to be considered bullish.
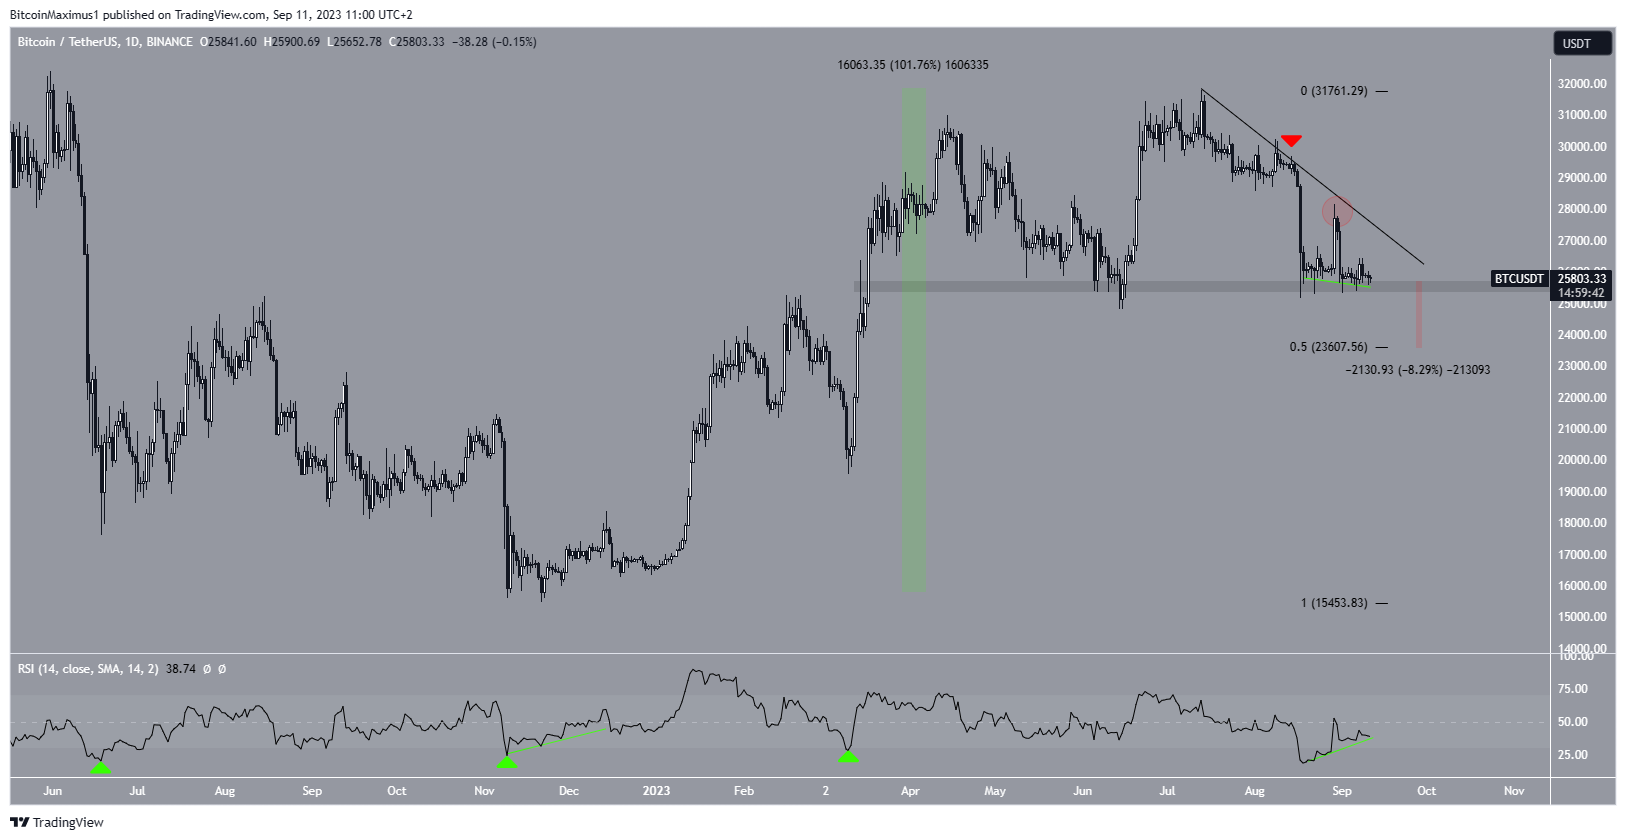
Despite this bullish BTC price prediction, a breakdown from the $25,700 area will indicate that more downside is expected. In that case, the most likely outcome will be an 8% drop to the 0.5 Fib retracement support level at $23,600.
Check out the Best Crypto Sign-Up Bonuses in 2023


