


September was a relatively neutral month for the cryptocurrency market. This was noticeable in the case of both Bitcoin (BTC) and various altcoins.
However, October is shaping up to be a more positive month for these altcoins, which have bullish-looking formations. With that said, BeInCrypto looks at the top altcoins for October that could hit new all-time highs.
Injective (INJ) Price Breakout Can Lead to All-Time High
The INJ price has increased significantly since the beginning of the year. The upward movement caused a breakout from a descending resistance trendline, which had previously been in place since the all-time high.
Afterward, the altcoin reached a new yearly high of $9.97 in April.
Since then, the Injective price has consolidated inside a symmetrical triangle, which is considered a neutral pattern. However, since the triangle transpires after an upward movement, an eventual breakout from it is the most likely future price scenario.
Furthermore, the Eliott Wave count supports the continuing increase. To determine the direction of a trend, technical analysts use the Elliott Wave theory, which involves studying recurring long-term price patterns and investor psychology.
If the count is correct, the INJ price is approaching the end of the fourth wave, after which the fifth and final increase will be expected.
Measuring the length of waves one and three, it is possible to project the length of wave five using Fib projections. According to the Fibonacci retracement levels theory, following a significant price change in one direction, the price is expected to partially return to a previous price level before continuing in the same direction.
This theory can also be used to identify the peak of future upward movements.
The 0.382 length of waves one and three would take the INJ price to a new all-time high price of $25, an increase of 250% measuring from the current price.
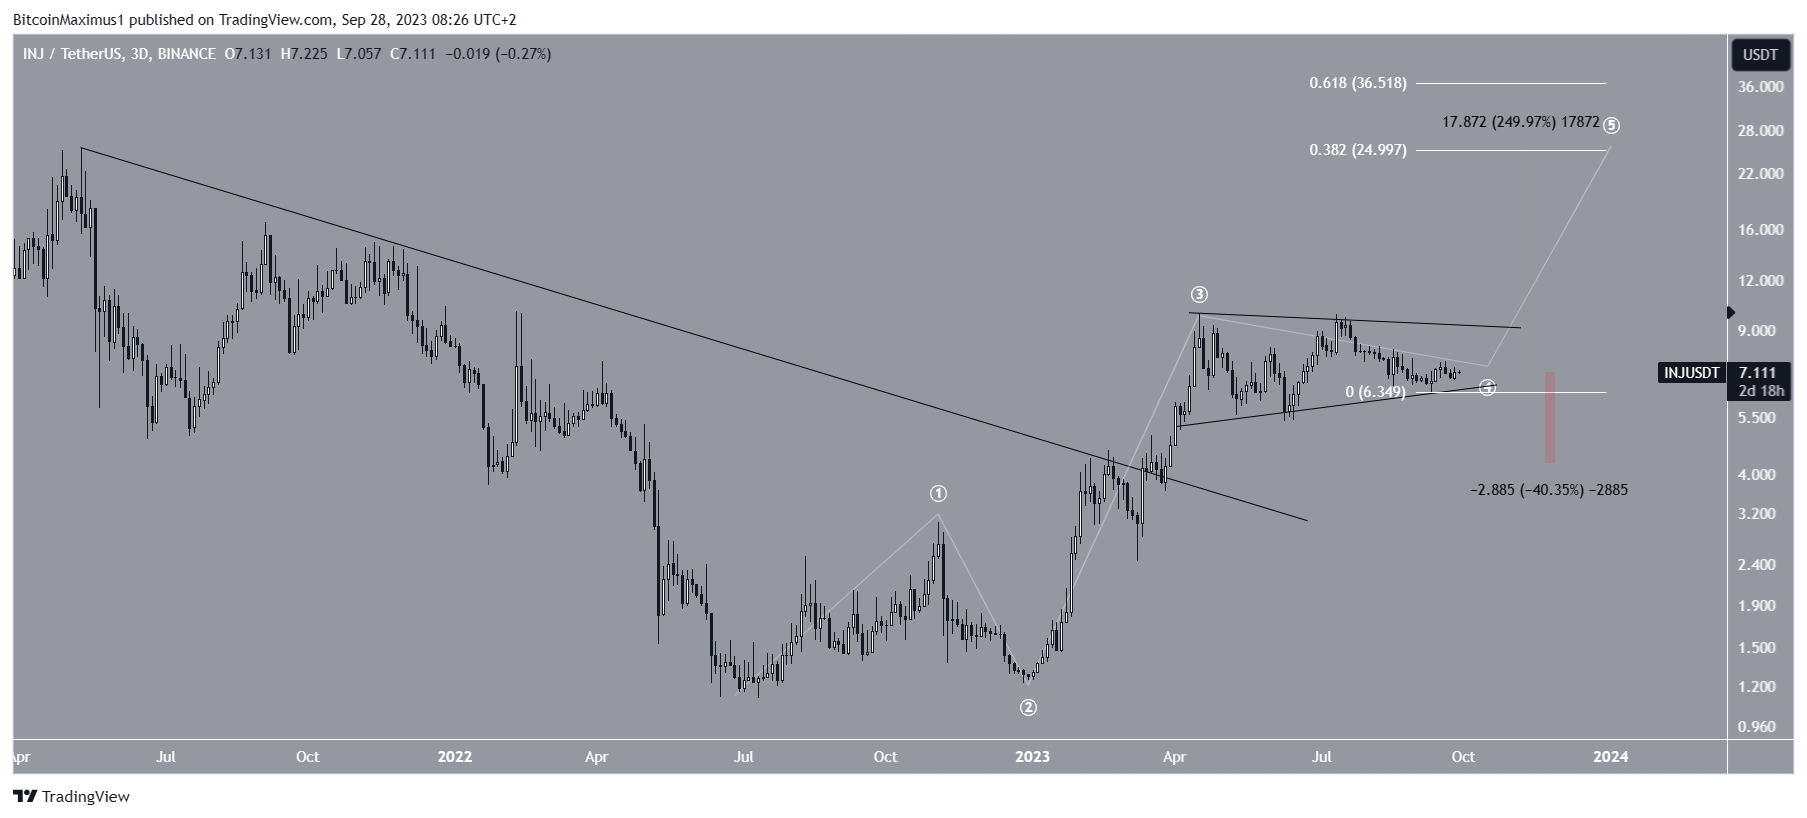
This bullish INJ price prediction would be invalidated by a breakdown from the triangle’s support line at $6.50. In that case, INJ could fall by 40% to $4.25.
OKB Price Wave Count Also Leads to New Highs
The OKB price movement is similar to INJ’s, mostly because of the wave count.
In the same fashion as Injective, the price trades inside a symmetrical triangle, in what is likely wave four of a five-wave upward movement. The price is rapidly approaching the end of the pattern, at which time a decisive movement is likely.
Due to the wave count and the fact that the triangle transpires after an upward movement, a breakout from it is the most likely future outlook.
Read More: 6 Best Copy Trading Platforms in 2023
If this occurs, the next likely area for the top will be at $72. The target is found by projecting the triangle’s length to the breakout level (white line) and the 1.61 external Fib retracement of the most recent decrease. The target is 67% above the current price.
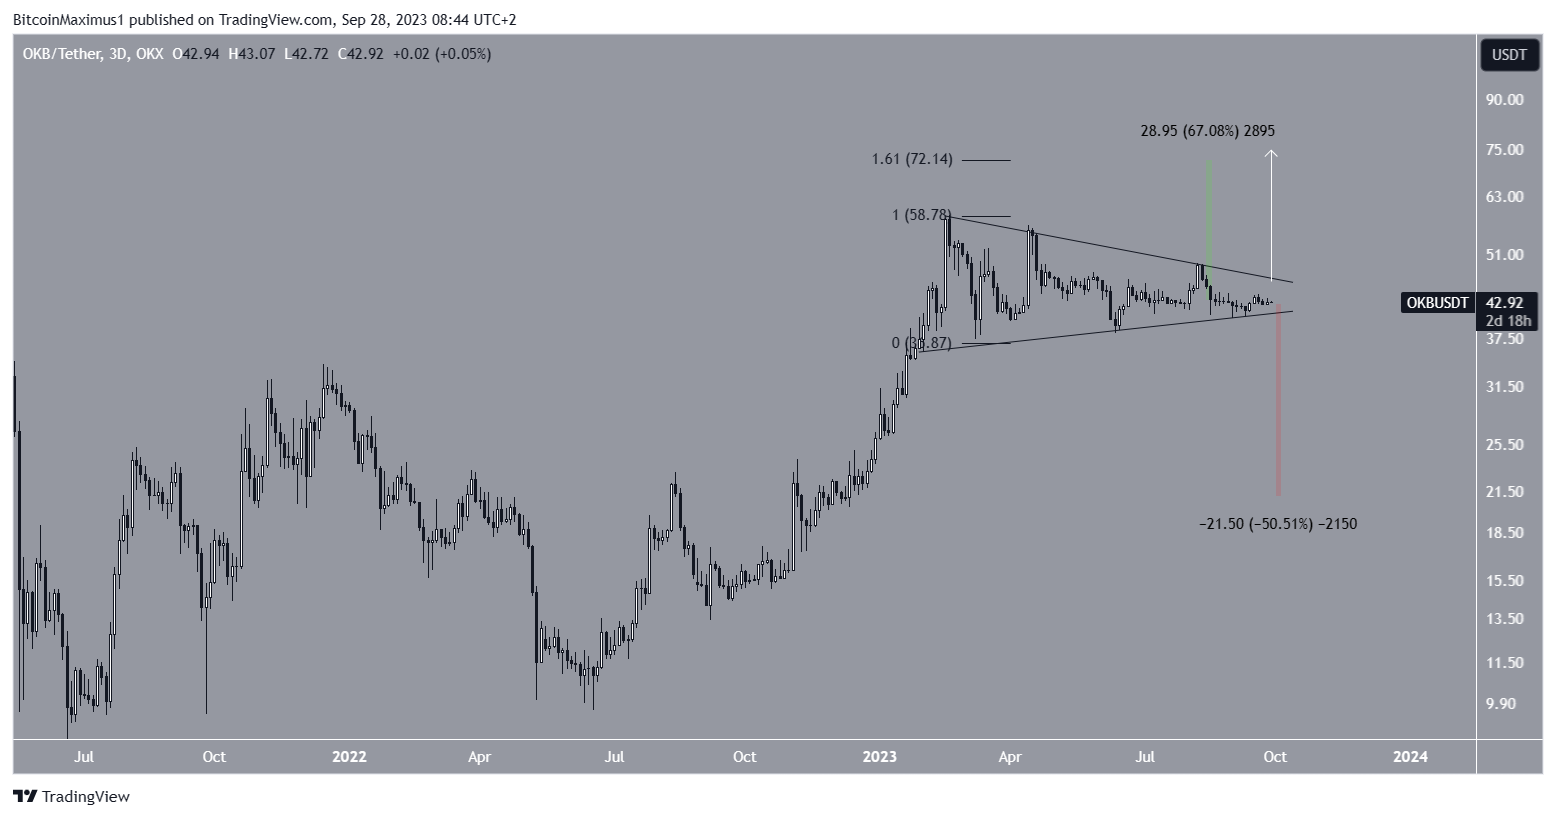
Despite this bullish OKB price prediction, a breakdown from the triangle will invalidate the count. The price could fall by 50% to $21 in that case.
Read More: Best Crypto Sign-Up Bonuses in 2023
Toncoin (TON) Breakout Catalyzes Rally
The TON price had been below a descending resistance trendline since the start of the year. This led to a low of $0.96 on June 11.
However, the price created a very long lower wick (green icon) and has increased since. In September, TON broke out from the aforementioned descending resistance line, reaching a high of $2.60.
If the increase continues, the 1.61 Fib extension of the most recent decrease is at $4.08. This is 85% above the current price and slightly below the all-time high of $4.90.
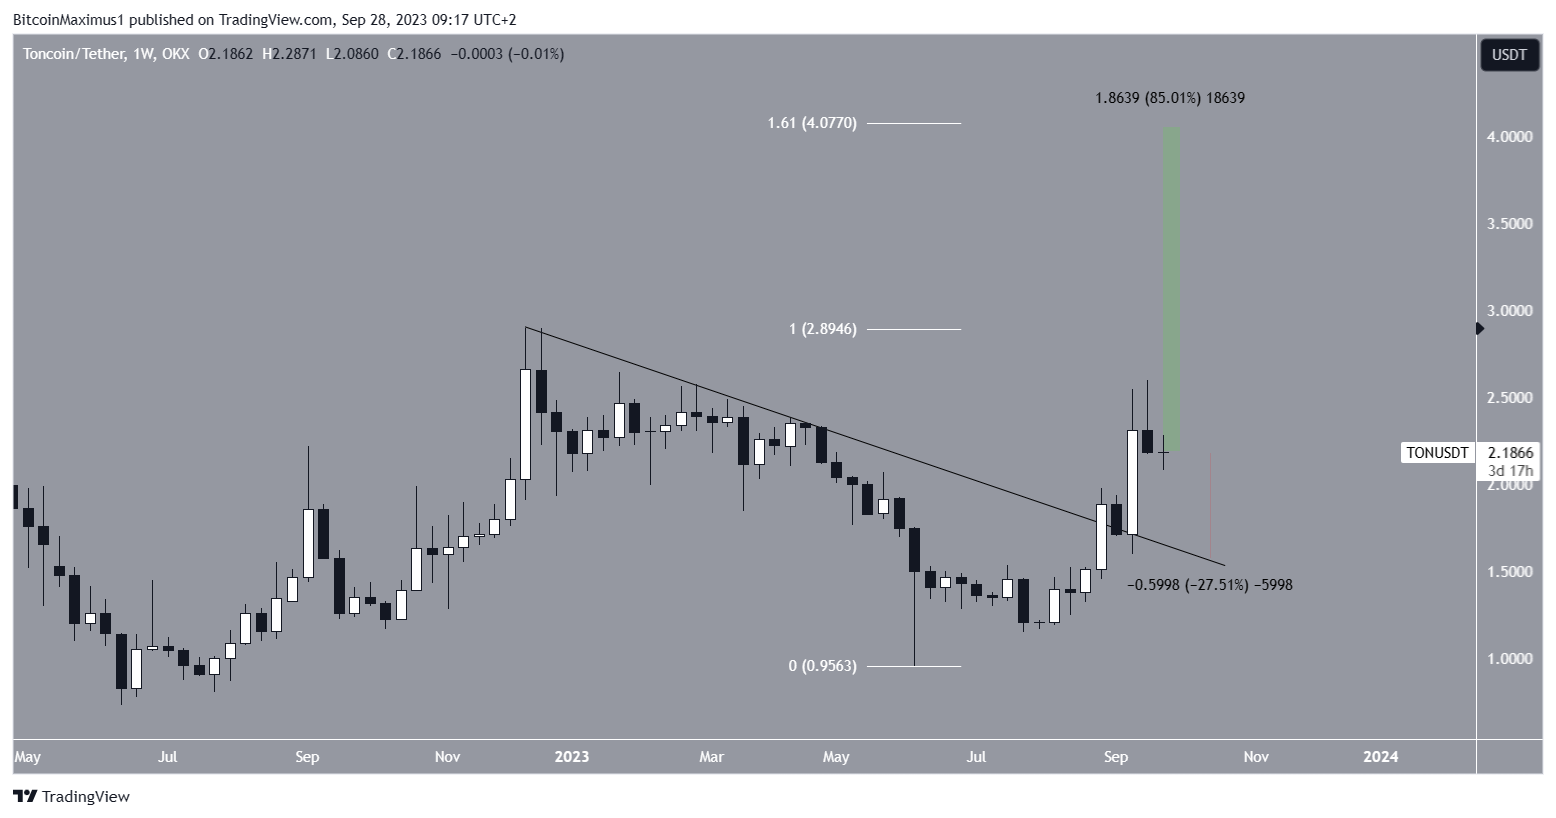
If the rally loses momentum, TON could decrease by 27.50% and reach the descending resistance line at $1.60.
Looking For a New Exchange? These Are the Best Crypto Sign-Up Bonuses in 2023
For BeInCrypto’s latest crypto market analysis, click here


