The recent 33% decline in Ripple’s (XRP) price has raised questions about whether this downward trend will continue or if a correction is nearing its end.
Currently, Ripple is finding significant support, which could play a crucial role in determining its next price movement. If this support level holds, it may provide a foundation for stabilization or a potential rebound.
However, if this support is breached, Ripple’s price could decline further, potentially falling to a lower level.
Ripple’s Price Trending Downward in Correction Since November
In November, XRP experienced a bearish rejection at the golden ratio resistance level, approximately at $0.75. This led to a corrective movement since then.
This month, XRP found support at the 50-month Exponential Moving Average (EMA), around $0.518, where it initially seemed to be rebounding in a bullish manner. However, the Moving Average Convergence Divergence (MACD) histogram has begun to trend downwards in a bearish direction this month, indicating a shift in momentum.
Despite the bearish trend in the MACD histogram, the MACD lines are still in a bullish crossover, and the Relative Strength Index (RSI) remains neutral, not indicating a clear directional trend.
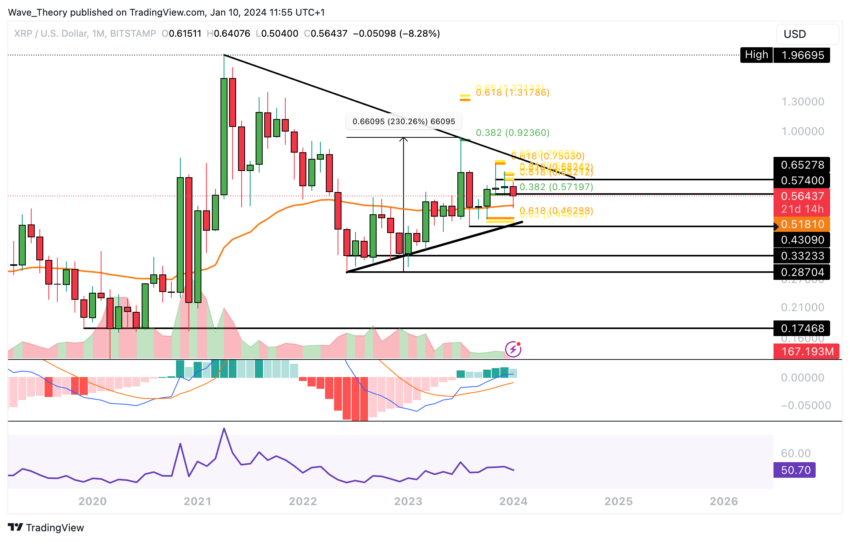
The combination of these factors in the monthly chart – the initial bullish rebound from the 50-month EMA, the bearish turn in the MACD histogram, along with the bullish MACD lines and a neutral RSI – results in a somewhat bearish overall outlook for Ripple in the near term.
This indicates a period of mixed signals and potential volatility for XRP’s price.
Is Ripple’s Price Headed for a Correction to $0.45 Golden Ratio Support?
Ripple’s (XRP) price is at the 50-week Exponential Moving Average (EMA) of around $0.547. Should this support level fail, the next level of support lies at the 200-week EMA, approximately at $0.52.
If XRP breaks through both these EMA supports in a bearish manner, there’s potential for a correction down to the golden ratio support around $0.45. The weekly chart’s MACD lines are already in a bearish crossover. The MACD histogram is also trending downwards, indicating bearish momentum.
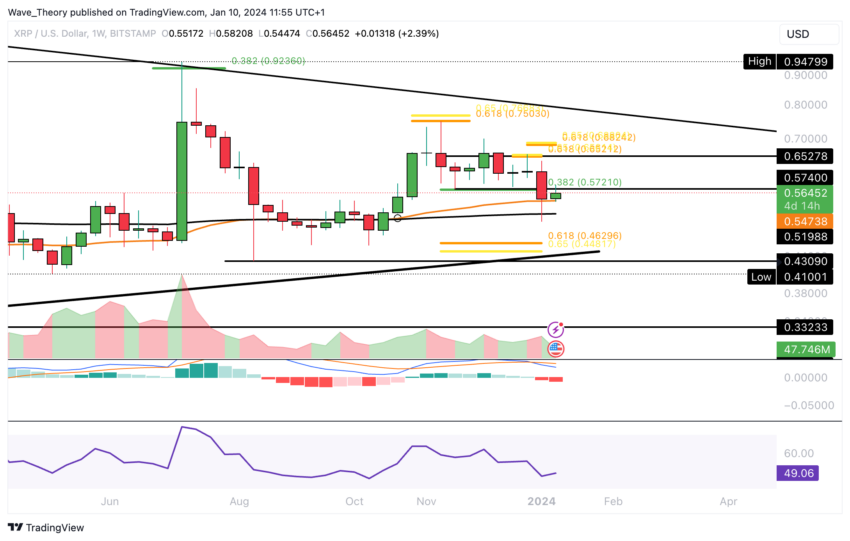
Conversely, the RSI is neutral, not signaling clear bullish or bearish trends. However, a golden crossover in the EMAs suggests that the medium-term trend for Ripple remains bullish. This contrast between the bearish MACD and the bullish golden crossover in the EMAs presents a mixed outlook for XRP’s future price movement.
XRP Daily Chart Analysis: Mixed Indicator Signals Emerge
In the daily chart for XRP, while the initial appearance suggests a continuation of the downward trend, the technical indicators present a mix of signals.
The MACD lines are in a bearish crossover, typically a sign of bearish momentum. Concurrently, the RSI is in neutral territory, indicating a balance in market forces without strong overbought or oversold conditions.
However, countering these bearish indicators, the MACD histogram has started to trend upwards bullishly since the day before yesterday. Additionally, the EMAs exhibit a golden crossover, a bullish signal in the short to medium term. This crossover occurs when a shorter-term EMA crosses above a longer-term EMA, often interpreted as an indicator of upward momentum.
These mixed indicators – a bearish MACD crossover and RSI neutrality contrasted with a bullish MACD histogram and golden EMA crossover – suggest a complex and potentially volatile market scenario for Ripple, with both bearish and bullish forces at play.
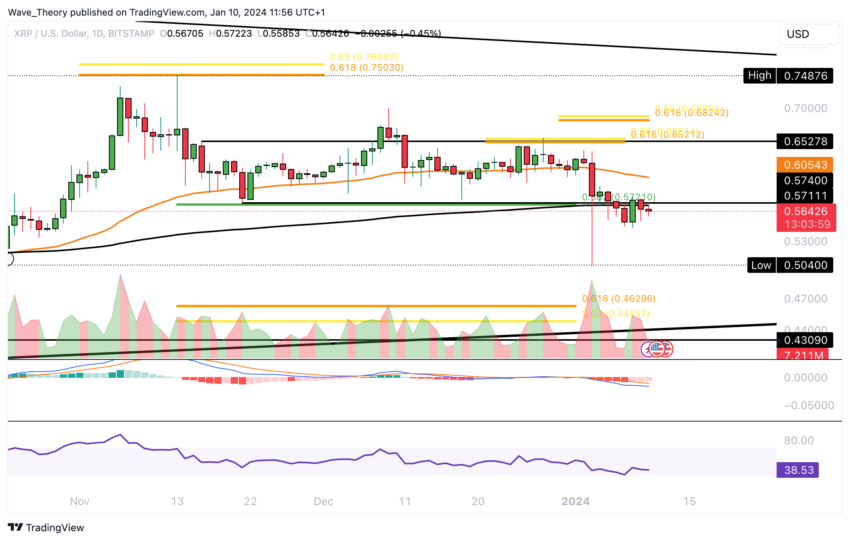
The recent bearish rejection of XRP at the Golden Ratio resistance level, around $0.65, suggests that the downward trend remains intact. This rejection at a key resistance level often indicates continuing the prevailing bearish momentum. Therefore, this reinforces the likelihood of ongoing downward price movement in the short term.
4H Chart Shows Formation of a Death Cross
In Ripple’s 4-hour (4H) chart, a death cross has formed, typically confirming a bearish trend in the short term. This occurs when a shorter-term moving average, like the 50-period EMA, crosses below a longer-term moving average, such as the 200-period EMA.
Additionally, the MACD lines are nearing a bearish crossover, and the MACD histogram is trending downwards, reinforcing the bearish sentiment.
Contrastingly, the RSI remains in neutral territory, not providing strong bearish signals. Despite this, the overall indicators in the 4H chart lean towards a bearish outlook.
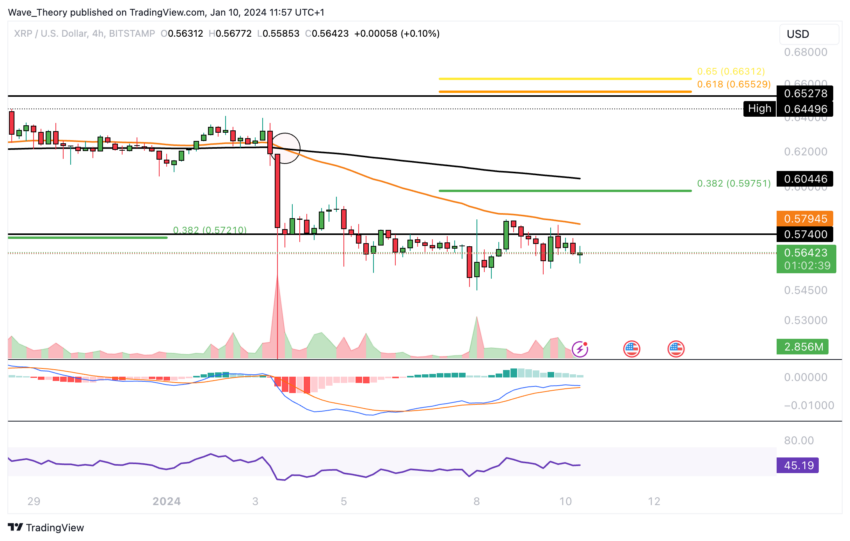
If XRP were to initiate an upward movement, significant Fibonacci resistance levels would be encountered at approximately $0.597 and $0.65.
The current corrective movement would only be considered invalidated if Ripple manages to break through the golden ratio resistance at around $0.65. This suggests a potential shift in the prevailing market trend.
Ripple Price Reaches Horizontal Support Zone Against Bitcoin
In its pairing with Bitcoin (BTC), XRP price has recently experienced a bearish break below the golden ratio support level, approximately at 0.0000155 BTC. This has led to a correction towards a support zone between around 0.0000124 BTC and 0.0000134 BTC.
The bearish sentiment is further supported by the indicators on the monthly chart. The MACD lines have undergone a bearish crossover. While the MACD histogram has been trending downwards for several months, indicating bearish momentum. Meanwhile, the RSI remains neutral, providing no strong directional bias.
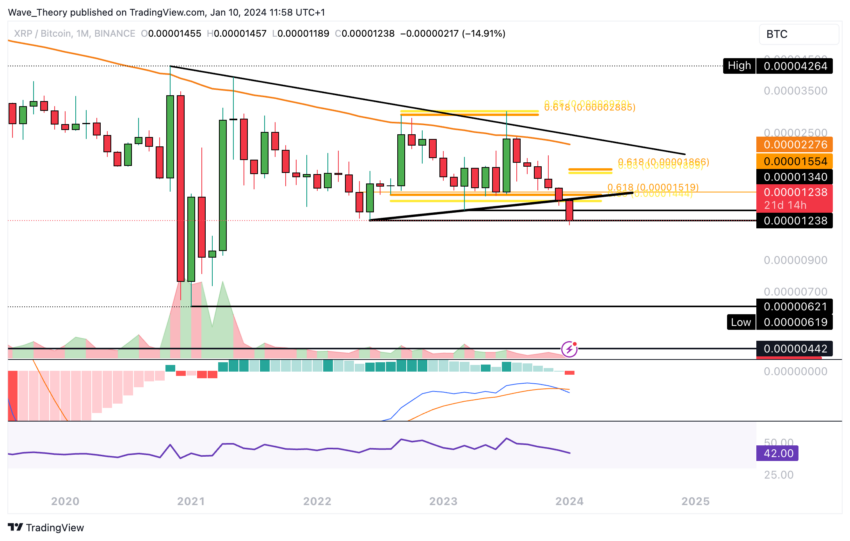
Should XRP break below this current support zone in its BTC pairing, there is a risk of a sharp decline in price. In such a scenario, significant support for Ripple might only be found at a much lower level, around the previous low of 0.0000062 BTC.
This potential for a substantial drop underscores the importance of the current support zone in preventing further declines in XRP’s value against Bitcoin.
Read More: 13 Best Altcoins To Invest In January 2024
Disclaimer
In line with the Trust Project guidelines, this price analysis article is for informational purposes only and should not be considered financial or investment advice. BeInCrypto is committed to accurate, unbiased reporting, but market conditions are subject to change without notice. Always conduct your own research and consult with a professional before making any financial decisions. Please note that our Terms and Conditions, Privacy Policy, and Disclaimers have been updated.

