


If you want to get ahead of trends in the crypto space, try out the ZigZag indicator. While other trend-following crypto trading indicators for technical analysis include the Moving Average Convergence Divergence and the Parabolic SAR, the ZigZag indicator stands out for its simplistic approach in helping you identify swing highs and lows.
This guide explores everything about the ZigZag Indicator, including its ability to spot potential bullish and bearish signals, usefulness across multiple timeframes, and best practices.
What is the ZigZag pattern in crypto?
The ZigZag pattern in crypto identifies and visualizes a clear pivot point that easily determines bullish and bearish trends. Notably, the pattern isn’t out-and-out predictive. Instead, it adjusts depending on changing market conditions. The pattern isolates movements that are essential for trend identification and price action monitoring.
Unpacking the ZigZag indicator
The ZigZag indicator is a technical analysis resource that can clearly identify swing highs and lows using straight lines. This indicator can be paired with the Fibonacci Retracement tool to help locate key support and resistance levels.
Here are the basic features of this indicator:
- Reduction in trading noise by chalking out clear swing highs and lows
- Accurate trend change identification
- The ability to change the settings for defining pivots based on trading timeframe.
- Helps find the key resistance and support lines on the chart, allowing for trend identification.
What is the best ZigZag indicator setting? How to read the insights?
If you have previously used the Bollinger Bands indicator, you will know the importance of indicator settings. Let us look at what that means for the ZigZag and how the settings help in reading the indicator.
The concept of depth, deviation, and backstep
The indicator depth signifies the lowest number of bars between the potential low and the potential high.
As the name suggests, increasing the depth will result in fewer price-specific fluctuations, with the lines expected to move in one direction for longer. When the line reverses, indicating a reversal, the visualization becomes more significant.
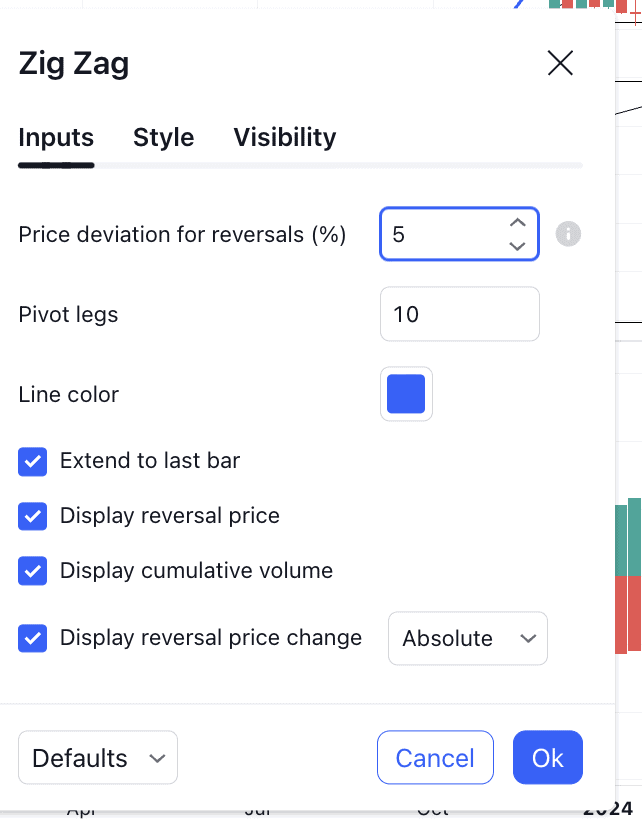
The deviation refers to the percentage of the minimum price move needed for the indicator to change course. If the deviation is set high, smaller price moves are flushed out.
The depth and deviation settings also determine the minimum number of bars formed between the swing lows and highs, which the Backstep count determines.
Calculating the indicator
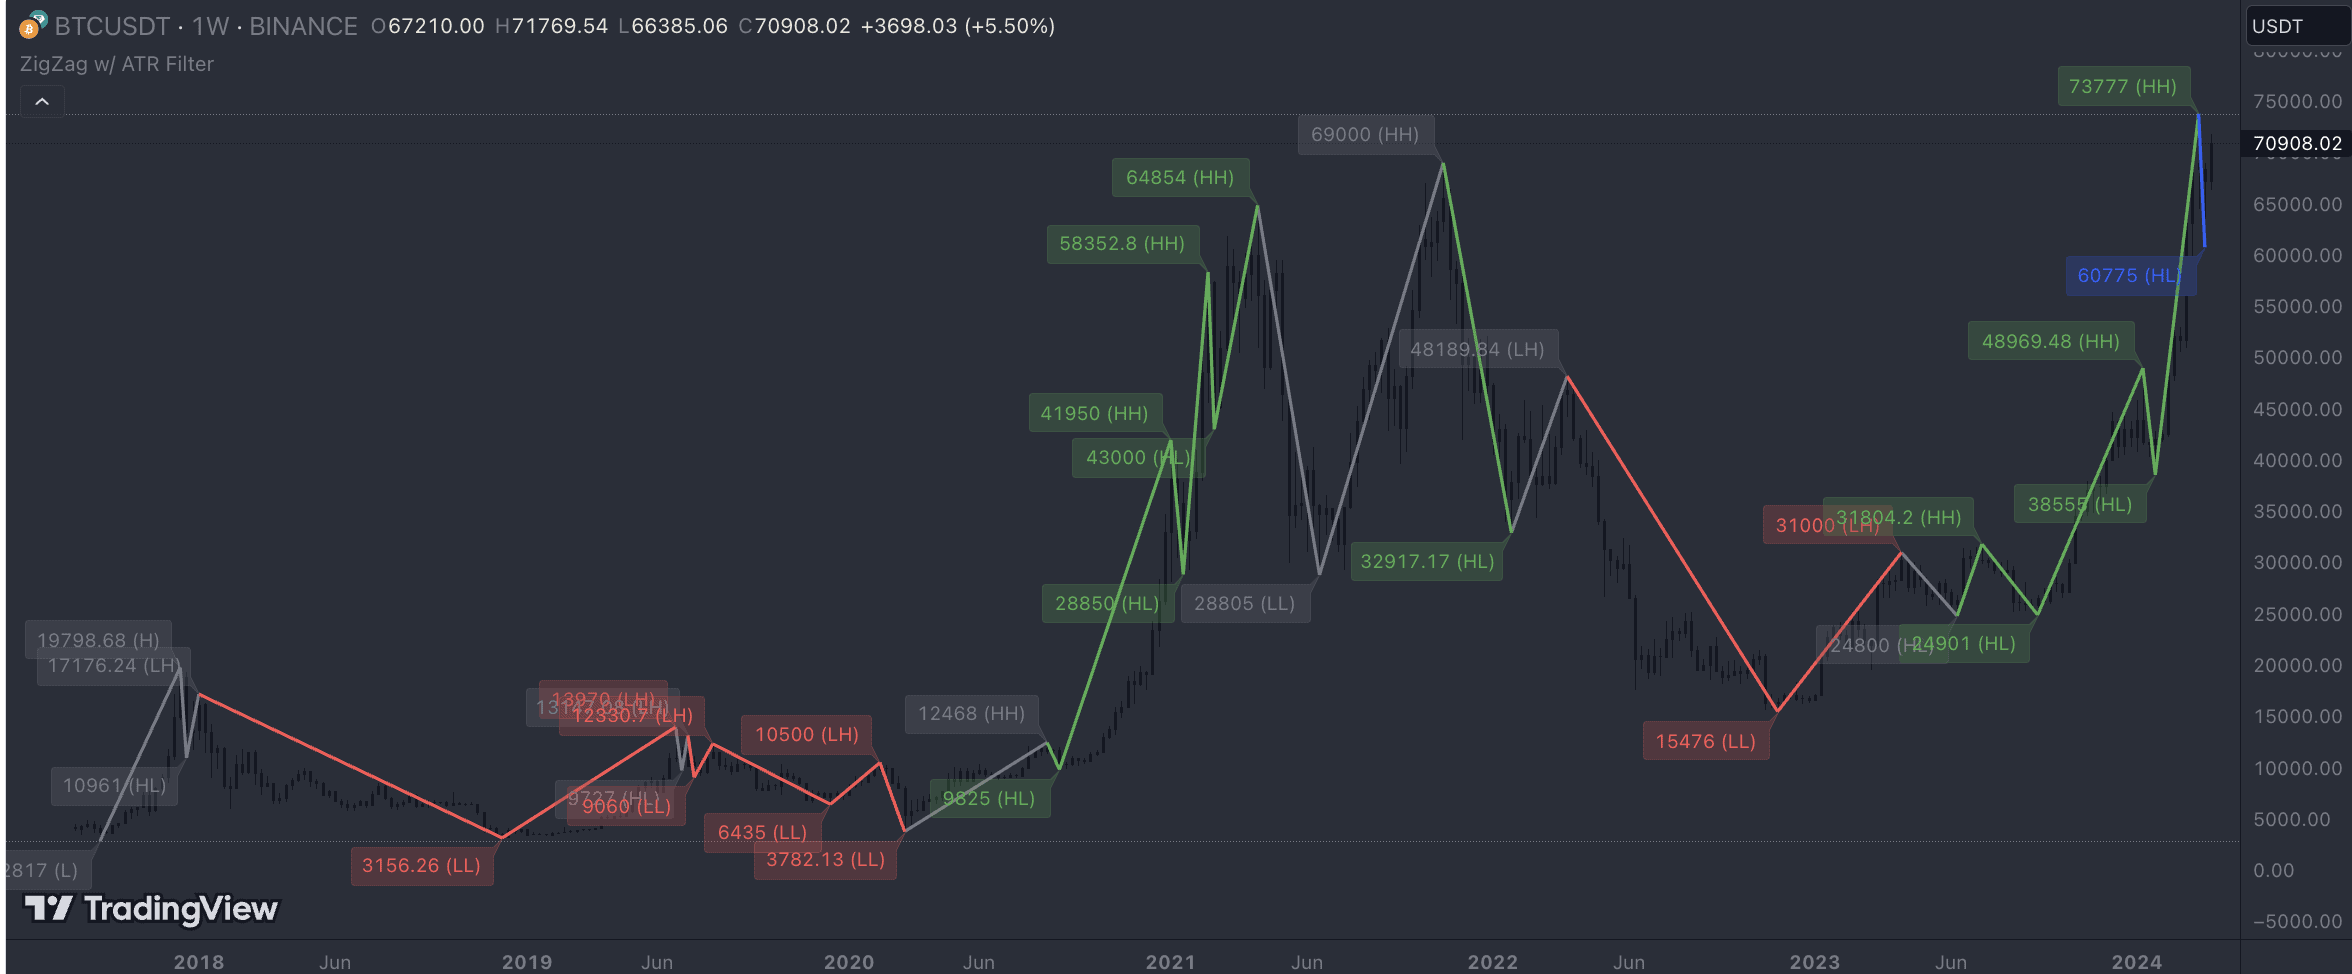
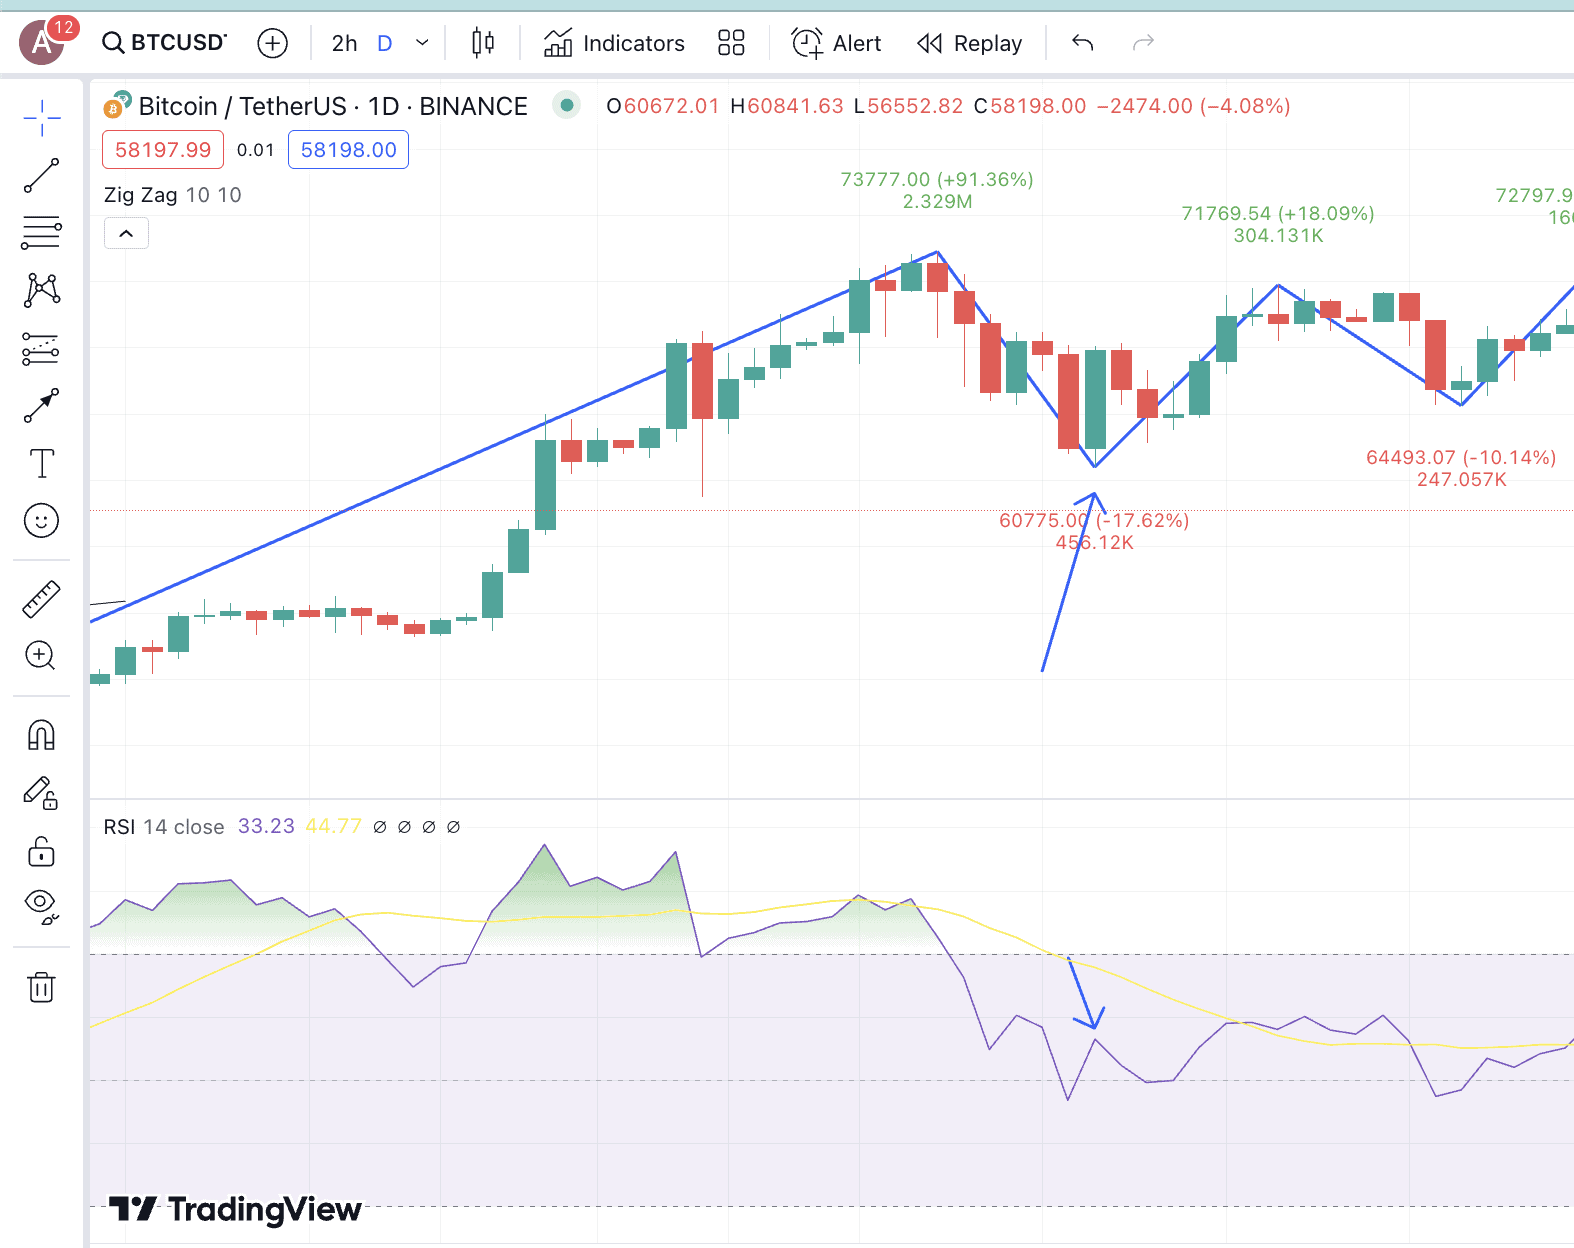
To calculate or plot the ZigZag indicator, you first need to choose a starting point. Say, for the sake of illustration, this is $67232, per the latest Bitcoin price chart (shown above). Now that we have chosen the deviation to be 10%, the next low would never be considered if the Bitcoin price doesn’t fall by 10% of $67,232.
This is why you can see the line from the starting point continuing. Also, it is worth mentioning that the ZigZag is a lagging indicator and only captures the trend. It isn’t predictive in nature. Also, reading this indicator should always be done in tandem with chart patterns, candlestick analysis, Fibonacci retracement levels, and the Elliot Wave formations — all of which we will discuss while exploring trading strategies.
Did you know? Candlestick charting, integral to technical analysis, was developed in 18th-century Japan by rice trader Munehisa Homma, who used it to interpret market emotions and investor sentiment. This technique gained global prominence in the 1980s through the works of Steve Nison.
As for the best ZigZag indicator setting, you can use the following table as your trial-and-error guide, optimized for scalping, day trading, swing trading, and even long-term investing:
| Trading Style | ZigZag Settings | Best Complementary Indicators | Recommended Timeframes |
| Scalp Trading | Deviation: 0.5%-1%, Depth: 5-10, Backstep: 3 | Stochastic Oscillator, RSI | 1-minute to 15-minute |
| Day Trading | Deviation: 2%-5%, Depth: 12-24, Backstep: 3 | MACD, Volume, Moving Averages | 5-minute to 30-minute |
| Swing Trading | Deviation: 5%-10%, Depth: 24-48, Backstep: 5 | RSI, MACD, Fibonacci Retracement Levels | 1-hour to Daily |
| Long-Term Trading | Deviation: 10%-15%, Depth: 60-120, Backstep: 8 | Moving Averages (50-day, 200-day), MACD | Daily to Weekly |
How to trade using the ZigZag indicator
At first glance, the ZigZag indicator doesn’t look like much. It is one of the more basic crypto trading indicators that follows price action. However, how you set the depth and deviation determines how strong the trend identification results are.
Here are some of the crypto trading strategies that you can execute using the ZigZag indicator, along with the price action, histogram analysis, candlestick patterns, and a few other elements.
Strategy 1: Identifying trend reversals
The idea is simple. Once you apply the ZigZag indicator to the price action, you should look for lower highs during an uptrend and higher lows during a downtrend to identify a possible trend reversal.
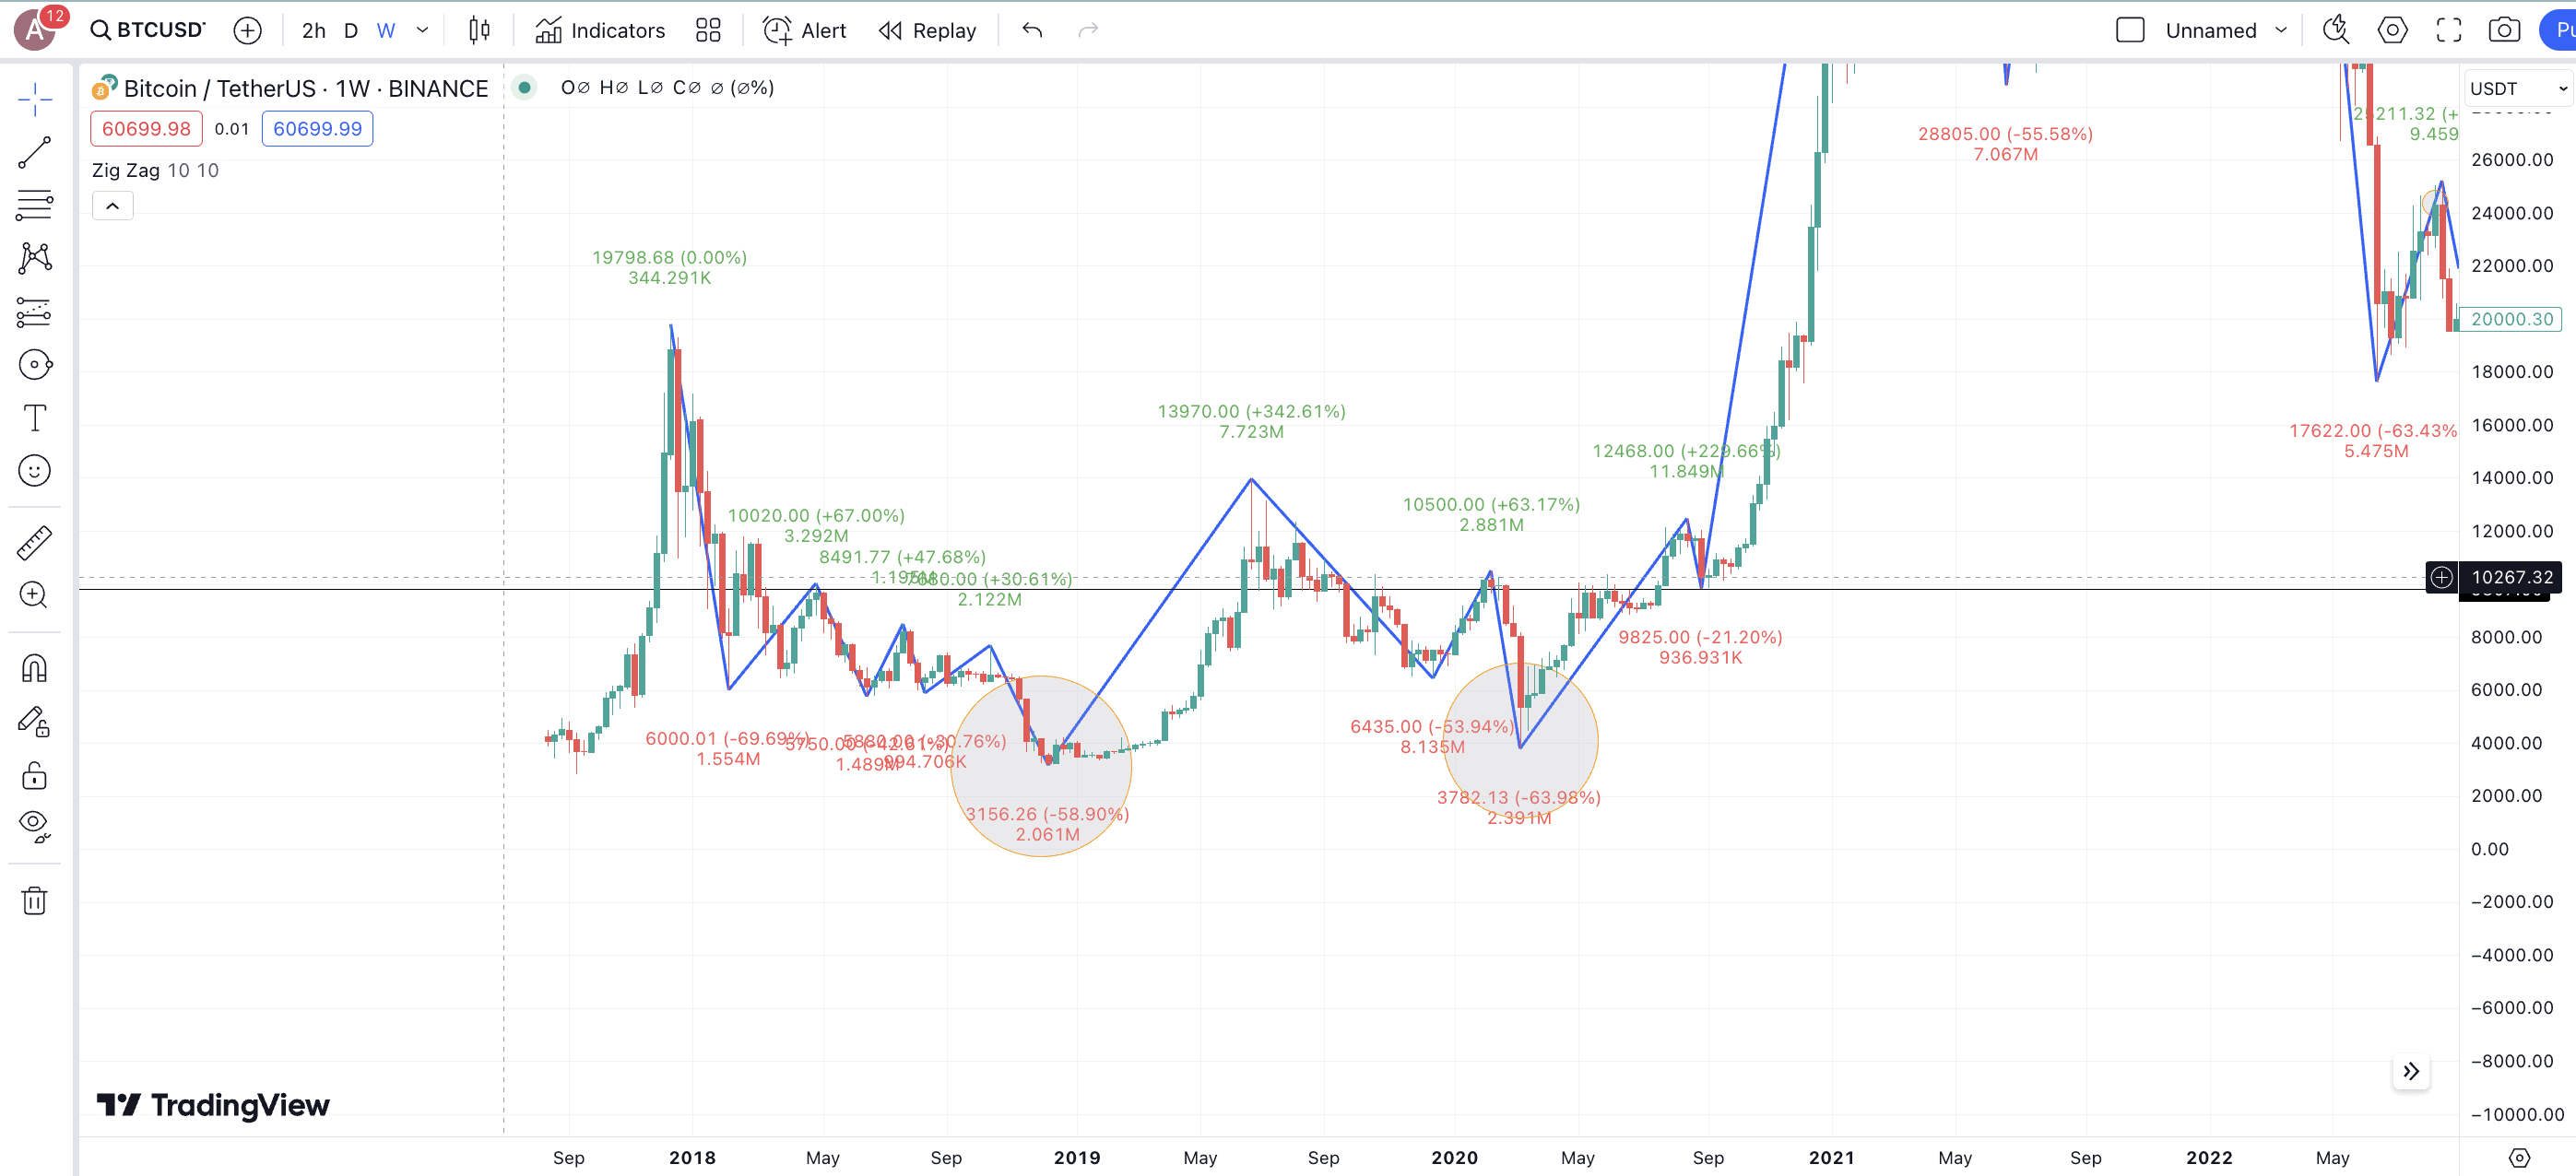
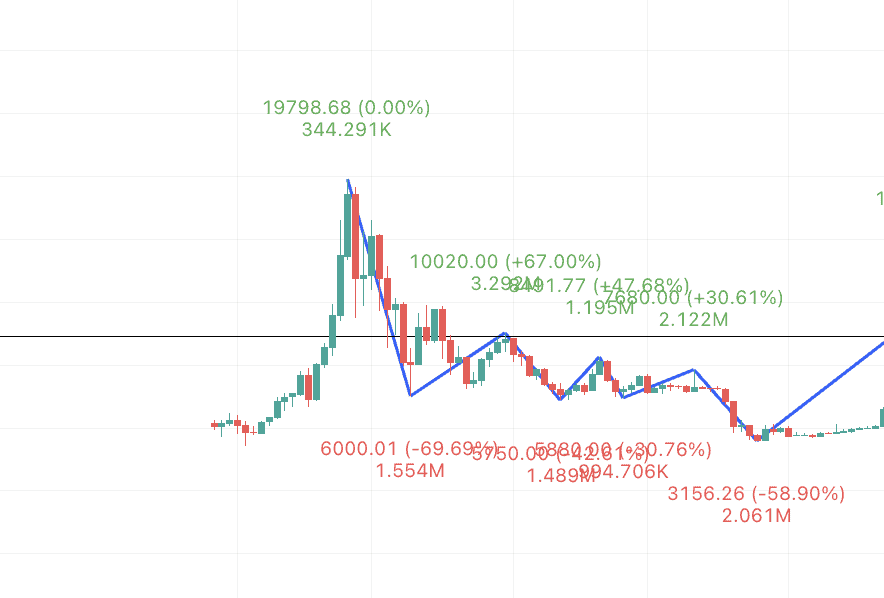
A historical validation of this strategy surfaced in December 2017, when BTC reached a high of almost $20,000. From that, it dipped all the way to $6000, showcasing significant market volatility. The subsequent swing high and the next swing low formed lower. This suggested a weakening trend and by December 2018, the price of Bitcoin dipped to almost $3000.
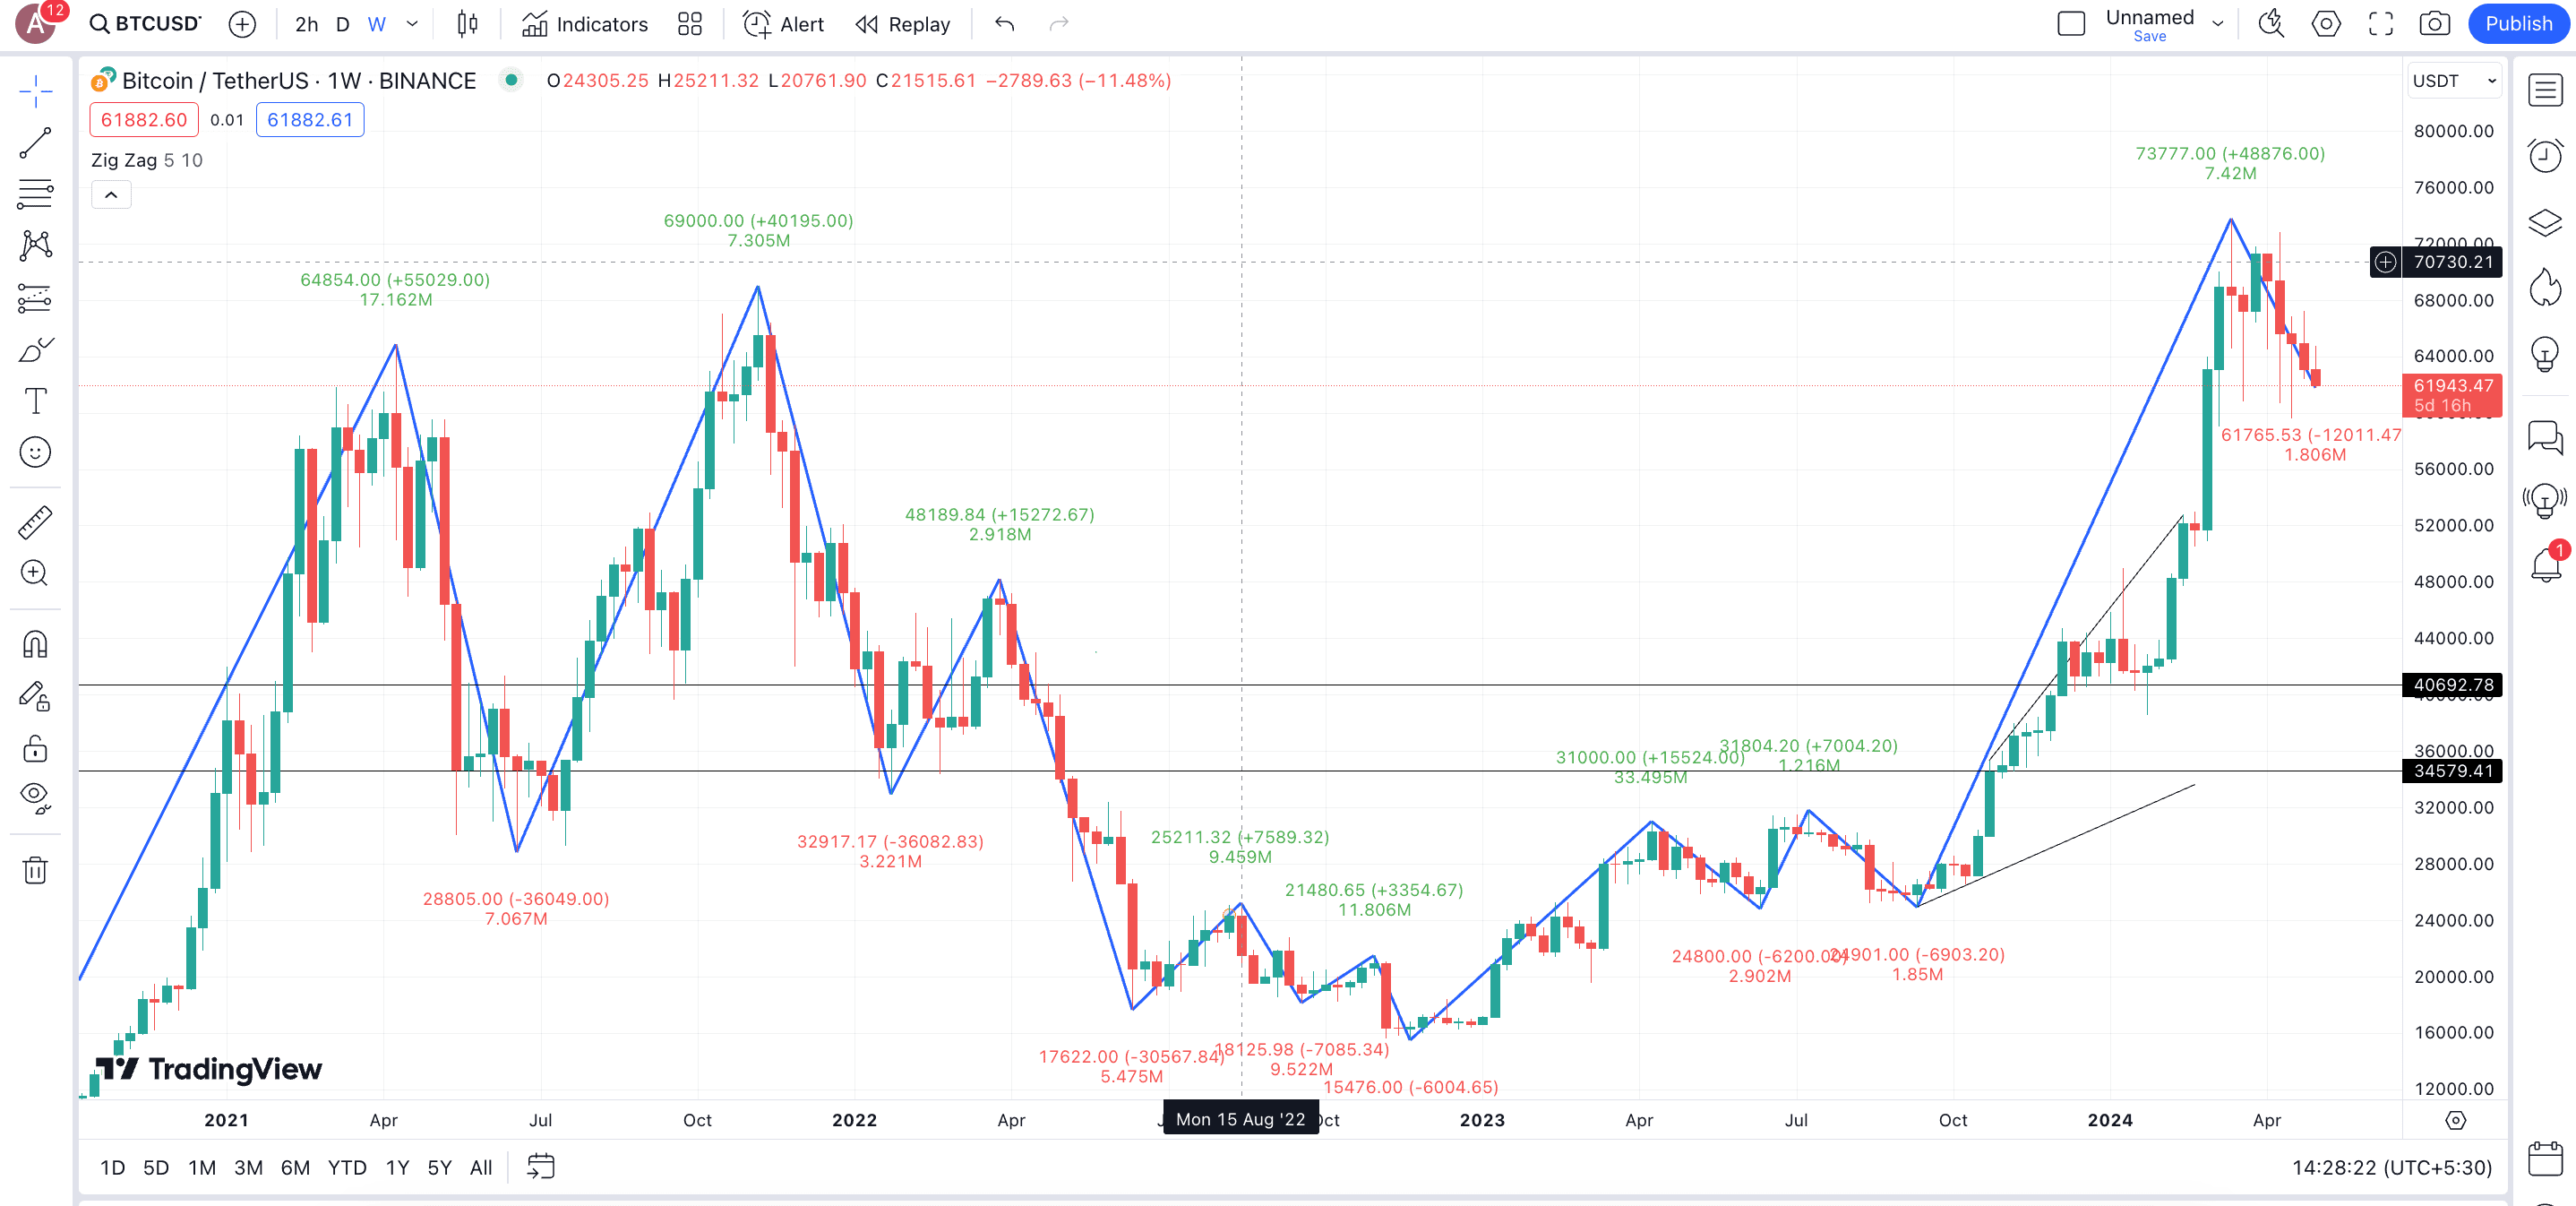
Strategy 2: Using support and resistance lines
The ZigZag indicator helps you locate the historical support and resistance levels. Notice how, in the case of BTC, the low made in December 2018 acted as a significant support level, which was respected during other downturns and corrective phases.
Also, the prices surged in 2019 all the way up to $14,000 once Bitcoin managed to breach past the crucial resistance levels posed by all the lower high formations in 2018.
ZigZag Indicator and resistance lines: TradingView
If you are a trader interested in taking long positions, the ZigZag indicator can help you locate these key levels. Once these key levels are in, you can use them to place stop loss or even take profit orders, per your preferences.
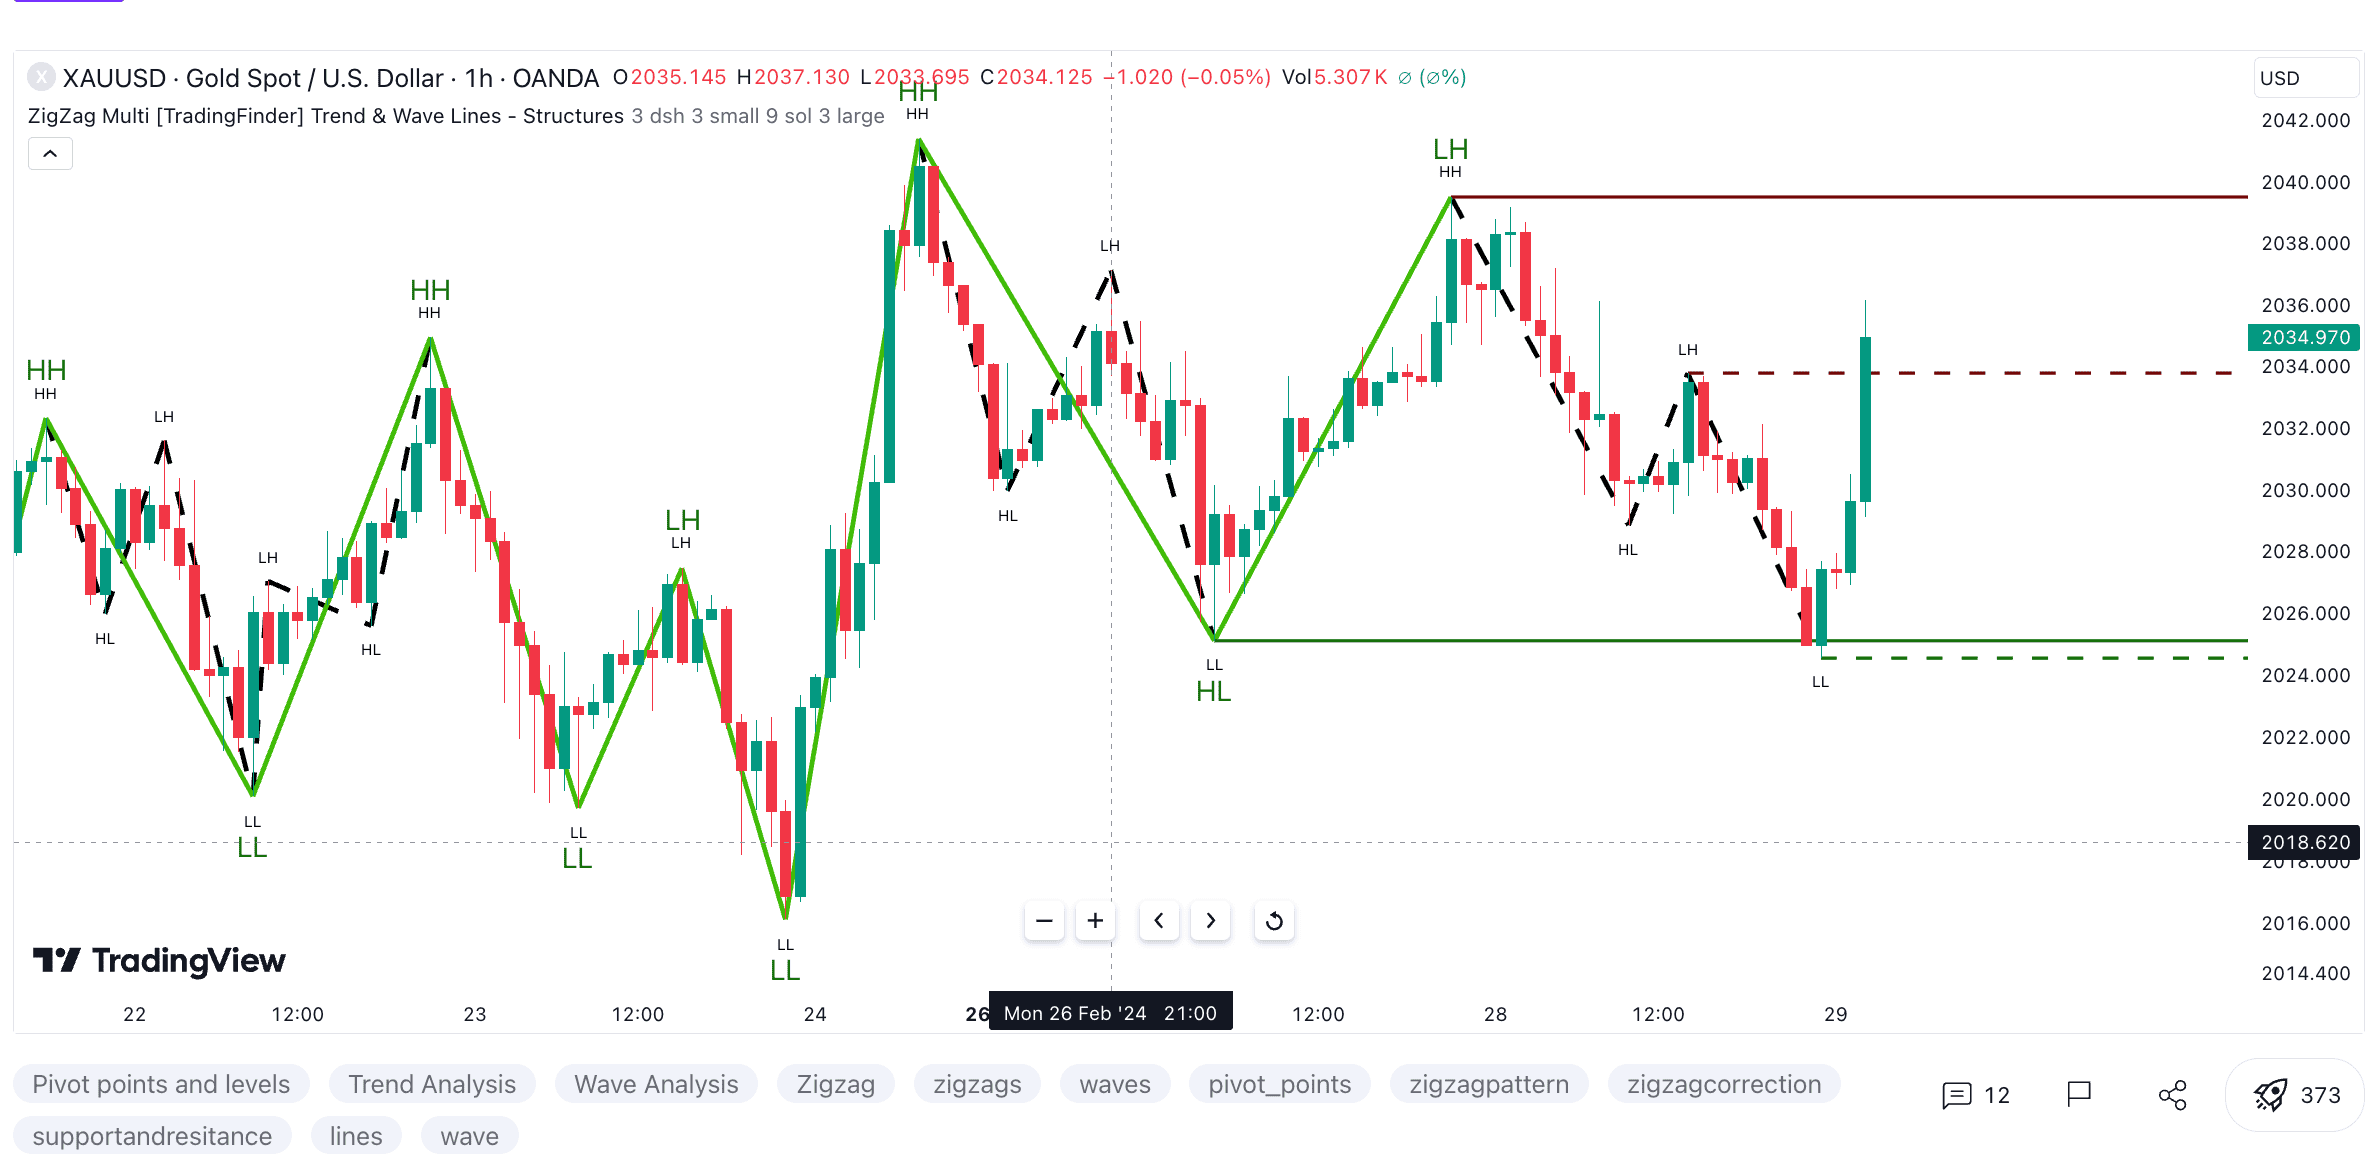
Strategy 3: Using Elliot Waves
The ZigZag Indicator is at the very foundation of the Elliot Wave strategy. If you carefully observe any Elliot Wave pattern, say 1-2-3-4-5, you can see that the waves best align with the ZigZags. Plus, the corrective wave after the 1-5 impulse wave — the A-B-C wave — can also be sourced from the ZigZag indicator as part of the trend identification.
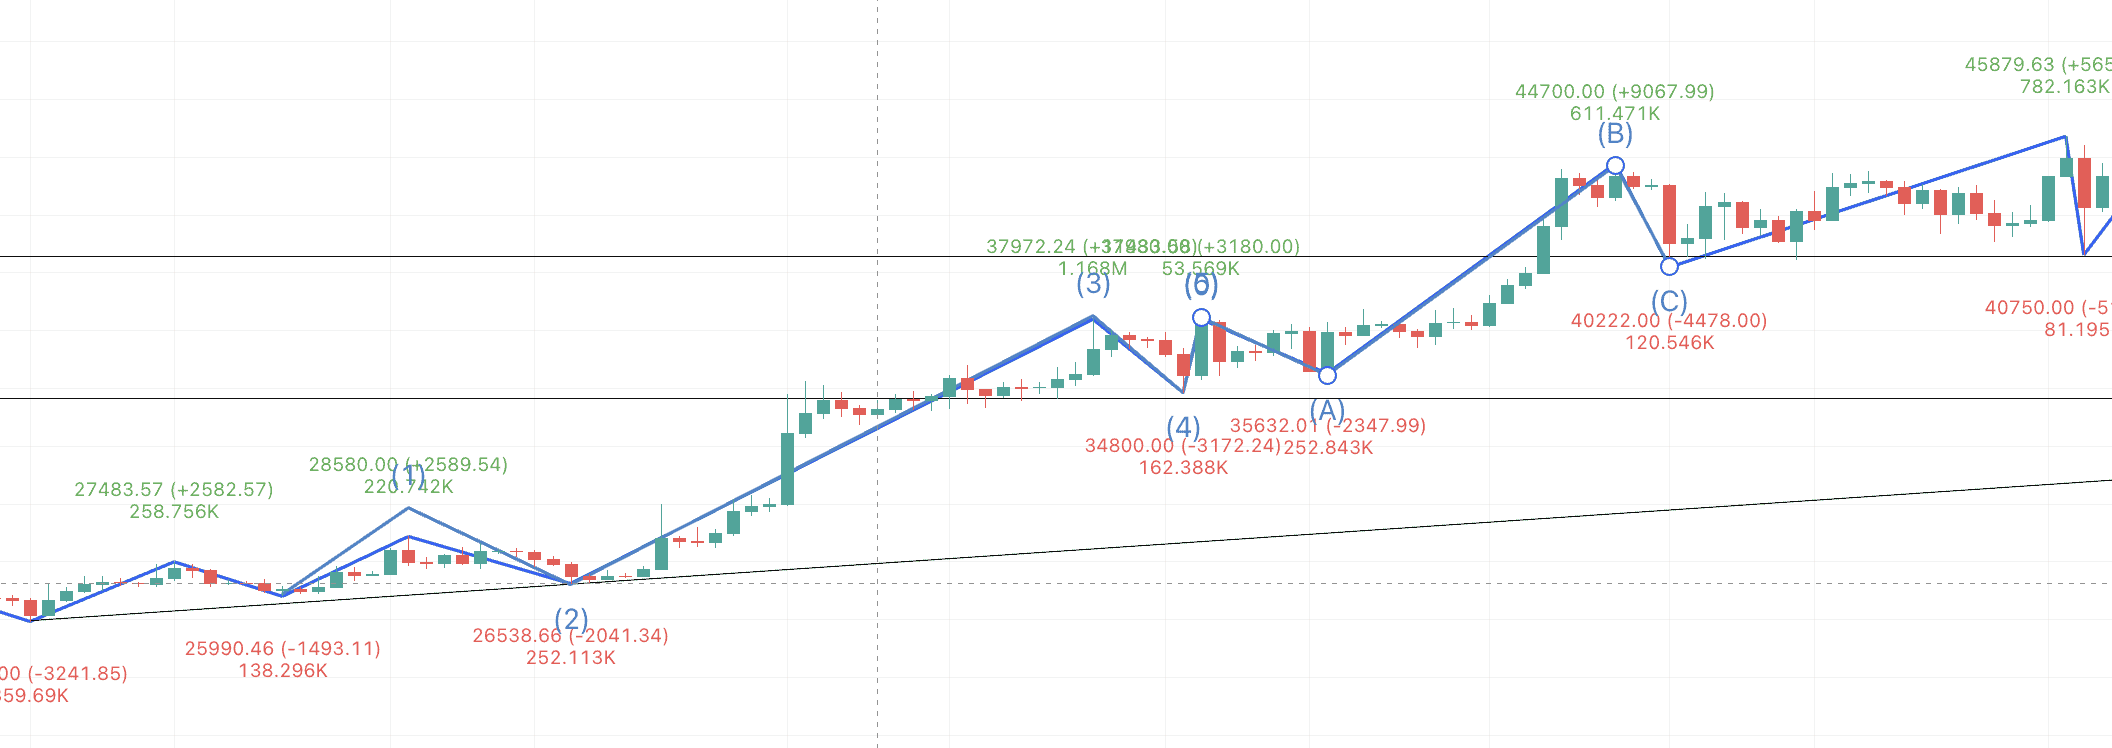
ZigZag Indicator and Elliot Waves: TradingView
Simply put, the ZigZag indicator helps visualize the Elliot Waves better. But then, to use this strategy, you need to understand the conditions/guidelines associated with Elliot Wave formation:
Rules
- Wave 2 cannot retrace more than 100% of Wave 1.
- Wave 3 cannot be the shortest of the three impulse waves (1, 3, 5).
- Wave 4 does not overlap with the price territory of Wave 1, except in diagonal triangles.
Guidelines
- Wave 1: Often difficult to identify its formation because it resembles many other trading setups.
- Wave 2: Typically retraces 50% to 61.8% of Wave 1; should not exceed the start of Wave 1.
- Wave 3: Usually, the longest and most robust wave should not be the shortest.
- Wave 4: Typically retraces 38.2% of Wave 3; more shallow than Wave 2 and often complex or triangular.
- Wave 5: Can be about equal to Wave 1 or extend if in a “fifth wave extension.” Often shows divergence with technical indicators if it is extending.
Corrective wave patterns (A-B-C)
- Wave A: This can be any corrective pattern (zigzag, flat, or triangle).
- Wave B: Tends to be shallow and can consist of any corrective pattern; typically retraces a small percentage (usually less than 50%) of Wave A.
- Wave C: Moves in the same direction as Wave A. Typically, it is at least as long as Wave A and often extends into a five-wave move.
Common Fibonacci ratios in Elliott waves
- Wave 2: Commonly retraces 50% to 61.8% of Wave 1.
- Wave 3: Often extends to 161.8% of Wave 1.
- Wave 4: Typically retraces 38.2% of Wave 3.
- Wave 5 Often reaches a distance equal to 61.8% of the length from Wave 0 to Wave 3, or 100% of Wave 1.
Do note that these rules and guidelines aren’t set in stone. Under actual market conditions, there is room for some variation. With the Elliot Wave theory in place, you can even use volume analysis to place buy orders.
Strategy 4: Using Fibonacci retracement
You can combine the ZigZag swings with Fibonacci levels to locate additional support and resistance levels. The usage is simple — you need first to locate a swing high and then the swing low. Once done, you can connect the levels using the Fib indicator, giving you the possible support levels. Traders can use these support levels to look for breaches, rebounds, and ideal buying levels.
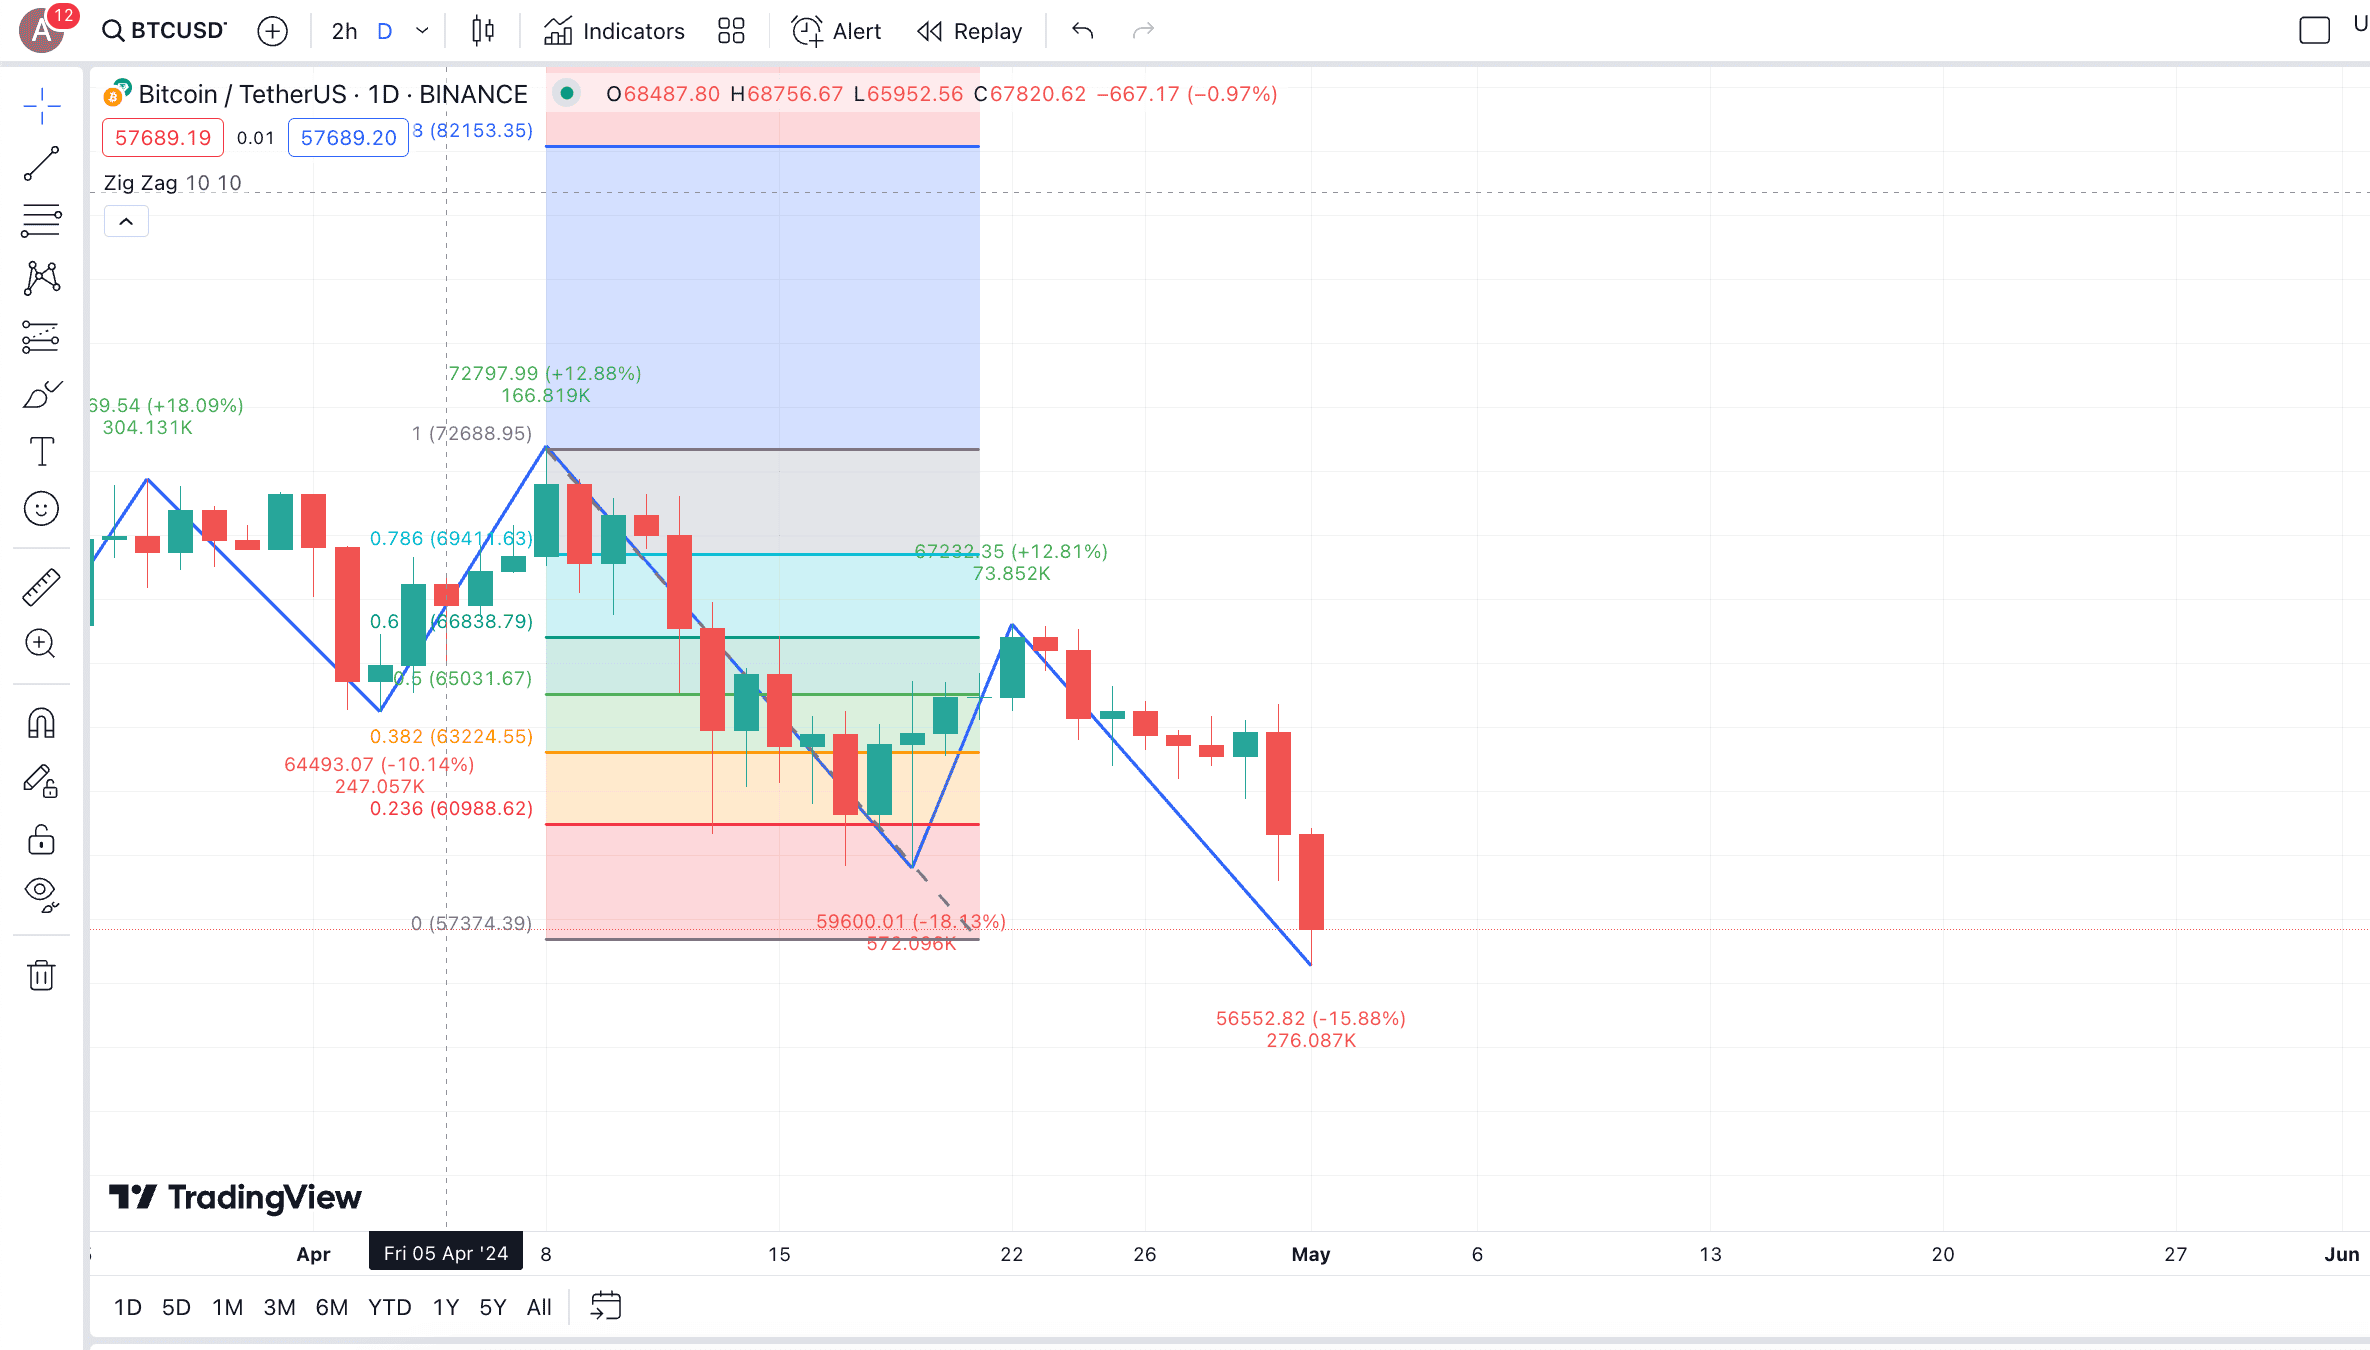
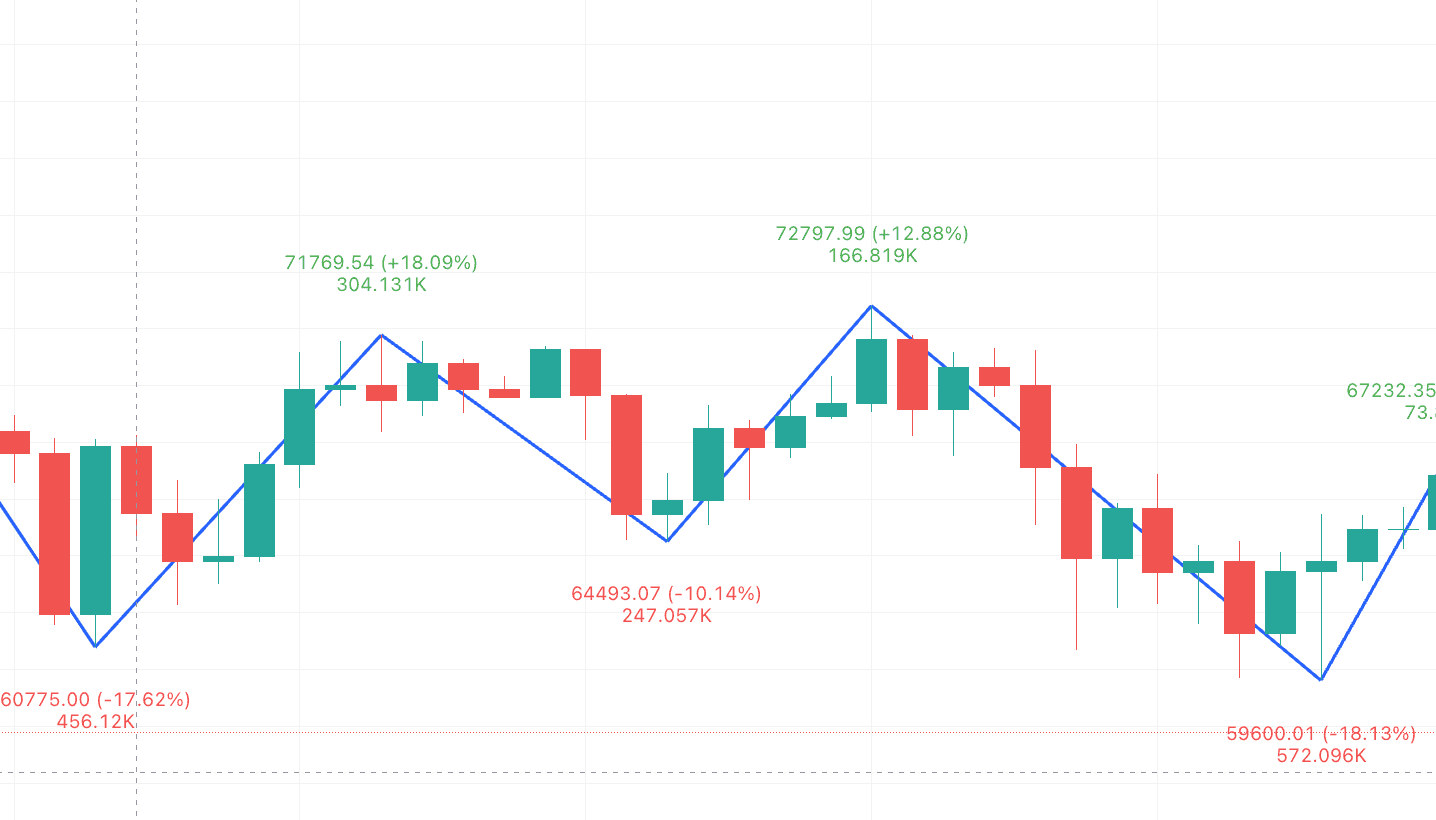
Above is a BTC chart featuring the Fib retracement indicator connecting the swing high of $72,797 and the swing low of $59,600. Notice how the Fib indicator revealed a support level of $66838 at 61.8% of the indicator. A breach past this level, followed by a rebound and another breach, would have confirmed a positive move for Bitcoin.
Instead, the price action couldn’t cross, nullifying any possible buying opportunity.
Strategy 5: Using chart patterns
ZigZag indicators are primarily straight lines. Therefore, you can use them to identify classical chart patterns like double tops, head and shoulders, triangles, and more. Below is a quick chart showing the double top formation at closer to $72,000 both times. This showed BTC bulls lacked strength, leading to a sizable price correction.
Strategy 6: Divergence trading
ZigZag indicators can be used to work with momentum indicators and oscillators to help locate trading divergence. If you see that the bottom of the indicator, or the swing low of the ZigZag, coincides with an RSI peak, you might expect the prices to surge and vice versa.
The same holds even when you are using the likes of the Gator Oscillator. Here are the key signals you need to look for while using the ZigZag indicator with the TradingView Gator Oscillator.
- Buy signal: A significant low identified by the ZigZag, coinciding with both histograms of the Gator Oscillator turning positive, can indicate a strong bullish trend beginning. A quick example shows that BTC in May 2024 might have formed a low, and the tide might turn in favor of bulls, starting soon.
- Sell signal: A significant high identified by the ZigZag and both histograms of the Gator Oscillator turning negative may suggest a strong bearish trend starting.
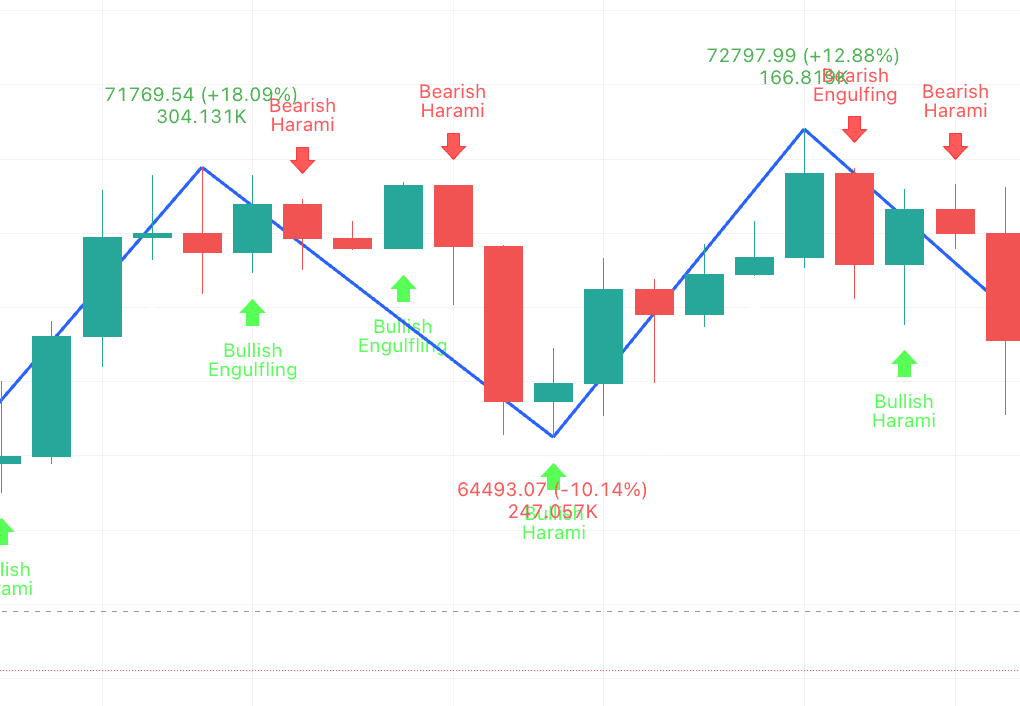
In addition to the mentioned strategies, you can look for key candlestick formations at the swing highs and swing lows to track potential reversals. Above is a quick example of it showing a “Bullish Harami” candlestick formation coinciding with the swing low for BTC at almost $65,000. The price moved to almost $73,000 within a few trading sessions.
Note that besides these trading indicators, you must also rely on project fundamentals.
“Fundamentals I’m talking about are quant measures of demand/supply. Anything that’s not TA on a price chart.
These can be short timeframes.
Includes
– order book auction
– futures demand via funding
– flows into exchanges
– open interest
– on-chain liquidity shifts”
Willy Woo, Bitcoin analyst and co-founder of CMCC Crest: X
Is the ZigZag indicator accurate?
The ZigZag indicator is one of the more reliable crypto trading indicators around. It fixes minor price fluctuations to accurately represent swing highs and lows, making it a powerful tool against the crypto market volatility. Furthermore, it works with most trading oscillators and chart analysis tools across multiple timeframes, making it one of the more flexible crypto trading resources. Overall, ZigZag is relatively accurate and offers bankable signals, making it a useful tool for traders operating in decentralized asset markets.


