Is it a good time to invest in SPELL? How solid are the token’s fundamentals? And do the on-chain metrics and social sentiments indicate anything positive? This SPELL price prediction piece will bring you up to speed with everything you need to know about the token. But first, some background.
Ever heard of Abracadabra Money? The cross-chain lending project (protocol) focuses on stablecoins. Abracadabra lets users stake tokens (capital) they receive from other staking pools to mint MIM or Magic Internet Money. In return, stakers receive Spell Tokens. While it sounds simple, much more goes into the process than meets the eye. So how does Abracadabra Money impact the price of SPELL, and does it make SPELL a valuable long-term investment prospect?
- SPELL price prediction using fundamental analysis
- SPELL trading markets: will they impact price predictions?
- SPELL price prediction based on volatility
- SPELL tokenomics: can this impact SPELL price prediction?
- SPELL price prediction using on-chain metrics
- SPELL social activity: can this impact price prediction levels?
- SPELL price prediction using technical analysis
- Spell Token (SPELL) price prediction 2024
- SPELL price prediction 2025
- SPELL price prediction 2030
- SPELL long-term price prediction until the year 2035
- Is the SPELL price prediction accurate?
- Frequently asked questions
Want to get SPELL price prediction weekly? Join BeInCrypto Trading Community on Telegram: read SPELL price prediction and technical analysis on the coin, ask and get answers to all your questions from PRO traders! Join now
SPELL price prediction using fundamental analysis
Nothing is more important than understanding the fundamentals of a project. For SPELL, the stakes are even higher, as it is the governance token of Abracadabra. So, its future is dependent on the lending protocol’s health and success.
Here are some insights regarding Abracadabra and its Spell Token:
- As per the roadmap, Abracadabra Money went live on the Ethereum mainnet but now has support across multiple chains via bridging.
- Users can bridge the protocol to Avalanche and Fantom chains.
- Layer-2 exposure extends to Arbitrum.
- Offers isolated lending experience. If one asset or pair loses its liquidity, the same doesn’t impact other pools.
- Allows users to put their interest-bearing tokens as collateral for getting the Magic Internet Money or MIM.
- MIM is a USD-backed stablecoin and can be used as crypto funds for trading.
- Users can even farm SPELL by locking the interest-bearing tokens into specific liquidity pools.
- You can stake SPELL and get SPELL in return, which gives stakers voting rights.
- Respected DeFi stalwart Daniele Sestagalli is the brain behind Abracadabra and the Spell token. Daniele Sestagalli is known to work with DeFi godfather Andre Cronje.
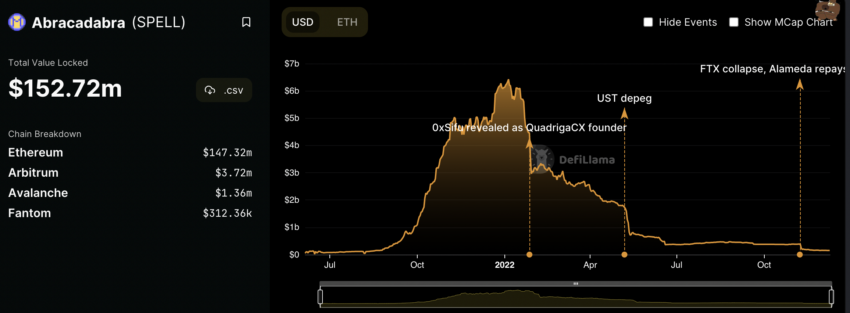
- Despite the fall in TVL post-FTX crash, Abracadabra ranks 49 on the list of DeFi protocols as of December 2022.
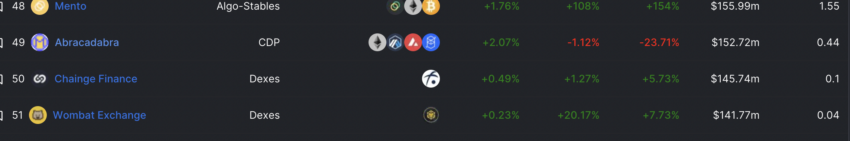
As of 2024, Abracadabra has dropped to 110 in the DeFi TVL ranking. However, the DeFi TVL has been steady at $157 million.
If Abracadabra Money grows, SPELL will remain relevant. It is helpful to keep the protocol’s lending pockets deep; hence, price growth can add to the Abracadabra markets’ liquidity.
Red flags
As a relatively new protocol, Abracadabra Money and its native stablecoin MIM aren’t immune to the broader market exposure. Here are the recent developments that deserve our attention:
- Abracadabra reached out to the Sushi community to activate an emergency vote for freeing two important collateral positions in the wake of the FTX collapse.
- On Nov. 8, 2022, the MIM stablecoin lost its peg briefly owing to its FTT-specific backing.
- Current TVL positioning, according to DeFilLama, doesn’t look great. Also, it still has most funds locked into Ethereum.
We don’t know how deep the FTX rot is. Nor do we know how long it will impact DeFi markets with heavy FTT exposure. For now, we will wait and watch Abracadabra and SPELL.
SPELL trading markets: will they impact price predictions?
Despite being a governance token, SPELL has a decent spot trading spread regarding its market presence as of 2022. The SPELL-USDT pair has a decent trading volume with high confidence and a decent liquidity score. Binance shows a SPELL-BUSD liquidity score of over 900, a positive marker for investors seeking minimal price deflections and minimum volatility.
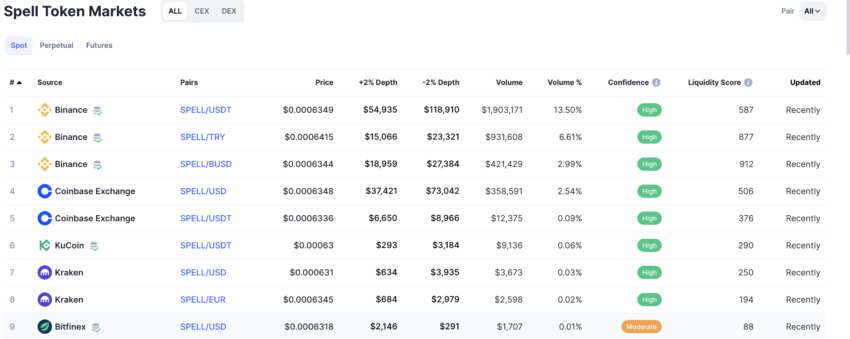
Surprisingly, SPELL has solid perpetual markets. Both buyers and sellers are placing bets on the longevity of the token, which is a good confidence indicator.
In 2024, February to be exact, SPELL continues to trade on popular exchanges like Binance, Coinbase, and more, showing that people are still interested.
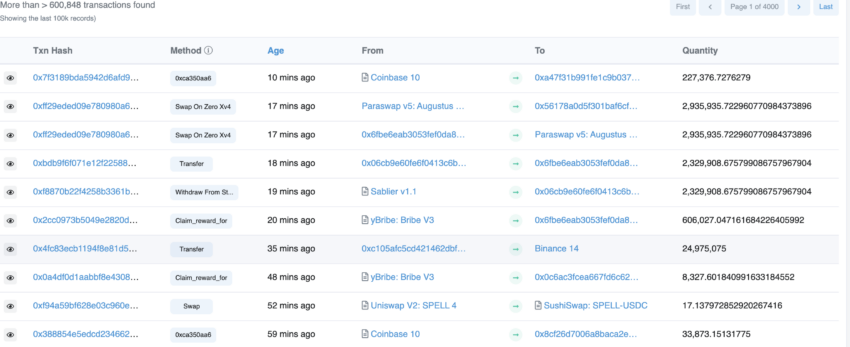
Data from Etherscan shows that SPELL transactions from one wallet to another are frequent. Here are the top transactions and their details as of Dec. 9, 2022.
Also, a decent exchange spread gives solidarity to the price predictions.
SPELL price prediction based on volatility
The ratio of the trading volume and market cap at any given time is the turnover ratio. The higher it is, the less volatile the crypto is. So, let’s check out how SPELL is doing in that regard as of December 2022.
First, let’s note the point where the market cap was highest:
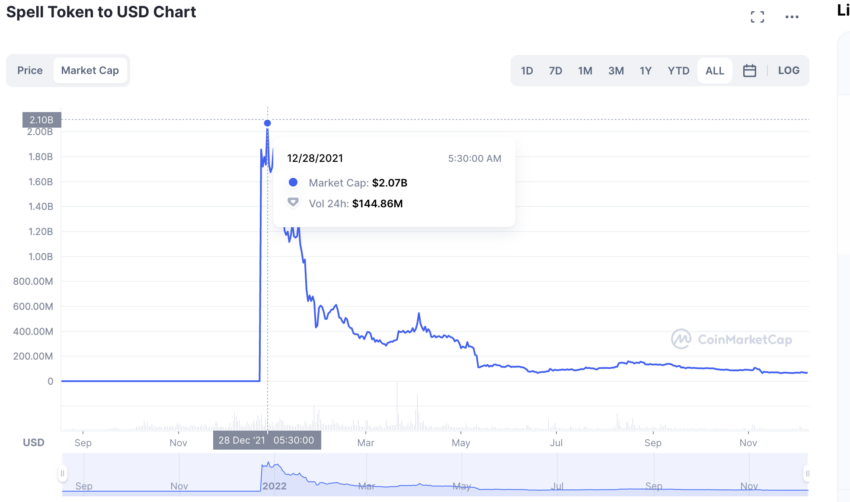
On Dec. 28, 2021, SPELL’s market cap was $2.07 billion, and the trading volumes were as high as $144.86 million. The turn-over ratio, in that case, was 0.069. This was a recipe for a price drop, and it did drop after Dec. 28, 2021.
As of now, on Dec. 9, 2022, the market cap is $68.18 million, and the trading volume is $14.05m. The turn-over ratio comes out to be 0.20.
Hence, SPELL was much less volatile in 2022, which might not be good for short-term price surges.
SPELL tokenomics: can this impact SPELL price prediction?
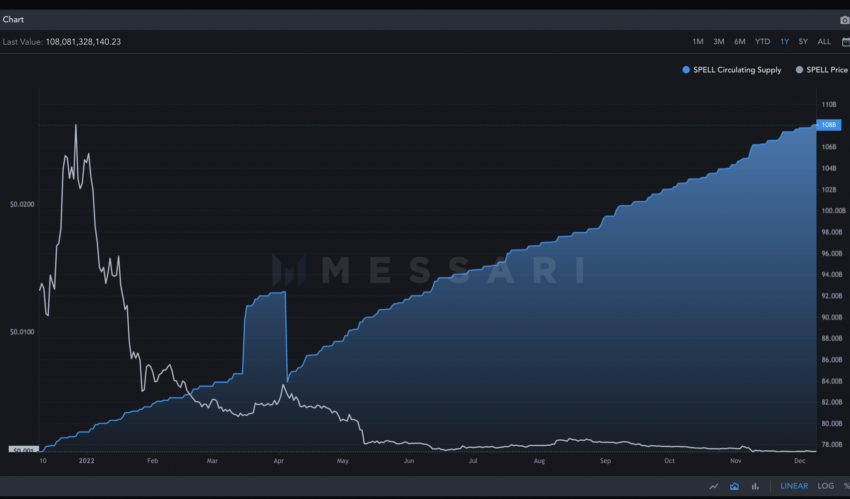
SPELL has a fixed supply of 196+ billion, with 107 billion SPELL tokens in circulation. With Abracadabra growing and users willing to farm their tokens to get SPELL, the circulation might soon increase.
Regarding token distribution, 63% of the supply is meant for liquidity farming incentives and 7% for retail investors during the IDO. 30% of Spell tokens are for the team and founding members.
However, the lack of scarcity might seem to be a problem. Prices have continued to drop with the increase in circulating supply. This could be due to team members offloading SPELL. We can visit the on-chain metrics to get an exact view.
SPELL price prediction using on-chain metrics
If we look at the Exchange Inflow vs. Exchange inflow data from 2022, SPELL seems to be in balance. However, if we see a 1-day interval from June 9, 2022, to Nov. 9, 2022, the Exchange outflow seems to be a tad more than the inflow.
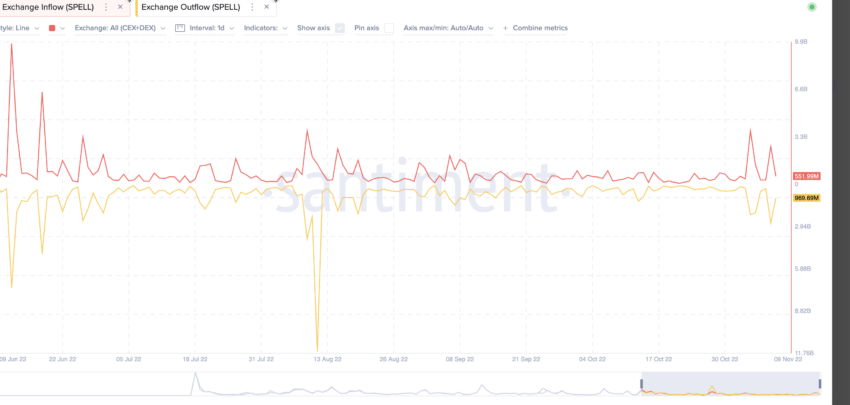
This looks positive for SPELL, and people aren’t aggressively pushing their tokens to exchanges for selling. However, low SPELL prices can also be another reason that outflow and inflow rates balance.
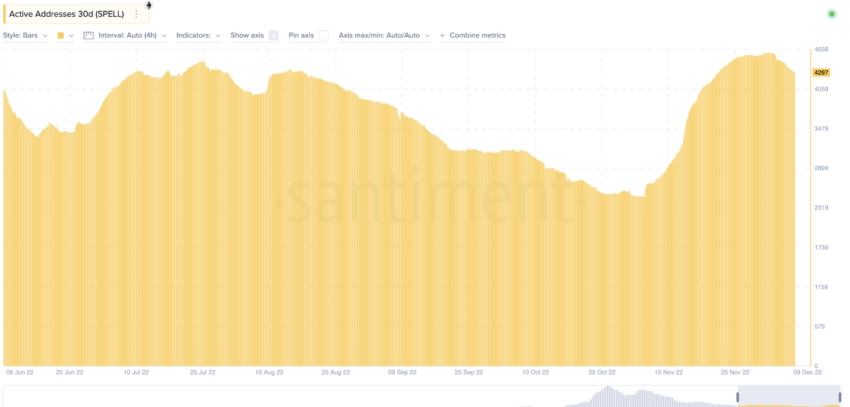
There has been a surge in active addresses over the past 30 days, showing a trend of SPELL accumulation.
Finally, the increase in developer activity shows Abracadabra is working hard to improve the product. Over the past three months, the activity has surged, more so post the FTX collapse.
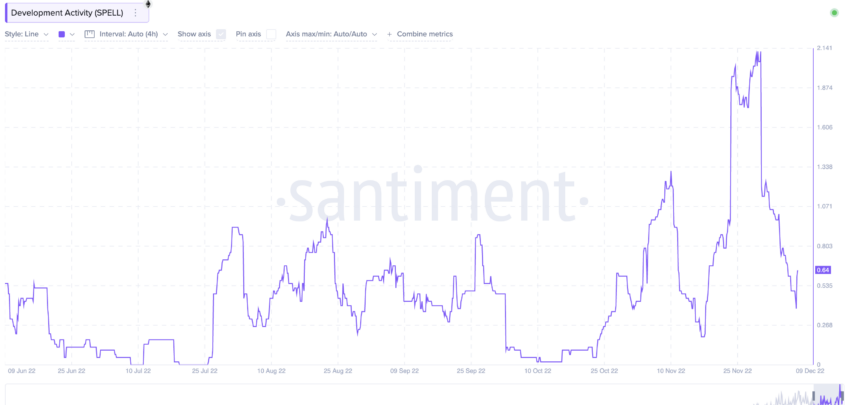
If Abracadabra continues to develop and grow, this might be good for SPELL’s future price.
SPELL social activity: can this impact price prediction levels?
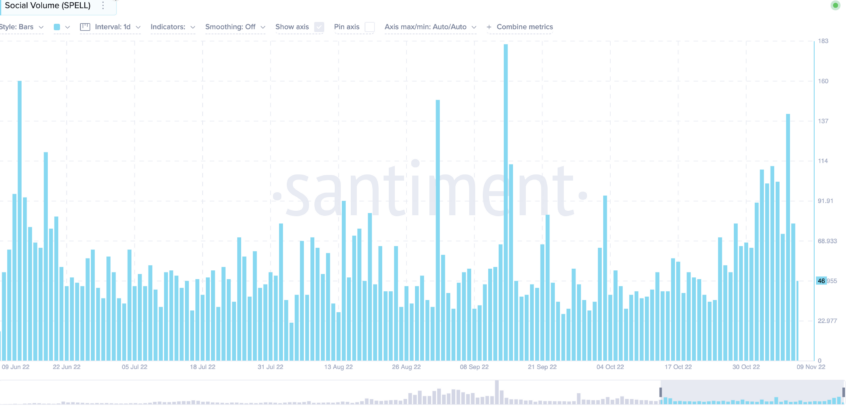
SPELL token’s social volume has been steady from June to November 2022, albeit with a few spikes in early September and early November. This can impact the near-term SPELL price prediction values.
The Twitter following has dropped over the past three months, per data from 2022. This is likely due to the lack of activity or tradable announcements.
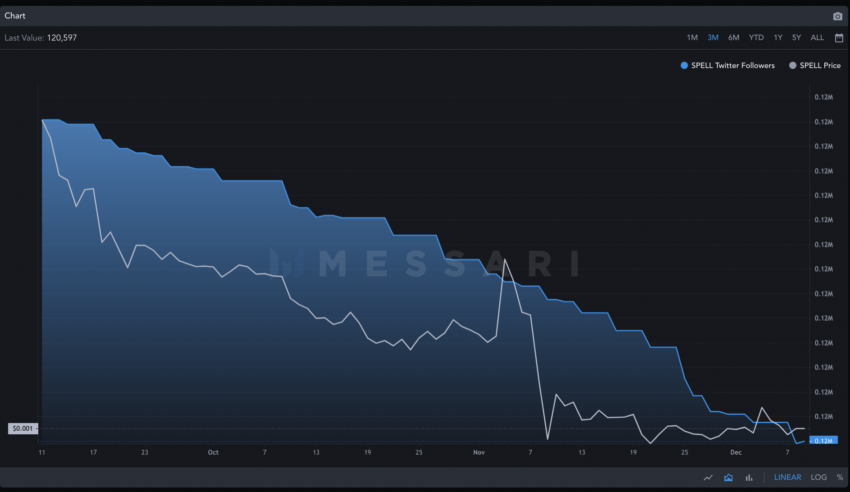
Social activity seems tepid and not enough to drive an immediate rally at the Spell token’s counter.
SPELL price prediction using technical analysis
Before we move ahead, here are the things we know about SPELL:
- The price of SPELL was at its highest on Nov. 16, 2021, when it reached $0.07515.
- The minimum price of SPELL is $0.0005836.
Here is a look at the SPELL-USD daily trading chart from BITFINEX in 2022— one of the first exchanges to list SPELL.
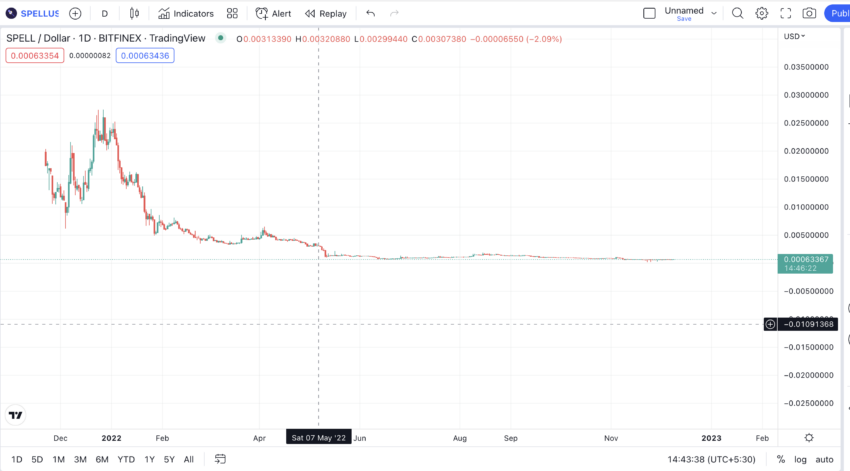
If you look closely, you see a discernable pattern.
A lower high, a low follow a massive high (plotted by us), and then a higher high. That’s the first pattern.
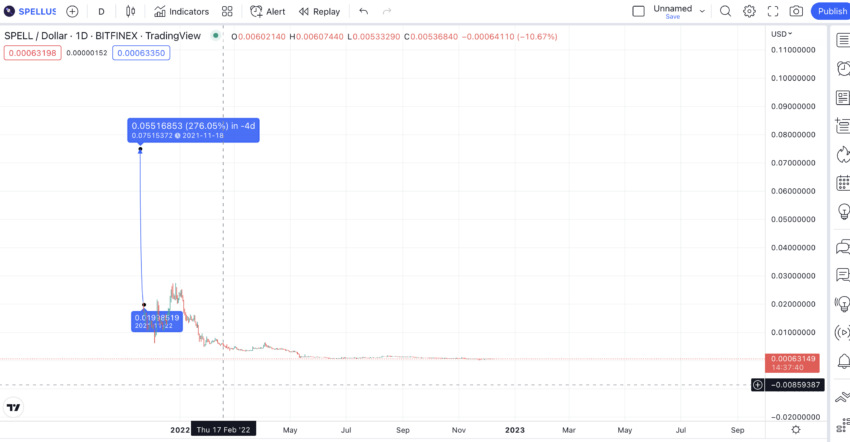
The second pattern is a higher high followed by a quick, smaller high. Then, a series of lower highs till the price flattens out.
We shall take the starting point as A for this SPELL price prediction piece. This is one of the first instances when SPELL actually got listed. So now, a definite pattern is visible. A—B—C.
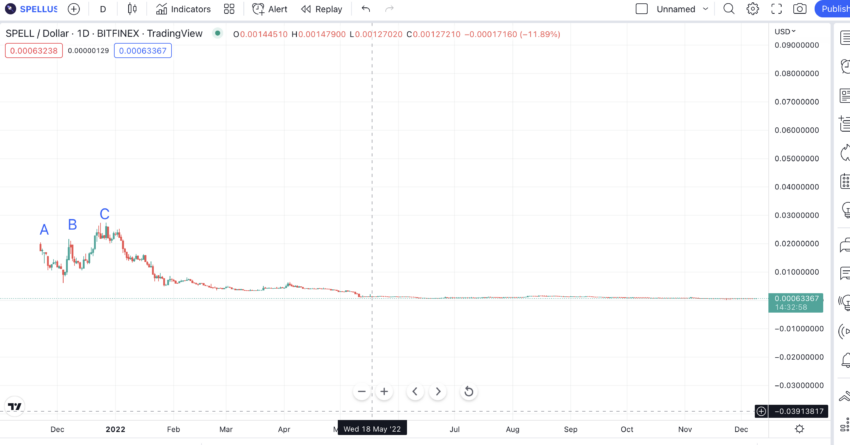
Pattern formation for SPELL
As you can see, the price of SPELL has been relatively flat and low since May 2022. So, we will take the pattern before that and try to project it further to identify any other future price patterns.
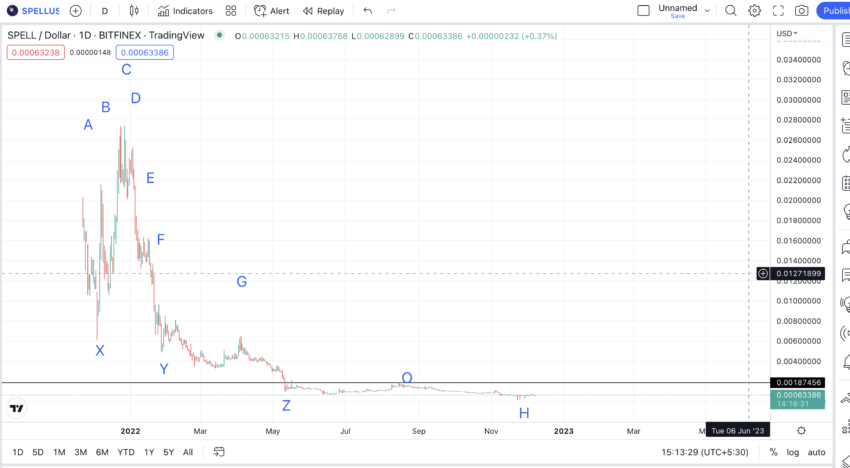
After reaching C, SPELL made a series of lower highs and ultimately dropped to its all-time low.
The lower high points are D, E, F, and G.
SPELL moved from A to B to C and then dropped from C to D to E to F to G, only to flatline. If the foldback (mirror pattern) principle is followed, the projected price rise should follow a similar path from G to A, only in reverse.
Also, while we have charter the highs, let us mark the lows. There are four identifiable low points, forming a larger lower-low picture. These points are X, Y, Z, and H.
Assuming the low for the SPELL token has been formed, we can now start projecting the next path. Also, there is a point O right between Z and H, which is a sort of high. That might be useful to calculate the next high that SPELL could make.
Spell Token (SPELL) price prediction 2024
Outlook: Bullish
We expected the price of SPELL to break the $0.003 mark in 2023. However, we continue to hold the same predictions for SPELL in 2024, as this is the year of Bitcoin Halving and other cornerstone events.
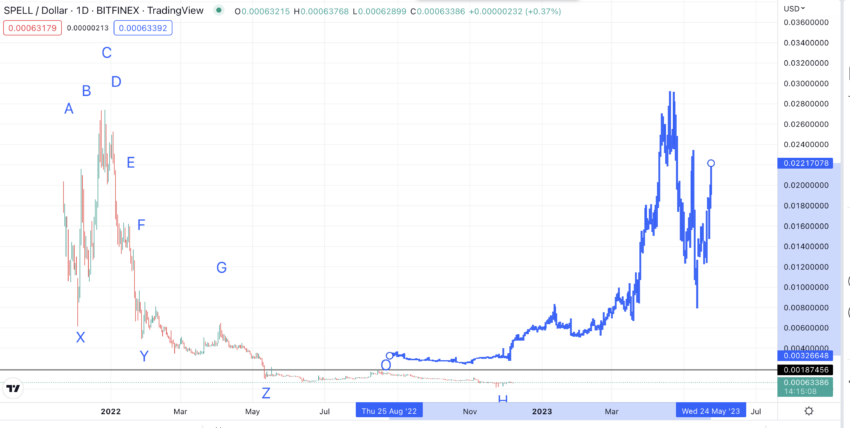
Next, we can draw a pattern from A to O and flip it onto the next part of SPELL price forecasts. This will help us generate SPELL price predictions for the short and long term.
The timeline of peaks and troughs can vary depending on market conditions.
To find the next high, we need to consider two scenarios. H is mirroring Z as the foldback low. Now, if we can find the distance and price change between Z and G, we can find the next high for SPELL.
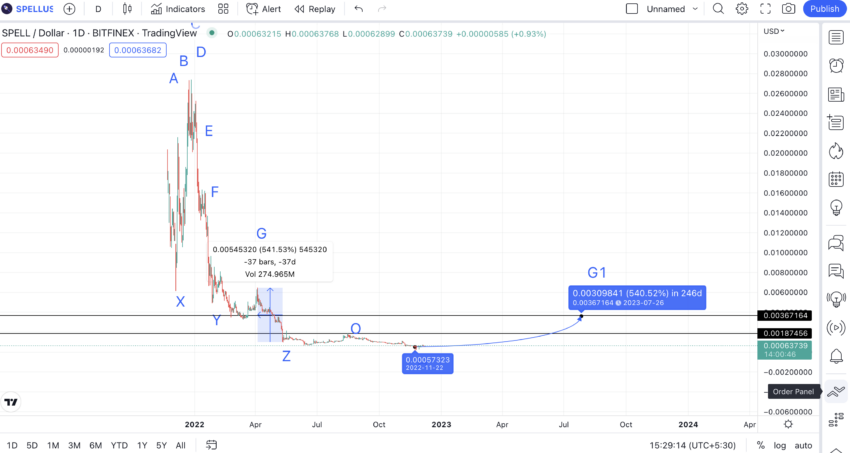
Z to H took SPELL 37 days and a 541% gain.
So H should follow the same path to the next high. However, on 11 May, the point where Z was placed, the trading volume was at $87.03 million. Also, on 22 November, the point of H, the trading volume was $13.10 million.
Here the ratio between the trading volume lows would be 6.64.
Therefore, from H to the next high, it would take SPELL 6.64 times more time to reach the 541% level. This comes down to 246 days. Also, the high could be lowered 6.64 times if market conditions persist. Hence, the probable high percentage could be 81.50%.
So on forecasting, we get the next high at $0.00367 in 2024. This level corresponds to the G from the previous or the reference pattern. Let us term this as G1.
The more probable high will be $0.00106 if we take the probable high percentage of 81.50%. However, SPELL has already come close to breaching this level with a high of $0.00105.
SPELL price action: trendlines, RSI, and moving averages (2022 data)
Outlook: Bearish
While the SPELL price predictions consider zoomed-out chart patterns, here is how the short-term trend looks for SPELL:
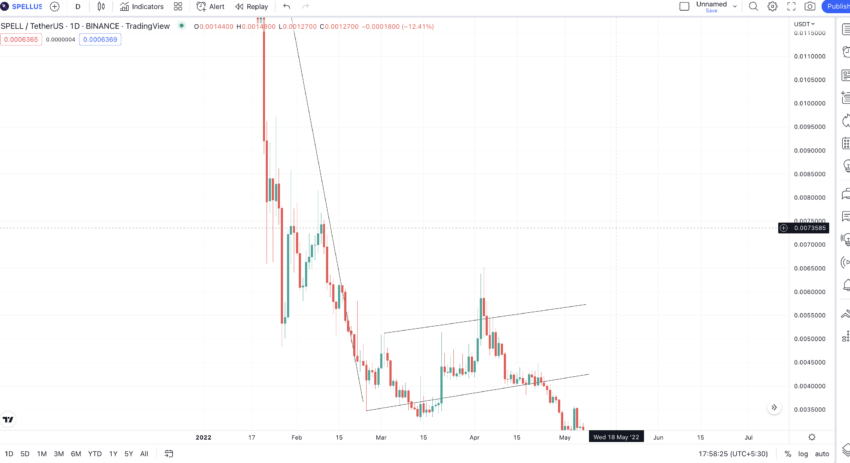
Do note that in April 2022, SPELL broke out of an inverted flag and pole pattern. The downtrend pushes the prices down, and it has been flat since.
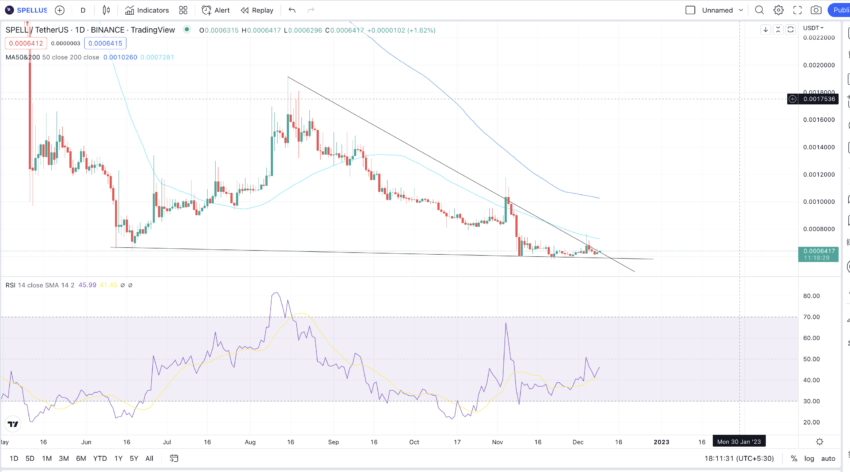
The current pattern resembles a descending triangle, which, if broken, can cause some short-term distress in SPELL prices. The RSI is still in the lower-high region and not sending out great and positive signals. Finally, the 100-day moving average line is currently moving below the 50-day MA line. However, if the 50-MA line crosses below the 100-MA — likely with the distance decreasing between the two — the prices might correct further.
Low in 2024
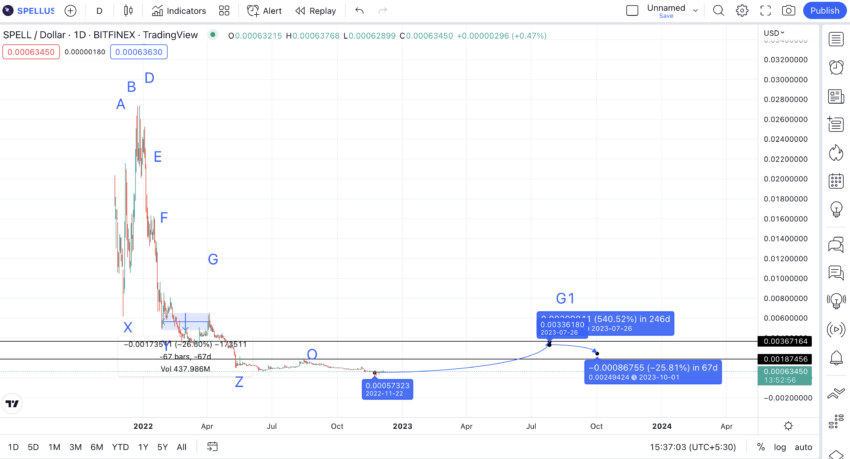
Now, to find the low in 2024, we must find the distance between G and Y per the reference pattern.
From G to Y, SPELL took 67 days and a 26.60% drop.
We do not need to use the projected trading volume ratio multiplier here, as the July 2023 level will stay in a different market scenario.
Hence, it would take SPELL approximately 67 days to find its next low.
As per the forecast, the 2024 low could be at $0.00249. However, if the high is restricted to $0.00106 in the bear market, the low could be $0.0007844.
Possible ROI from the current level: 290%
SPELL price prediction 2025
Outlook: Bullish
Now we know the immediate highs and lows for the corresponding pattern; we can apply the percentages accordingly.
Point Y to Point E = 15 days and 232.18%, Point E to Point D = 9 days and 56.27%, Point D to Point C = 7 days and 8.31%
Now, we see the time taken between two points keeps decreasing. This pattern might not hold in the future with multiple competitors and other governance tokens.
Hence, the better approach would be to extrapolate from the 2024 high of $0.00367 using the Fib indicator.
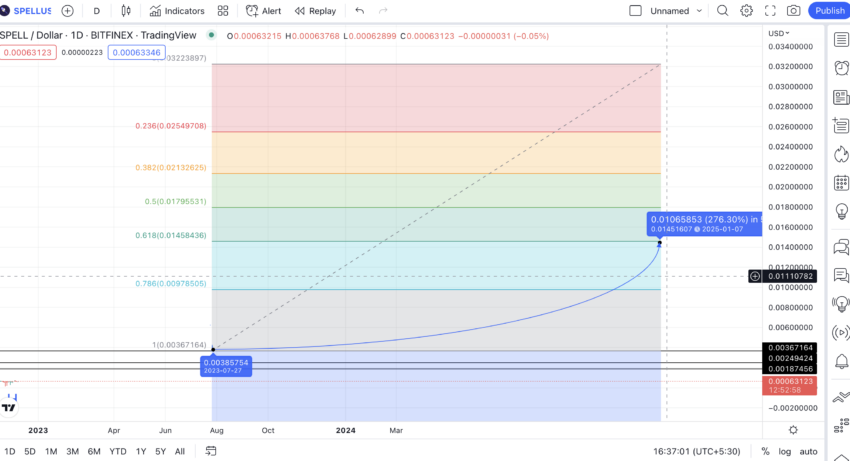
So, by 2025, the price of SPELL is expected to reach $0.0145. If you see the forecast line, you will know that the path starts as linear and grows into parabolic once we move out of the bear market phase.
Possible ROI from the current level: 1442%
SPELL price prediction 2030
Outlook: Very Bullish
If we extrapolate the findings till 2025 per the same path as before, we could see SPELL closing in on $0.0279 by early 2028. This SPELL price prediction in 2028 can give insight into the long-term price prediction of the token, including 2030.
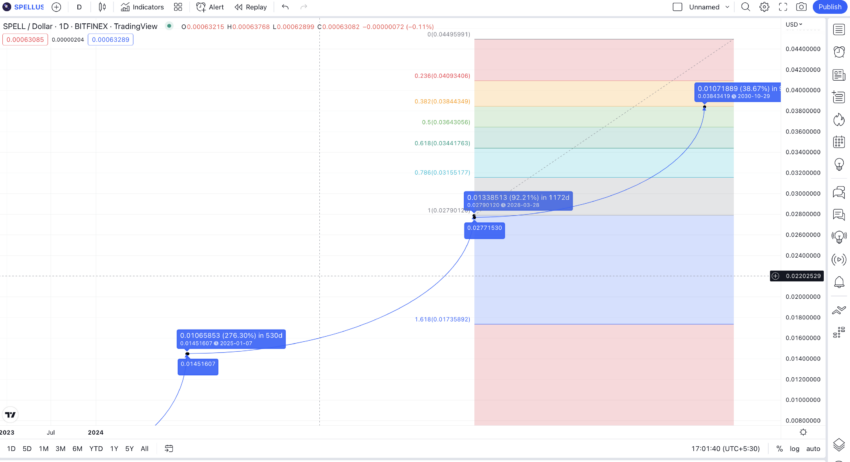
If all goes to plan and DeFi keeps growing, a realistic expectation for SPELL by 2030 would be to reach $0.038.
Project ROI from the current level: 3942%
SPELL long-term price prediction until the year 2035
SPELL doesn’t have a lot of data points to plot a chart till 2035. Here is a table that helps present SPELL price predictions up to 2035. We have kept the annual growth percentage and other factors like supply, market cap, and trading volume in mind.
You can easily convert your SPELL to USD
| Year | | Maximum price of SPELL | | Minimum price of SPELL |
| 2024 | $0.00367 | $0.00249 |
| 2025 | $0.0145 | $0.00580 |
| 2026 | $0.0195 | $0.00975 |
| 2027 | $0.02349 | $0.01409 |
| 2028 | $0.0279 | $0.01902 |
| 2029 | $0.032 | $0.02254 |
| 2030 | $0.038 | $0.03000 |
| 2031 | $0.057 | $0.039 |
| 2032 | $0.0912 | $0.0468 |
| 2032 | $0.1322 | $0.06084 |
| 2033 | $0.1983 | $0.09126 |
| 2034 | $0.317 | $0.1368 |
| 2035 | $0.476 | $0.2395 |
Let’s assume SPELL stays around till 2035. Let’s also assume it brings more use cases into the mix, aside from governance and fee-specific perks. In this case, we can expect SPELL to reach close to a dollar by 2040. However, the Spell token price prediction to 1 dollar remains subjective to Abracadabra Money existing by 2040.
Is the SPELL price prediction accurate?
The SPELL price prediction takes multiple factors into account. These include fundamentals, social activity, on-chain development, and technical analysis. Also, the SPELL price prediction is subject to the changing crypto market conditions, which can move from bear to bull with few intimations.
As the crypto market keeps changing, we believe SPELL price prediction models might also require updating. We shall do just that as new chart patterns and revelations emerge.
Frequently asked questions
Will Spell Token reach 1 dollar?
What will Spell Token be worth in 2025?
Is Spell Token a good buy?
What will Spell Token be worth in 2024?
Disclaimer
In line with the Trust Project guidelines, the educational content on this website is offered in good faith and for general information purposes only. BeInCrypto prioritizes providing high-quality information, taking the time to research and create informative content for readers. While partners may reward the company with commissions for placements in articles, these commissions do not influence the unbiased, honest, and helpful content creation process. Any action taken by the reader based on this information is strictly at their own risk. Please note that our Terms and Conditions, Privacy Policy, and Disclaimers have been updated.