

While the crypto market is buzzing in 2024, Ethereum (ETH), the second-in-command in the crypto space, has started showing bullish signs. We’ve compiled a detailed and data-packed Ethereum price prediction to help you make sense of ETH’s future potential price path.
Most popular platforms to buy BTC
Coinbase
Wirex
YouHodler

Read more about ETH and how to buy Ethereum here
- Is Ethereum better than Bitcoin?
- Ethereum price prediction and key fundamental metrics
- Ethereum price prediction and technical analysis
- Ethereum (ETH) price prediction 2024
- Ethereum (ETH) price prediction 2025
- Ethereum (ETH) price prediction 2030
- Ethereum (ETH) price prediction until the year 2035
- Does Ethereum have a future?
- Frequently asked questions
Is Ethereum better than Bitcoin?
Before we discuss the metrics to gauge the future price of ETH, it is important to address an ideological debate. Firstly, if you are bullish on Ethereum, it might not be advisable to sow FUD around Bitcoin. BTC still enjoys a massive 50+ percent market dominance and is arguably the oldest commercial crypto. Yet, it is true that where price performance in 2024 is concerned, ETH has surged by almost 4%, year-to-date, compared to the -2.77% experienced by BTC.
And all that has happened with Bitcoin ETFs being approved makes ETH look more bullish, at least in 2024. Ethereum also had its share of newsmakers in 2024, courtesy of the upcoming Dencun upgrade, which is expected to improve the network’s scalability. The Dencum upgrade, like the Shanghai, would introduce Ethereum EIPs, including the most important, EIP-4844, followed by EIP-1153, EIP-4788, and more.
Per the latest crypto market sizing report from Crypto.com, Ethereum has seen a 39% increase in adoption in 2023, compared to BTC’s 31%. The growth in the DeFi space, including the popularity of wrapped tokens, could be one of the reasons for this increased adoption rate.
Did you know? Ethereum’s Dencun upgrade combines Denub, a star in the Cygnus Constellation, and Cancun, a Mexican city.
Furthermore, Ethereum re-staking, a concept aimed to make ETH more useful via the Eigen layer protocol, is also receiving much-anticipated attention. All of this indicates that while Ethereum might not be more popular than Bitcoin, it certainly shows more promise across diverse arenas.
Already stoked about the future of ETH from the previous sections? Well, let us move straight to the fundamentals.
Ethereum price prediction and key fundamental metrics
A quick metric to start this segment would be the transaction count. Notably, the transaction count surged towards the end of 2022, followed by a miraculous price surge in under a month.
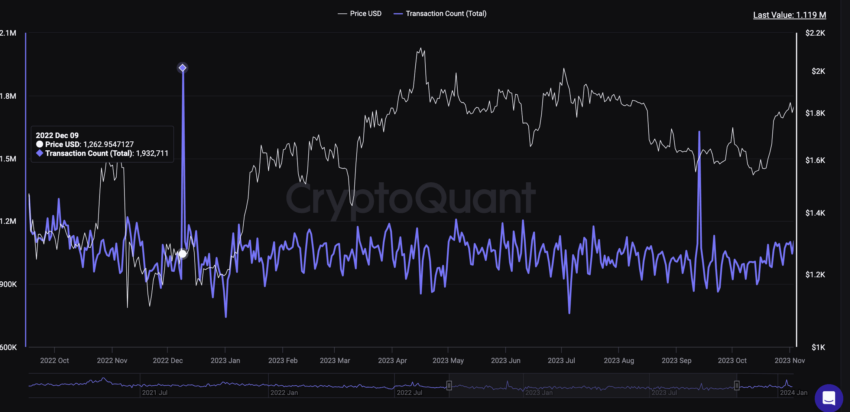
A similar peak in the transaction count was recorded in September 2023, after which the prices surged slightly. It will be interesting to see if a January 2023-like surge happens, but the sign itself looks bullish.
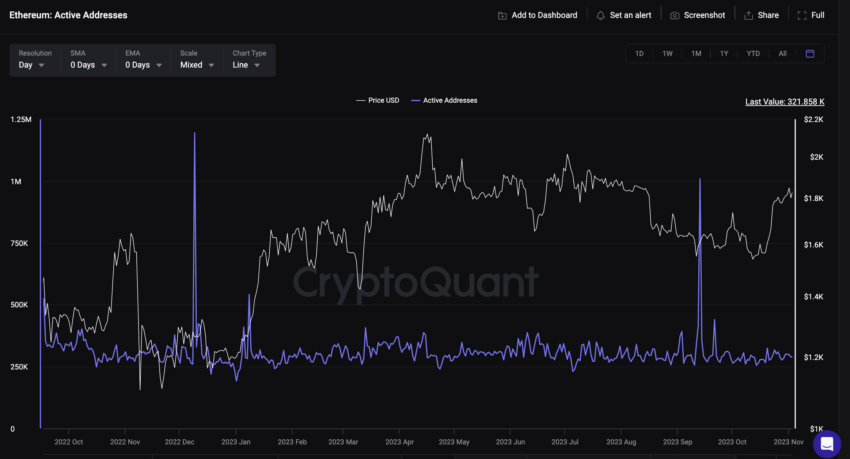
Another bullish metric:
Another crucial metric to look at is the active address count. Notice how the peak in September 2023, post-ETH Merge, resembles that of December 2022. The prices have increased since, showing a bullish trend for the price of ETH.
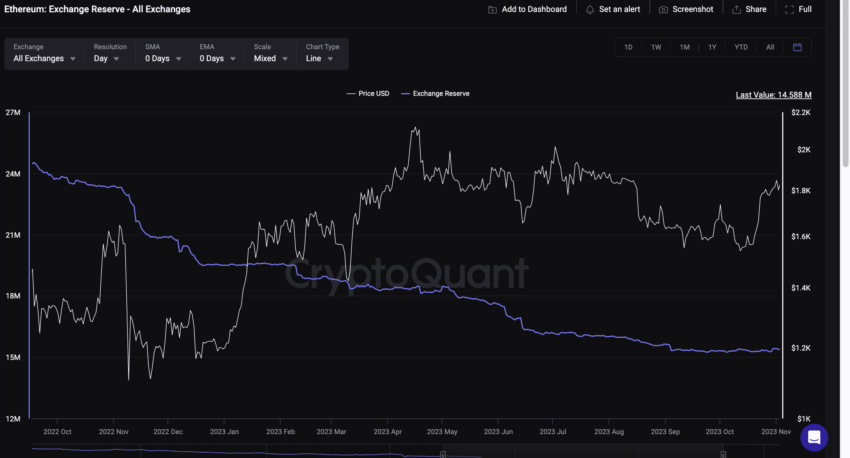
The Exchange Reserve is the most bullish indicator for the coin price as of January 2024. ETH stocked across exchanges is dropping post-October 2024, indicating a trend towards “Hodling” ETH.
The popularity of Ethereum products like the ENS, staking platforms that offer high-interest rates on ETH holdings, EIPs, and ERCs focusing on NFTs are good indicators of the network’s health.

For Ethereum, the surging gas fee structure is the best possible indicator for network adoption, and this has been on the way up. Historically, a higher high formation in the fee counter leads to a price surge.
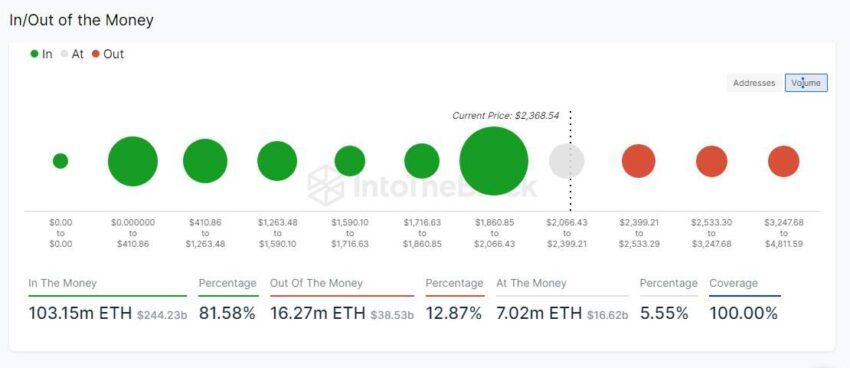
Before we delve into the technical analysis, the current price point (as of Jan. 23, 2024) of $2,400 is closer to the demand zone. Note that at this price, over 80% of traders are profitable. And the path forward, after the $2534 level, if reached, might quickly push ETH over the famed $3000 mark with minimal resistance.
Ethereum price prediction and technical analysis
Throughout the next few sections, we shall discuss the broader charts associated with the price of Ethereum. The idea will be to locate the average price percentages between the previously elapsed highs and lows to build a more accurate technical analysis and form a data-backed ETH price prediction. But before we delve into the weekly charts, let us do a quick short-term technical analysis to understand ETH’s near-term future price potential.
“Strong bounce from Ethereum resulting into a likely uptrend. Needs to break through 0.06 BTC to make sure that the trend can continue, but the weekly bullish divergence identifies that there will be substantial strength in the coming months.”
Michaël van de Poppe, founder of MN Trading: X
Short-term technical analysis of ETH
If you are looking to buy ETH in the immediate future, it is crucial to look at this analysis first:
At first glance, the coin price is making higher highs, which might look bullish. Yet, there remains a catch. ETH seems to have broken below the lower trendline of the triangle pattern. However, this wasn’t the case as a few trading sessions earlier, the upper trendline was breached with high volume, attracting several buyers.
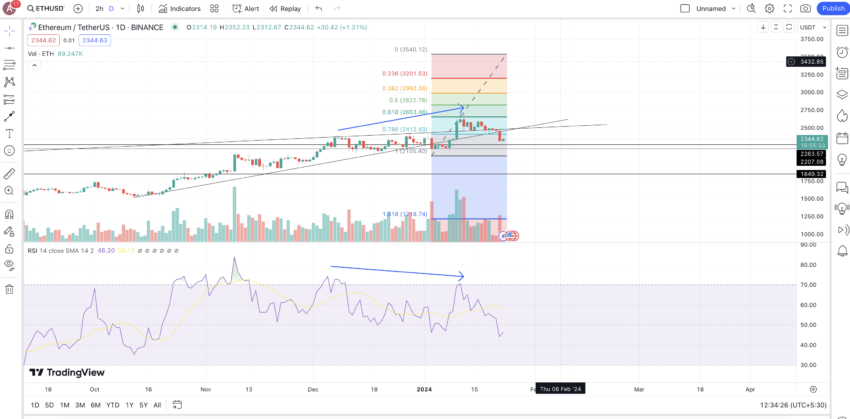
But if buyers had observed the Relative Strength Index (RSI) indicator making a lower high, they would have known that a correction was imminent. If the dip continues, there are strong support levels at $2267 and $2207, respectively. If the correction deepens, we could even see a low of $1850 in 2024.
However, suppose the bearish trend reverses, and the RSI moves above the 65 level, making a higher high. In that case, we can expect the coin price to head towards $2653, which is one of the low-resistance zones, as explained by the fundamental analysis. Note that this would require higher volumes.
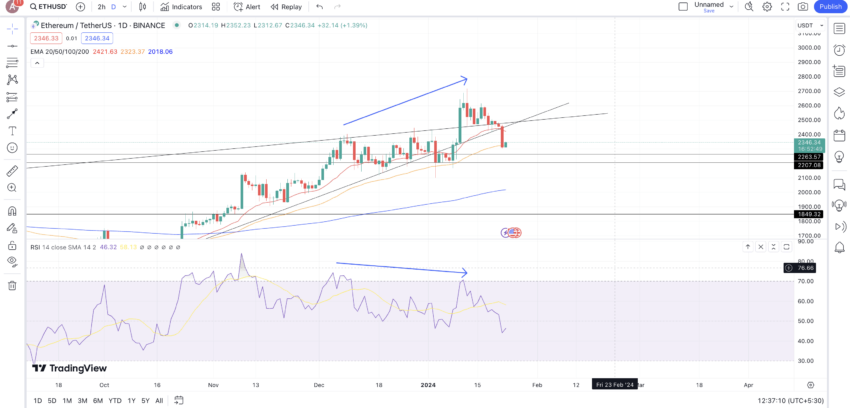
From the Exponential Moving Average (EMA) perspective, the broader trend is still bullish, with the 50-day EMA line (orange) trading above the 200-day line (blue).
Weekly patterns and historical price moves
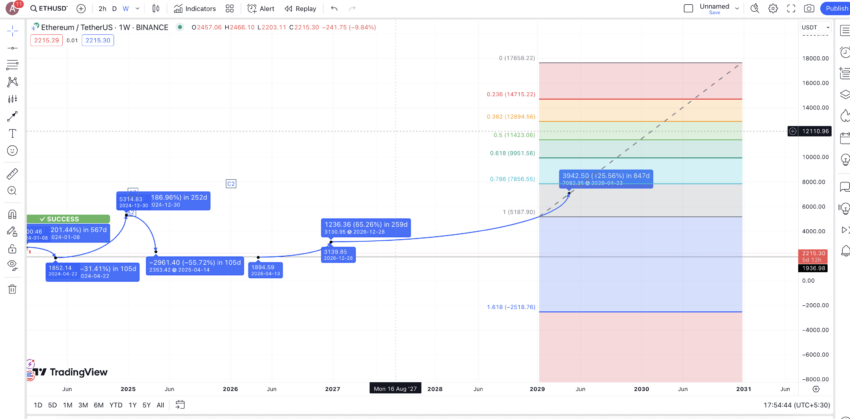
We can now pull out the Ethereum weekly chart — Binance’s ETH/USDT pair, and some clear patterns surface. The price of ETH, evaluated since 2017, is seen in a set pattern, A-B-C-D-E-X. Post X, the same pattern seems to be replicating itself, currently holding steady at D1 and waiting for the next E1 and X1.
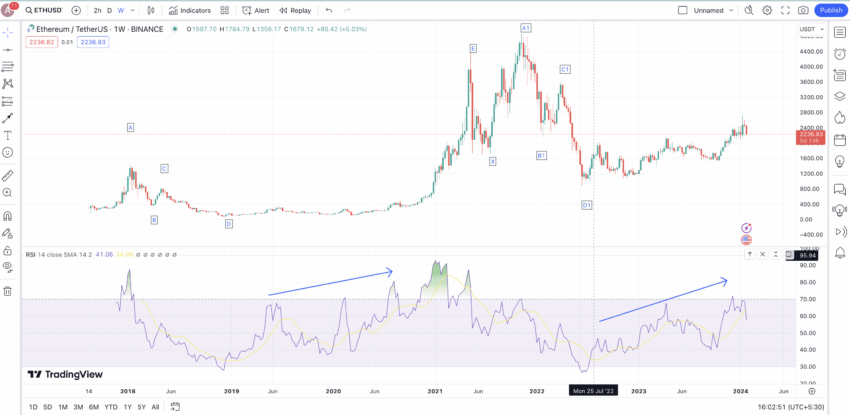
If we can identify the percentage peaks and drops for the A-to-X pattern and the A1-D1 pattern, we can determine the average price percentage levels for the next high at E1 and the subsequent low at E1.
Supplementing this price move is the RSI indicator, which teased the price move earlier, post the higher high formations associated with the A-to-X pattern. A similar RSI formation is now being seen post-D1, which might mean that, like E forming above A, E1 might form above A1, ensuring new all-time highs for the coin price.
Calculations
Here are two tables — one with every level charted between A to X and the other charting every level between A1 to D1:
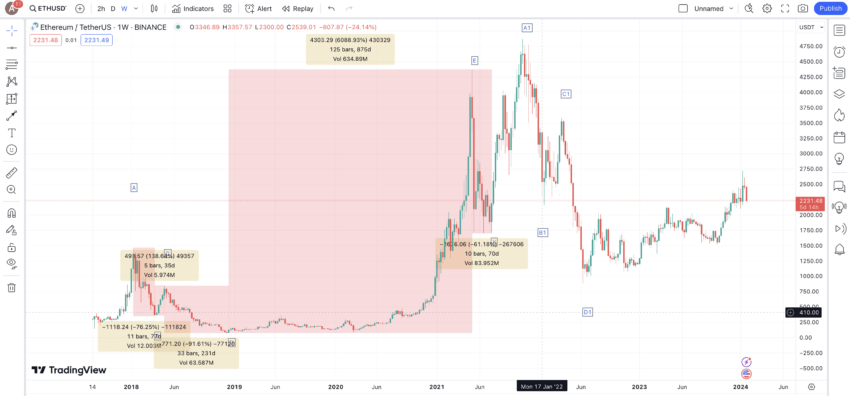
Table 1:
| A to B | -76.25% in 77 days |
| B to C | 138.64% in 35 days |
| C to D | -91.61% in 231 days |
| D to E | 6088.93% in 875 days |
| E to X | -61.18% in 70 days |
Additional point: X to A1- 187.13% in 112 days
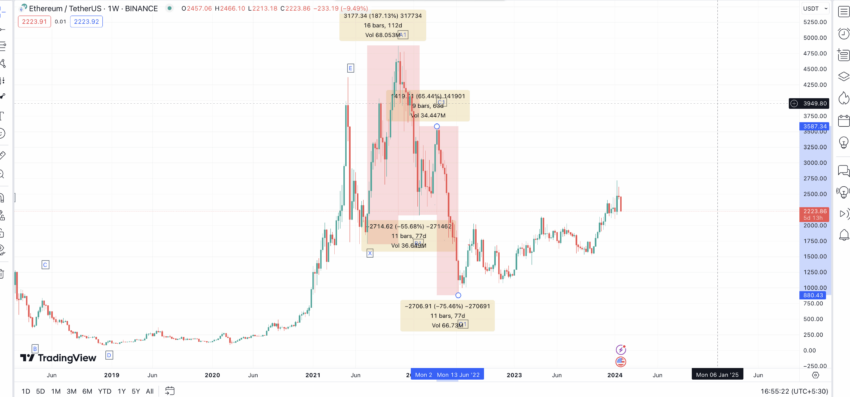
Table 2:
| A1 to B1 | -55.68% in 77 days |
| B1 to C1 | 65.44% in 63 days |
| C1 to D1 | -75.46% in 70 days |
Using data from above, we shall now locate the average price moves — percentages and days needed — for Ethereum’s high-to-low and low-to-high moves.
High-to-low: 72.036% in 105 days (lowest drop would be -55.68% in bull markets)
Low-to-high: 1620.035% in 271 days (lowest surge would be 65.44% in saturated markets)
We shall now use the details to locate the future price of ETH over the years.
Ethereum (ETH) price prediction 2024
Outlook: Bullish
Now that we have the last low at D1, we can expect the next high to surface anywhere between a surge of 65.44% to 1620.035%, which is the average low-to-high price percentage. However, with the bull market still far off, we can consider the E1 to surface at the last swing high, which surfaces at the onset of 2024. This level puts the first high of 2024 at $2723, which translates to a surge of 201%, in line with the second-highest price peak of 187.13% from the data earlier.
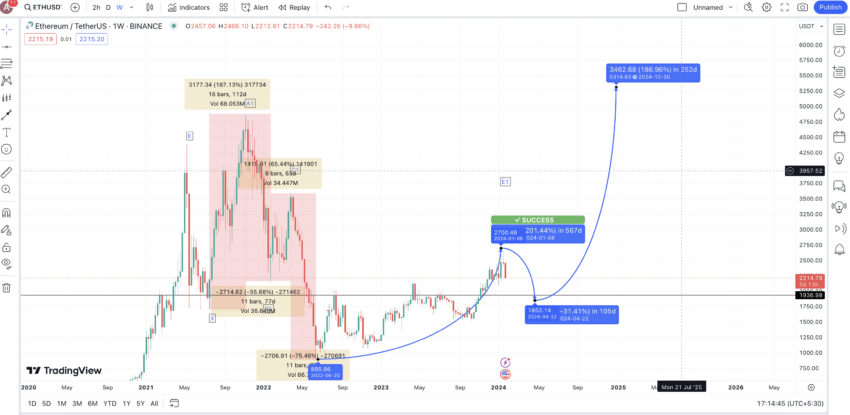
Assuming this level E1 and the next low or X1 to surface at $1850, per the short-term technical analysis, we can expect the minimum price of ETH in 2024 to not fall under the $1800 mark. Based on our average price and distance findings, the minimum price should be reached by April 2024.
However, by that time, Bitcoin halving should be near, which might also push the altcoin space higher. Therefore, from the 2024 low of $1850, we can expect a 187.13% surge — the X to A1 surge or the second highest percentage growth — by the end of 2024. This translates to a price level of $5314, beating all the existing all-time highs.
Projected ROI from the current level:141%
Ethereum (ETH) price prediction 2025
Outlook: Bullish
By this time, altcoins like Ethereum and even Ethereum Classic should be riding the bull wave. Therefore, despite the expected profit booking at this time, the dip should not exceed 55.68%, per data from the tables above. Therefore, the minimum price of ETH in 2025 should be supported at $2353.
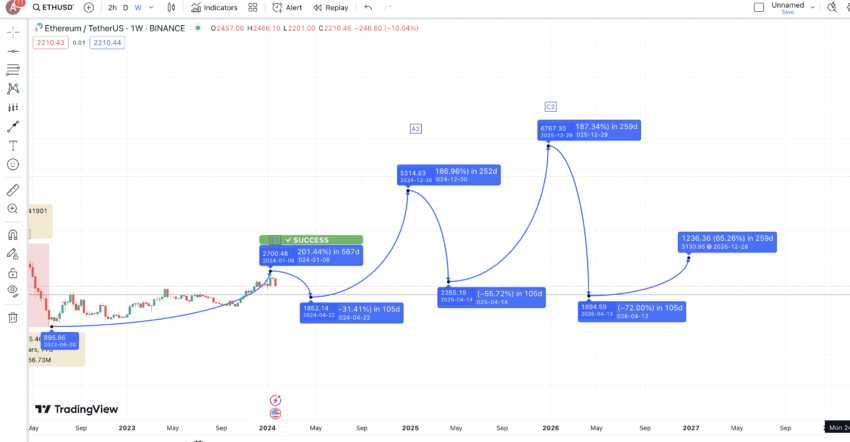
From this price, we can expect another surge of 187.13%, which is expected to surface towards the end of 2025. This puts the ETH price forecast for 2025 at $6767.
Projected ROI from the current level: 207%
Ethereum (ETH) price prediction 2030
Outlook: Very bullish
If our ETH price forecast for 2025 holds and the coin price reaches $6767 by the end of 2025, we can expect a deeper correction in 2026, courtesy of rapid selling. At this point, 100% of the ETH holders should be in the money, making 2026 the year of a stricter correction. From the previous high or C2, we can then expect ETH to drop 72.036% in 105 days, per our average price identification.
This would put D2 or the 2026 low at $1894. With the bears being in charge, the high from this level might only scale to 65.44%, the lowest price surge in a bear market. This puts the 2026 high at $3130.25.
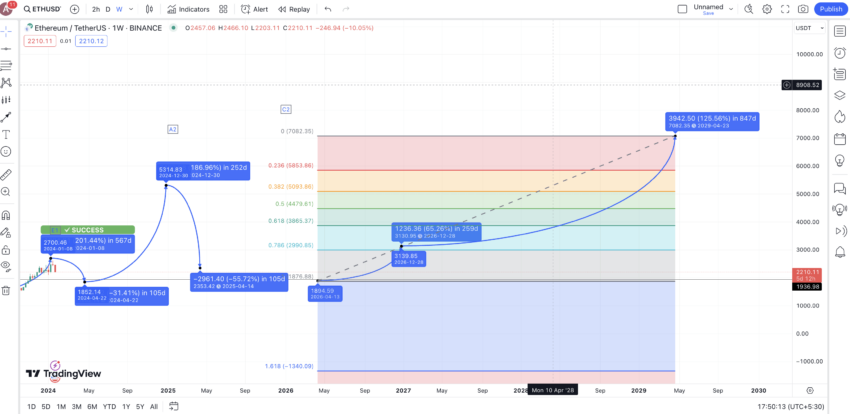
If we keep these bull and bear cycles in mind, ETH should assume an all-time high of $7082 by the end of 2029. If this level is reached, with the 2029 low expected to form around $5100, we can expect the price of Ethereum to surge as high as $17658 by 2030.
Emir Beriker, Co-founder and Head of Strategy at Union: BeInCrypto interview
Projected ROI from the current level: 702%
Ethereum (ETH) price prediction until the year 2035
Now that we have the ETH price forecast levels till 2030, we can extrapolate the data and locate the expected future price levels by 2035. Here is the table for your reference:
| Year | Maximum price of ETH (expected) | Minimum price of ETH (expected) |
| 2024 | $5314 | $1850 |
| 2025 | $6767 | $2353 |
| 2026 | $3130 | $1894 |
| 2027 | $1987 | $1511 |
| 2028 | $4822 | $2234 |
| 2029 | $7082 | $5100 |
| 2030 | $17658 | $11175 |
| 2031 | $37442 | $21477 |
| 2032 | $67851 | $37055 |
| 2033 | $111182 | $58950 |
| 2034 | $169587 | $88205 |
| 2035 | $245219 | $125862 |
The price and actual prices will also depend on how other supposed “Ethereum-killers,” such as Solana and Cardano, manage to innovate over the years.
Does Ethereum have a future?
Our Ethereum price prediction model believes that ETH could be one of the more aggressive altcoins in the near future despite a large market cap. With the ETH 2.0 roadmap expected to go further in the coming years, focusing on lowering the main net fees and increasing scalability, Ethereum looks poised for a bullish decade. Regardless of these expectations, it would help to always do your research (DYOR) before taking long or short positions at ETH’s counter. Remember only to invest what you can afford to lose.
Frequently asked questions
How much will 1 Ethereum be worth in 2025?
What will Ethereum be worth in 2030?
Can Ethereum rise again?
Will Ethereum reach $50,000?
Is ETH still a good investment?
How high can Ethereum go?
Can Ethereum hit $5,000?
Will Ethereum reach $10,000?
Will Ethereum go to zero?
What’s the difference between Ethereum and Bitcoin?
Who founded Ethereum?
Disclaimer
In line with the Trust Project guidelines, the educational content on this website is offered in good faith and for general information purposes only. BeInCrypto prioritizes providing high-quality information, taking the time to research and create informative content for readers. While partners may reward the company with commissions for placements in articles, these commissions do not influence the unbiased, honest, and helpful content creation process. Any action taken by the reader based on this information is strictly at their own risk. Please note that our Terms and Conditions, Privacy Policy, and Disclaimers have been updated.