


Trading crypto is true craftsmanship. It requires skills, knowledge, and time spent learning about strategies to increase your chances of maximizing your return on investment. If you’re interested in learning about chart analysis to improve your trading knowledge, this quick guide to the inverted hammer candlestick is a good place to start.
What is the inverted hammer candlestick?
The inverted hammer candlestick (also called an inverse hammer) signals the end of a downtrend.
When you see this candlestick pattern on a chart, it suggests there’s buying pressure. Hence, prices could start to rise. The inverse hammer, therefore, warns traders that a bullish reversal pattern could be on the horizon. A bullish reversal means buyers will take over and reverse a downtrend into an upward trend.
Candlestick patterns represent the movement of prices in a candlestick chart. It helps crypto traders try to predict a crypto asset’s future price direction. An inverted hammer candlestick is one of the patterns on such charts.
A Japanese rice trader called Munehisa Homma developed the idea of candlestick charts in the 18th century. Today, crypto traders use candlestick charts in their technical analysis to forecast what might happen next regarding asset prices.
What does the inverted hammer look like?
As the name suggests, the inverted hammer candlestick looks like an upside-down hammer or inverted capital “T.” The body is short with a long upper wick (also called a shadow). It may or may not have a tiny lower wick. The upper wick is extended and is at least double the size of the real body.
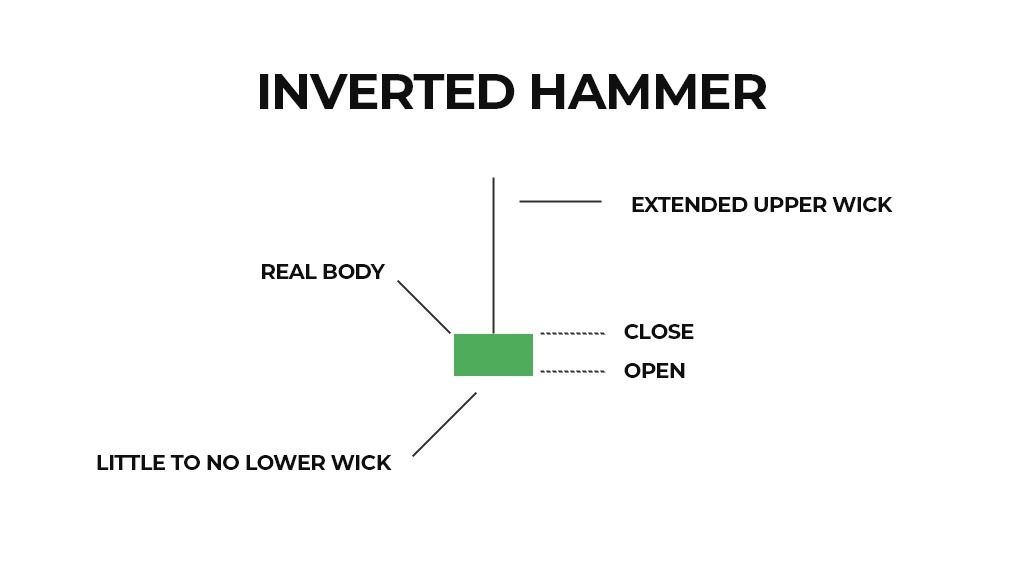
Here’s what the different parts of a candlestick represent:
- Body: It portrays the open-to-close price range.
- Wick: The wicks or shadows depict the intra-day low and high.
- Color: The colors of the candlestick bodies reveal the direction of an asset’s price. White or green bodies suggest a price increase. Conversely, black or red bodies signify a price drop.
Green and red inverted hammers
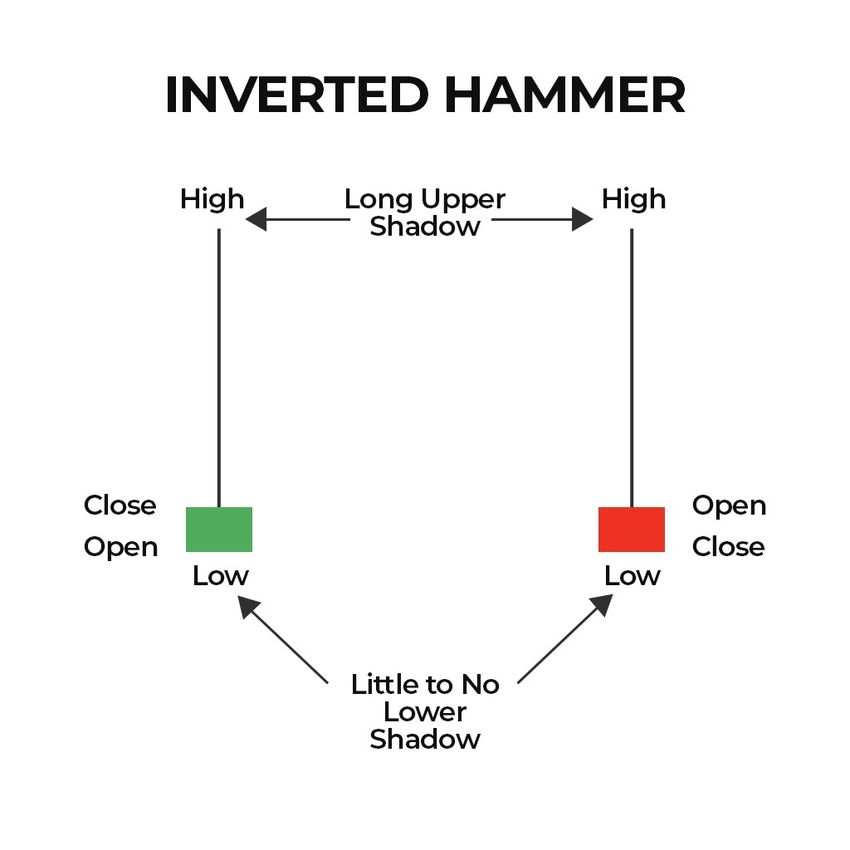
An inverted hammer candlestick can be either red or green.
A green (bullish) inverted hammer candlestick forms when the closing price is higher than the opening price and there is a long extended upper wick.
Conversely, a red (bearish) inverted hammer candlestick forms when the closing price is lower than the opening price and there is a long extended upper wick.
In both instances, the closing and opening prices will be very close together, helping to create the hammer shape of the candlestick.
A green inverted hammer is considered a more bullish indicator than its red counterpart, although both are considered bullish.
How does an inverted hammer form?
An inverted hammer forms when bullish traders gain confidence, and the open, low, and close prices are almost the same. The bullish traders create the long upper shadow as they take over and push prices as high as they can. On the other hand, bears or short sellers form the tiny lower small wick as they oppose the rising prices and try to push them where they were during the open. However, with an inverted hammer actually materializing, the buying pressure overpowers the bears, and the price settles at a higher level.
Therefore, the inverted hammer is interpreted as a bullish signal. Prices resist a downward trend thanks to powerful buying pressure from buyers. The candlestick that appears the next day is taken by traders as a consecutive signal to judge whether prices might be surging higher or might be starting to fall again.
An inverse hammer can also occur during an uptrend. When this happens, it is called a shooting star and warns traders of an upcoming bearish reversal. It forms when the prices of open, low, and close are about the same. A shooting star takes place at the top of an uptrend. It indicates the bears have overcome the bulls and have pushed the closing price below the open.
Inverted hammer formation in detail
The bullish inverse hammer formation includes two candles: a tall black or red candle followed by a short candle with a long upper wick. The tall candle appears on the first day, and the short one emerges on the second. Both candles emerge at the bottom of the trading range.
The market opens at the bottom of the trading range on the day the inverted hammer candle appears.
The buyers attempt to reverse the downtrend, but the rise isn’t strong enough (due to resistance from sellers). So, the asset’s price closes near its opening price.
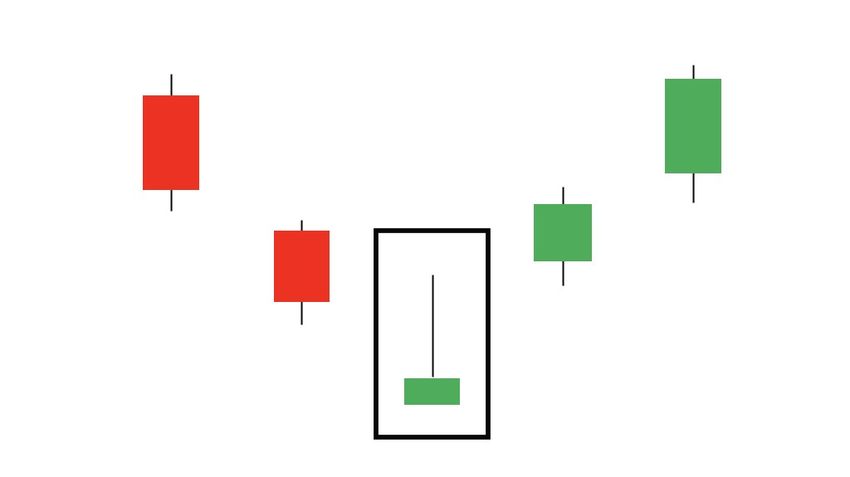
The guarantee — if at all, remember there is no certainty in markets — of a reversal can only be considered more certain on the second day. At this point, the price opens above the body of the inverted hammer. This confirmation becomes more reliable as the market opens higher.
What does the inverted candlestick hammer mean?
After a prolonged downtrend, an inverted candlestick hammer appears, signaling buyer pressure. It warns traders that a bullish reversal could happen. The short candlestick body suggests asset prices have dropped and sellers have lost control.
However, traders must not view the inverted hammer on its own. They need to observe other candlestick traits, technical indicators, and subsequent candlestick patterns to make informed decisions. For instance, a really long upper wick is a strong indicator of a bullish reversal. Also, a green inverted hammer implies a bullish bias.
So, depending on what various indicators and subsequent candles tell you, consider going long (buying) only if you think the uptrend will continue. On the other hand, you should sell (go short) if you believe the inverted hammer isn’t powerful enough, and the downtrend will most likely resume.
The pros and cons of an inverted hammer candlestick
Pros
- Easy to identify: The inverse hammer is easy to recognize since it appears at the bottom of the trading range and has the distinct shape of an upside-down hammer. This means this candlestick pattern is beginner-friendly.
- Investors can enter their positions at various points: The inverse hammer enables investors to enter their positions at the start of the uptrend or when the uptrend is acquiring momentum.
Cons
- The inverse hammer may be a short-lived indicator: The inverse hammer may be short-lived and not an indicator of a long-term trend. Therefore, it’s important to confirm the market’s direction before you make any moves.
- Traders need other indicators to make informed decisions: Traders cannot use the inverse hammer in isolation. They need to look at other indicators to make the best decision.
Why traders should know the inverted hammer
The inverted hammer candlestick is a pattern that crypto traders can use to make, sell, or buy positions. It is also pretty straightforward. Hence, beginners can use it as well. However, making trading decisions based on a combination of factors and trading signals is essential. This includes sentimental factors as well as technical analysis and chart patterns. Making decisions based on the inverted hammer alone is not advisable; the pattern is one of many tools with which effective analysis can be carried out.
If you want to raise your game and get into the nitty gritty with trading, platforms such as TradingView offer intelligent drawing tools and features to help you utilize charts and conduct technical analysis.


