


The Dogecoin (DOGE) price has fallen since July 25 and broke down from horizontal support on October 9.
Even though it broke down from the horizontal support, the cryptocurrency still has the support of a longer-term level. Will DOGE be able to rebound?
Dogecoin Breaks Down From Critical Level
The technical analysis on a daily chart reveals that DOGE has maintained a price level above $0.060 since June 10.
Additionally, it indicates that DOGE has been following a downward-sloping resistance trendline since July 25. These two factors combined form a descending triangle pattern, which is typically seen as a bearish pattern.
On October 9, the Dogecoin price experienced a resurgence in volatility, dropping below the support level. This decline led to a low point of $0.057, marking the lowest price since August 17, when the cryptocurrency had previously dropped to $0.055.
Yesterday, DOGE‘s bounce could not be sustained, leading to a decrease.
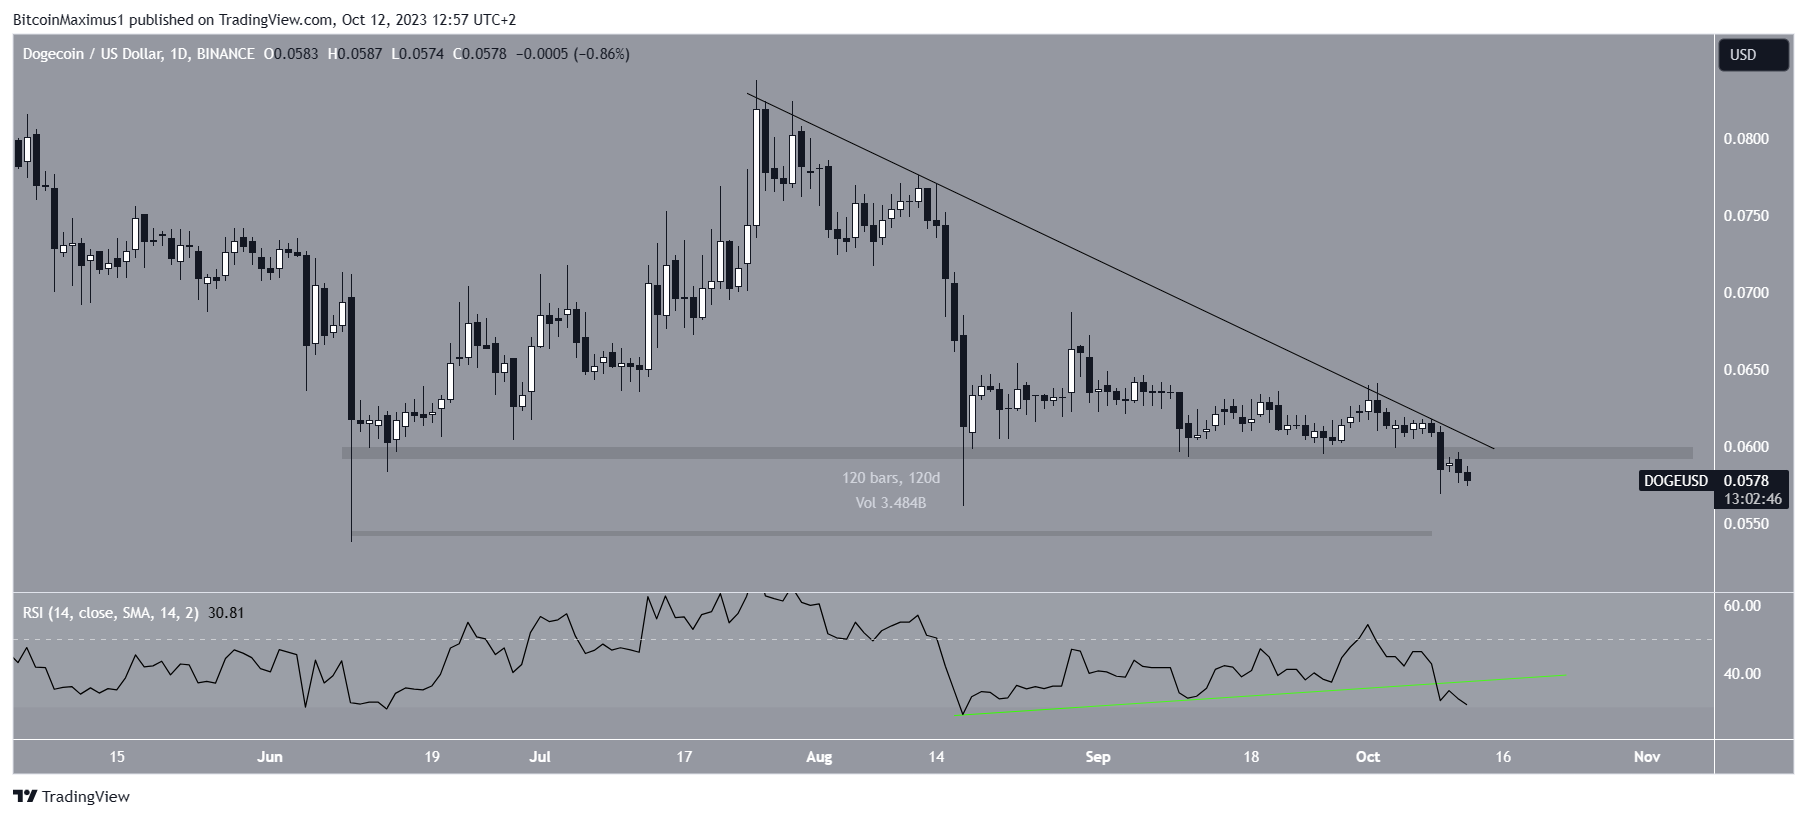
The daily Relative Strength Index (RSI) shows a bearish trend. RSI is a momentum indicator that helps traders assess whether the market is in an overbought or oversold condition, providing guidance on whether to buy or sell an asset.
When the RSI reading is above 50, and the trend is upward, it favors the bullish side. Conversely, if the RSI reading is below 50, it suggests a bearish sentiment.
Currently, the RSI is below 50 and declining, which are both indications of a bearish trend. Moreover, the indicator has broken below its bullish divergence trendline (green line).
DOGE Price Prediction: What Happens After the Breakdown?
The weekly analysis also presents a negative outlook, with two primary reasons for this view.
To begin with, the DOGE price is currently situated within a larger descending triangle pattern, with its base at $0.057. As previously mentioned, this pattern is typically seen as bearish.
If there is a breakdown that encompasses the entire height of the triangle (black line), the DOGE price could drop to $0.020. This would represent a decline of 67% when measured from the current price.
Check Out the Best Upcoming Airdrops in 2023
The 1.27 Fibonacci extension level (white) further reinforces this level as a potential bottom, as it coincides with $0.020.
According to the Fibonacci retracement theory, after a substantial price movement in one direction, the price is expected to partially retrace to a previous price level before continuing in the same direction.
This theory can also help identify potential support levels during downward movements. Much like the daily timeframe, the weekly RSI is bearish as it is below 50 and declining.
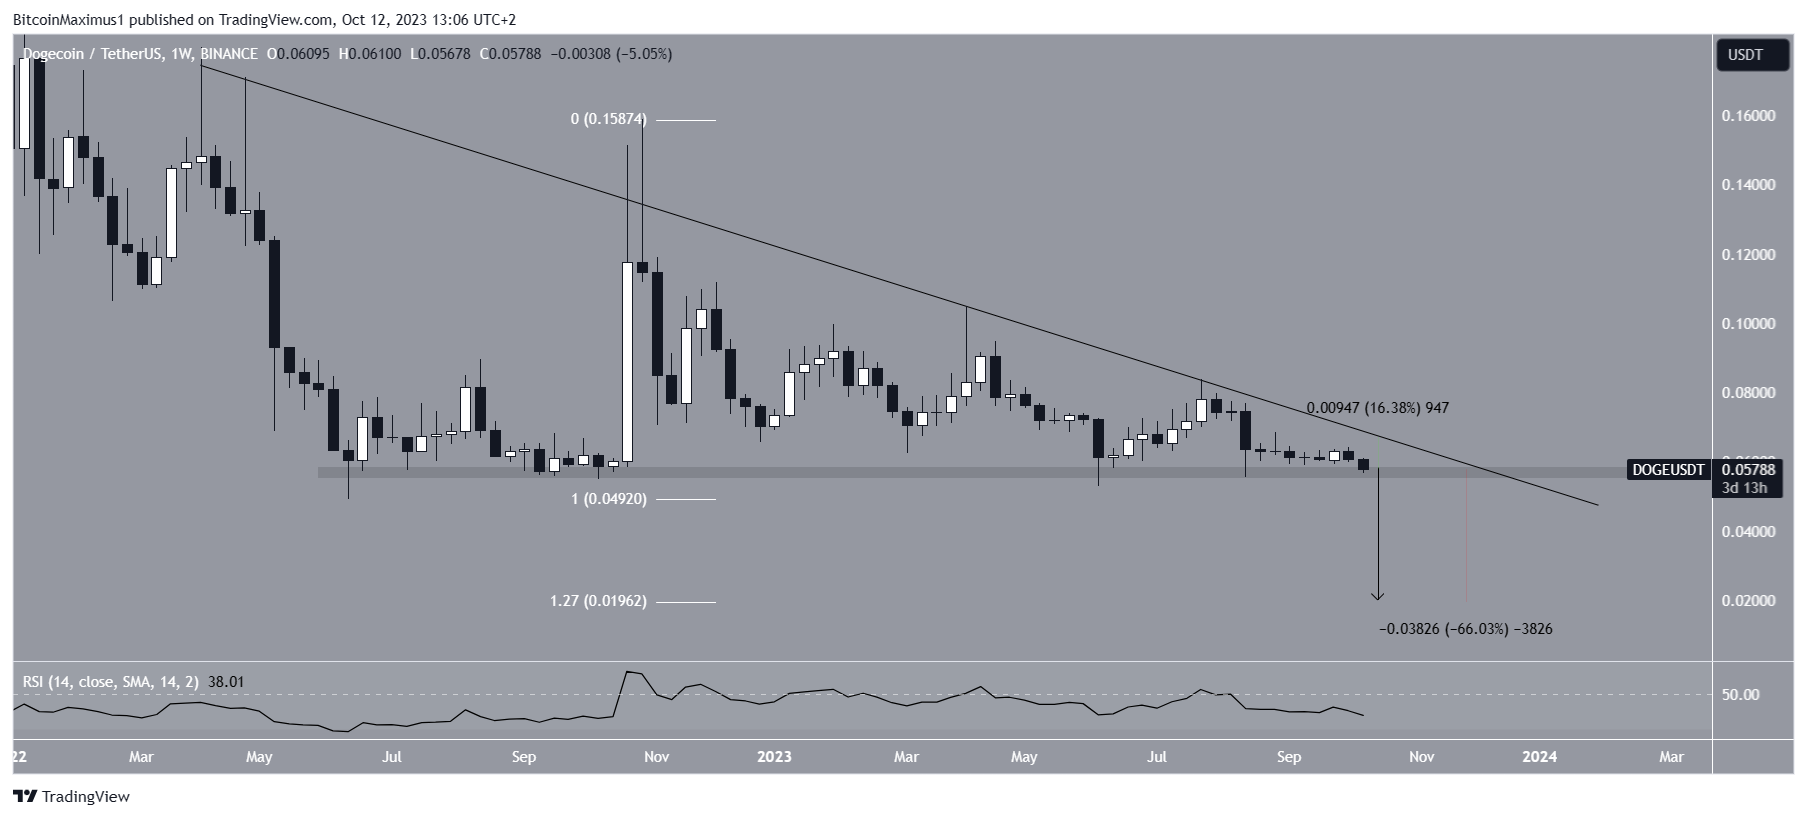
Despite this bearish price prediction for DOGE, a substantial rebound from the long-term horizontal support level at $0.057 could potentially result in a 16% increase toward the long-term descending resistance trendline, currently situated at $0.070.


