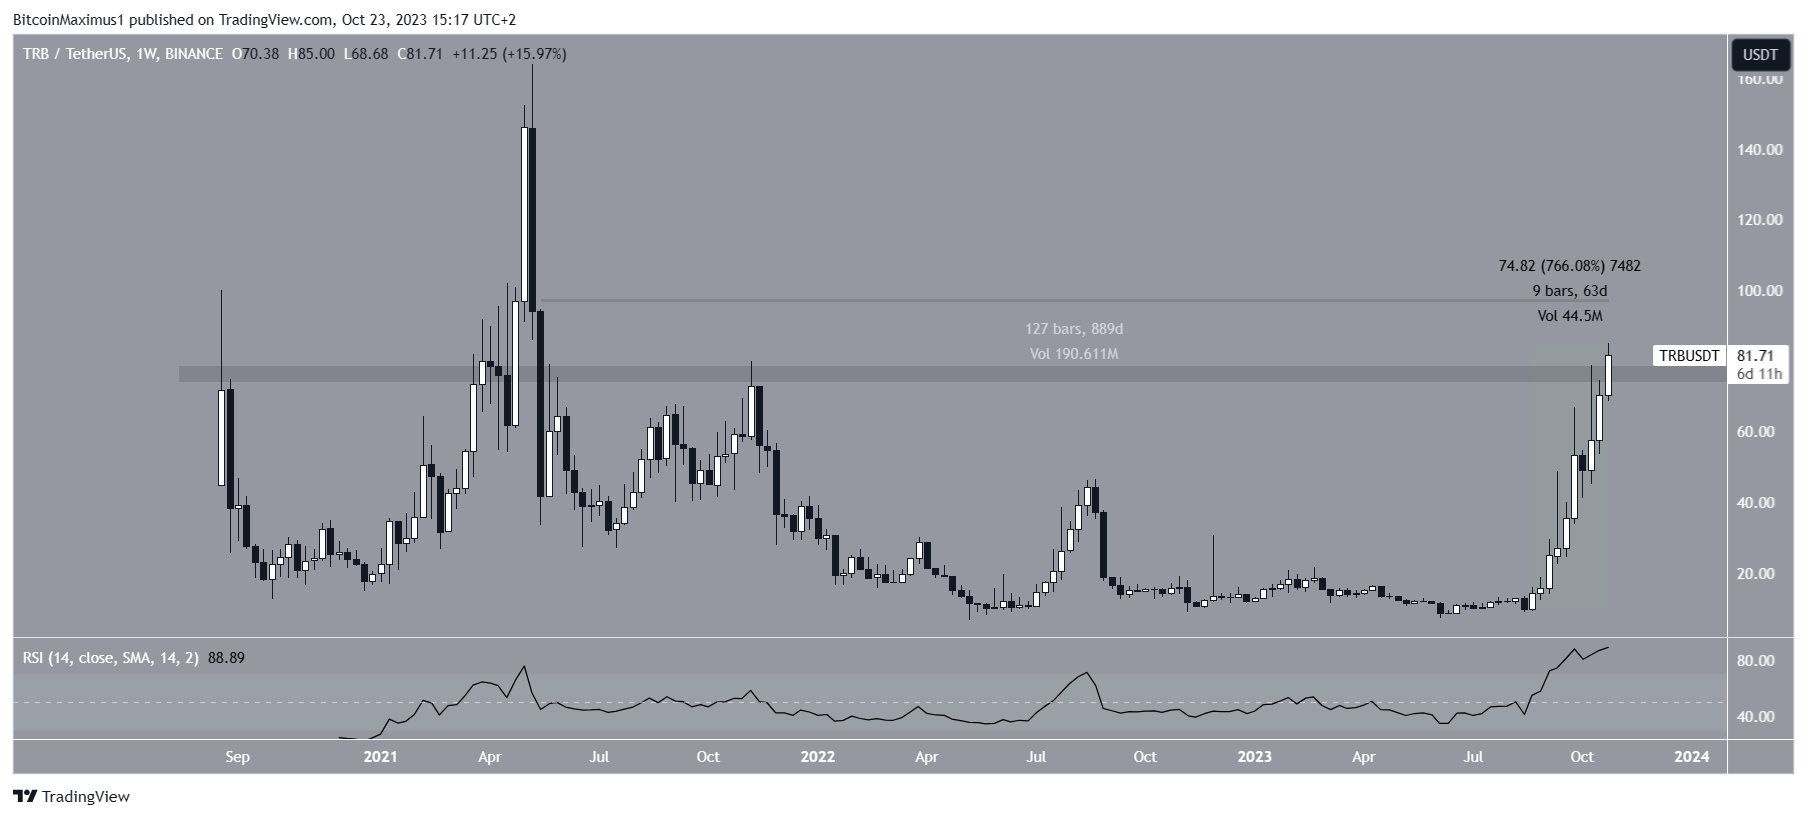
The Tellor (TRB) price has increased by more than 700% since its yearly low on August 17.
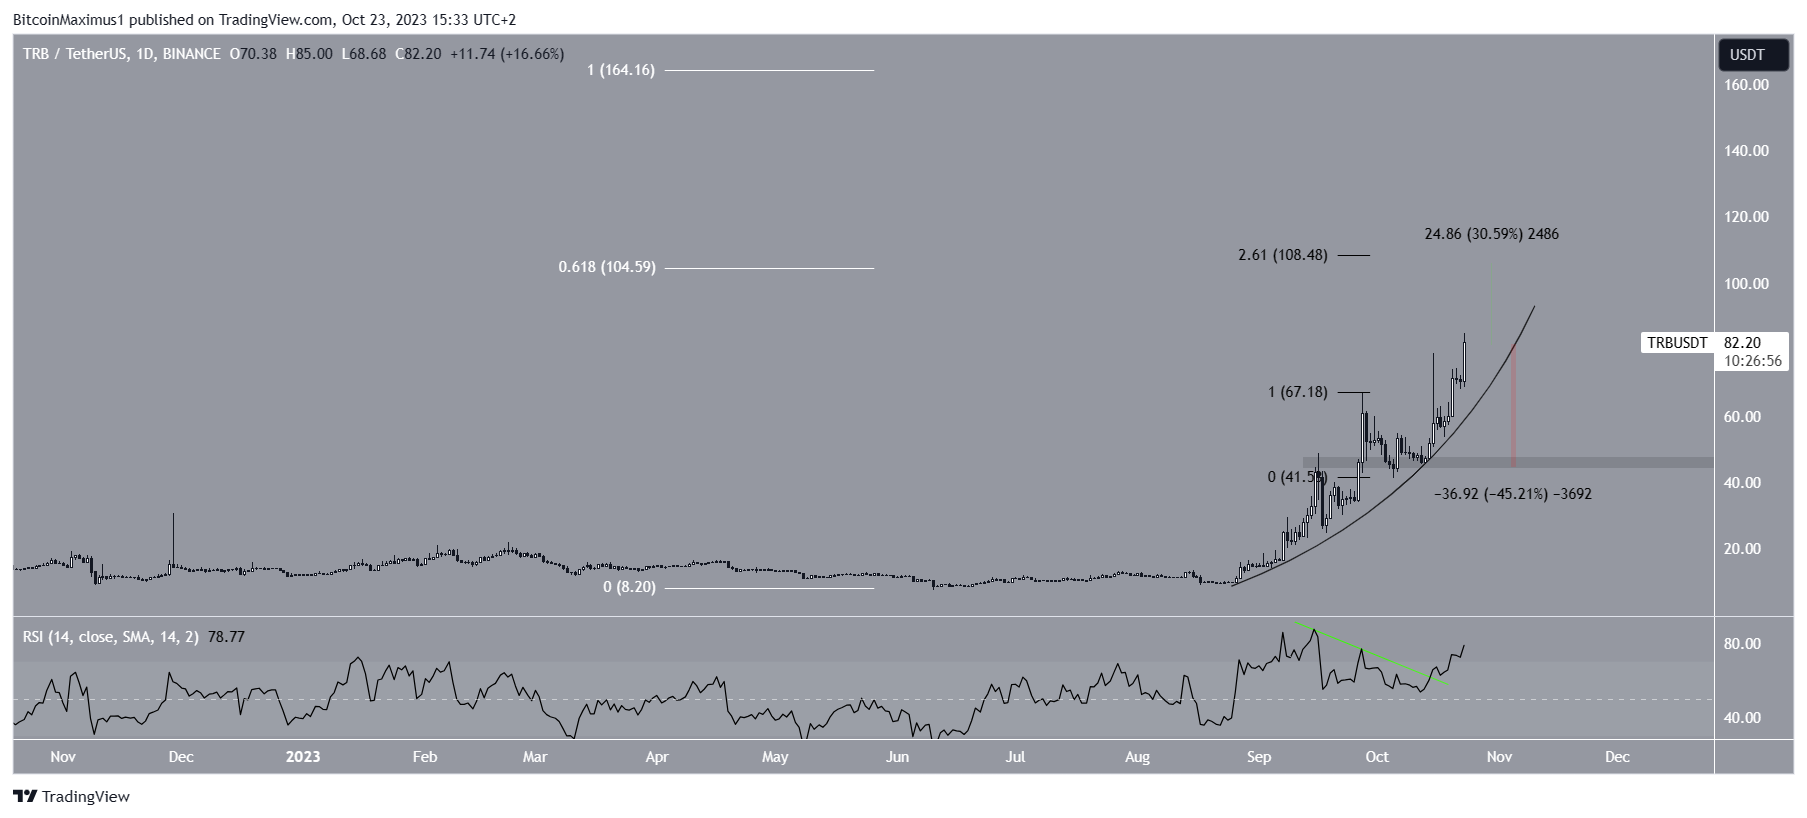
The increase has followed a parabolic ascending support line. How long will TRB maintain its momentum?
Tellor Reaches Yearly High
The TRB price has increased quickly since the end of August. In 63 days, the price has increased by 760%, culminating with a new yearly high of $85 today.
The altcoin reclaimed the $80 horizontal resistance area during the increase, which had been in place since May 2021. Today’s high is the highest price in nearly 900 days.
An interesting development throughout the increase has been the whale activity.
Read More: 9 Best Crypto Demo Accounts For Trading
On October 20, a group of whale wallets withdrew $9.50 million from centralized exchanges. Today, two other wallets withdrew nearly $2 million worth of TRB from the OKX and Binance exchanges.
Such massive withdrawals from centralized exchanges could catalyze a supply shock.

The weekly Relative Strength Index (RSI) provides a bullish outlook. When evaluating market conditions, traders use the RSI as a momentum indicator to determine whether a market is overbought or oversold and whether to accumulate or sell an asset.
If the RSI reading is above 50 and the trend is upward, bulls still have an advantage, but if the reading is below 50, the opposite is true.
The RSI is above 50 and increasing, both signs of a bullish trend. However, it is worth mentioning that the indicator is deep into overbought territory and has reached an all-time high of 90.
TRB Price Prediction: How Long Will Increase Continue?
The technical analysis from the daily timeframe shows that the increase since the end of August has been parabolic. While this is unsustainable in the long run, the increase can continue if the parabolic ascending support line is intact.
If the line stays intact, there is a confluence of resistances between $104.50 and $108.50.
The resistances are created by the 0.618 Fib retracement level of the entire decrease since the all-time high (white) and the 2.61 external Fib of the most recent drop (black).
Therefore, they will likely act as a potential top if the Tellor price gets there. The area is 30% above the current price.
The daily RSI supports the continuation of the upward movement. The indicator broke out from its bearish divergence trendline (green) and is increasing.

Despite this bullish TRB price prediction, a daily close below the parabolic ascending support trendline can lead to a 45% drop to the closest support at $45.
For BeInCrypto’s latest crypto market analysis, click here.
Disclaimer
In line with the Trust Project guidelines, this price analysis article is for informational purposes only and should not be considered financial or investment advice. BeInCrypto is committed to accurate, unbiased reporting, but market conditions are subject to change without notice. Always conduct your own research and consult with a professional before making any financial decisions. Please note that our Terms and Conditions, Privacy Policy, and Disclaimers have been updated.


