


Tellor (TRB) has been one of the best-performing cryptocurrencies since September. The price has increased by 235% so far, culminating with a new yearly high of $53 on September 27.
Tellor broke out from a symmetrical triangle during the upward movement, accelerating its increase on September 27.
Tellor Reaches New Yearly High
The TRB price has increased at an accelerated rate since the beginning of September. During a span of 26 days, the price has increased by 235%.
The increase culminated with a high of $53 on September 27. This was the highest price since November 2021.
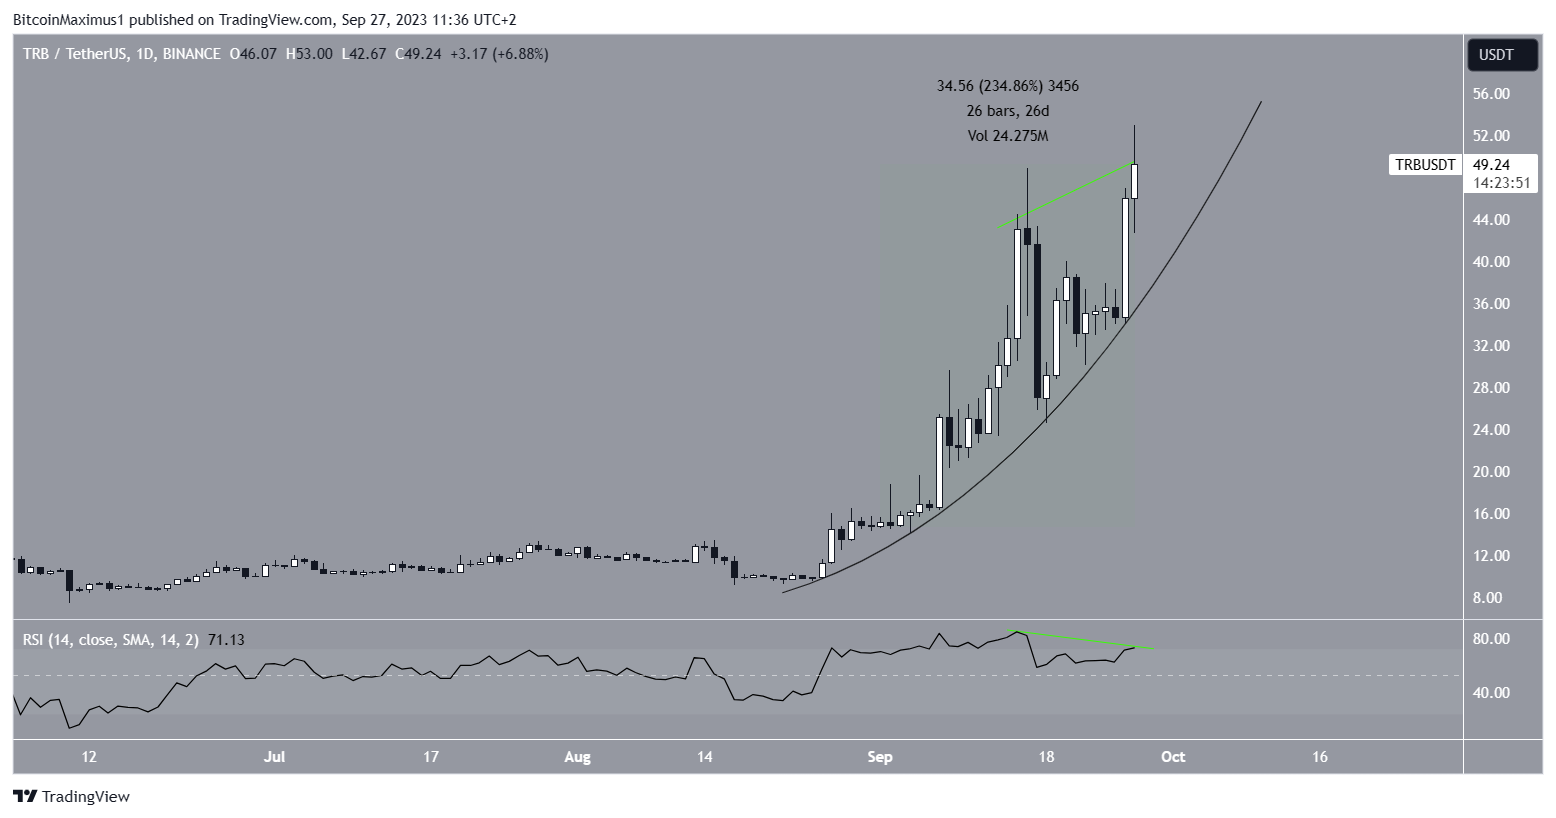
The entire increase has been contained inside a parabolic ascending support trendline. While such trendlines are unsustainable in the long run, they can support an upward trend if the price does not close below it.
The daily RSI suggests a local top is close. With the RSI as a momentum indicator, traders can determine whether a market is overbought or oversold and decide whether to accumulate or sell an asset.
Bulls have an advantage if the RSI reading is above 50 and the trend is upward. The opposite is true if the reading is below 50.
The indicator is above 50 and increasing, which is a sign of a bullish trend. However, a significant bearish divergence has developed over the past two weeks (green line).
A bullish divergence occurs when a momentum decrease accompanies a price increase. It is a sign that is associated with local tops.
TRB Price Prediction: Wave Count Predicts Local Top
Technical analysts rely on the Elliott Wave (EW) theory to identify recurring long-term price patterns and understand investor psychology, ultimately aiding in their ability to predict the direction of a market trend.
According to EW theory, the price is in the fifth and final wave of an upward movement. The most notable part of this formation is the presence of a symmetrical triangle in wave four.
This is the most common pattern in this wave and adds legitimacy to the possibility that this is the correct count.
Read More: 9 Best Crypto Demo Accounts For Trading
TRB can reach a local top between $58-$60 in that case. The top is found by the 1.61 external Fib retracement of wave four (black) and the 0.618 length of waves one and three (white). It is 20% above the current price.
The principle behind Fibonacci retracement levels suggests that after a considerable price movement in one direction, the price will retrace or return partially to a previous price level before continuing in its original direction.
These levels can be utilized to identify the highest point of potential future upward movements. If the wave extends, the next most likely area for a top will be between $72.50 and $76. Which is 50% above the current price.
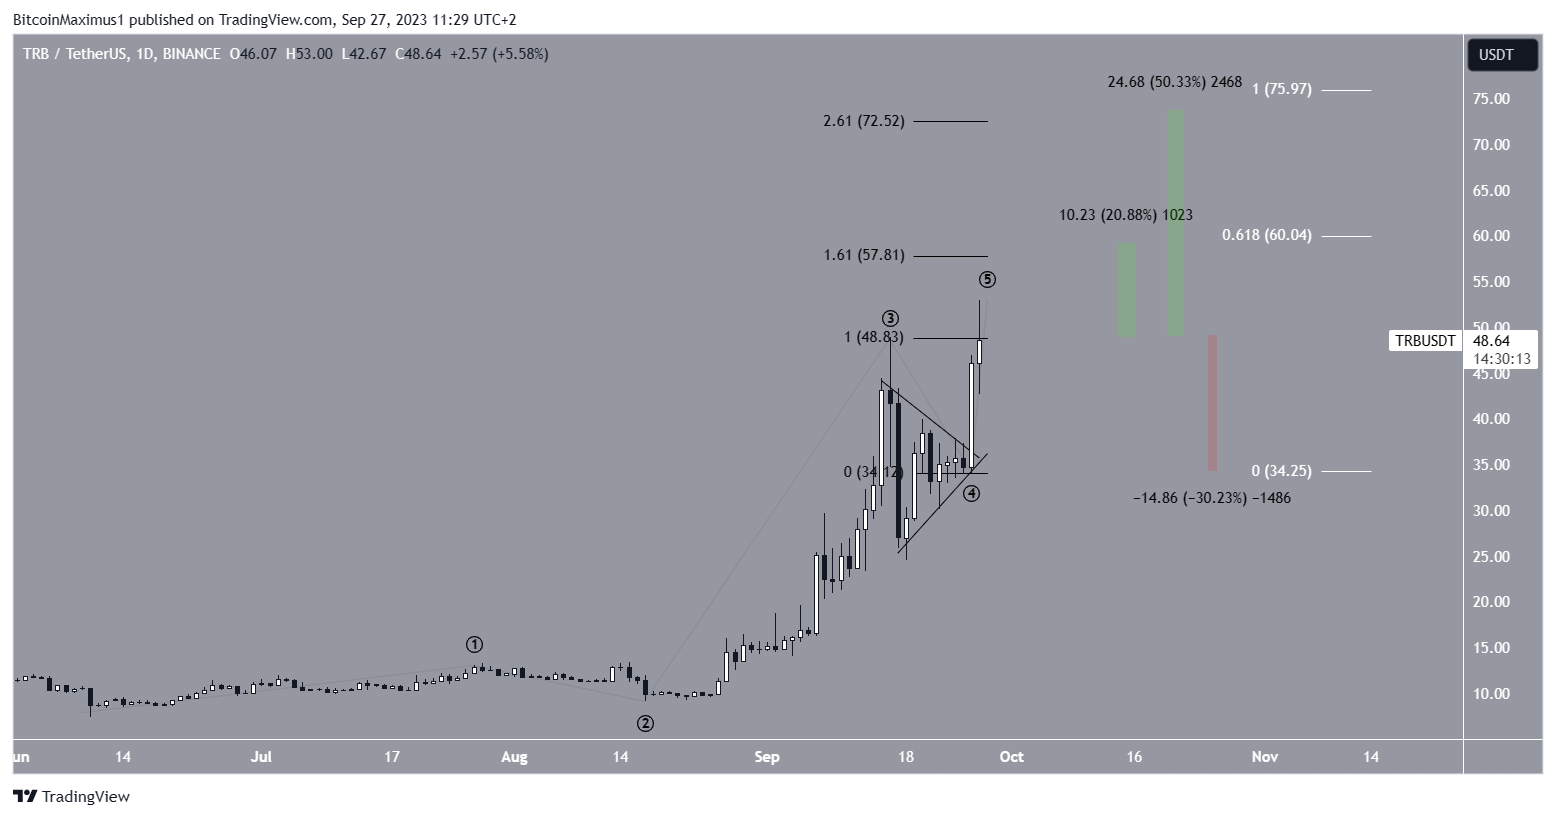
Despite this bullish TRB price prediction, a close below $45 on the daily chart will be a strong sign that the top is already in.
In that case, the TRB price can fall by 30% and reach the $35 support area.
For BeInCrypto’s latest crypto market analysis, click here.


