

Stellar’s (XLM) price trajectory has declined since reaching its highest point of the year on July 13. But, trading inside a short-term pattern could lead to a breakout.
Despite the drop, the weekly trend remains positive. Moreover, a breakout from the short-term symmetrical triangle will confirm the bullish trend.
Stellar Price Trades in the Middle of the Range
The weekly time frame technical analysis of XLM reveals several significant developments. The primary one is the breakout that occurred at the beginning of January, where XLM surpassed a descending resistance line that had been in place for 616 days.
Following this breakout, XLM established a higher low and confirmed the previous resistance line as a support level. This led to a fresh upward movement for XLM, which gained momentum in June.
Read More: 11 Best Crypto Portfolio Trackers in 2023
Despite successfully surpassing the $0.105 horizontal resistance region, XLM didn’t manage to reach the subsequent resistance at $0.23. Instead, its upward trajectory halted at $0.195, forming a notable long upper wick (red icon). These wicks are considered signs of selling pressure. Thus, downward movements usually precede them.
After reaching this high, XLM experienced a decline over the subsequent three weeks and is gradually nearing the support area at $0.105.

On the weekly chart, the Relative Strength Index (RSI) provides a mixed reading. The RSI is a tool that traders utilize to assess market momentum.
An RSI reading above 50 and an upward trend suggest that bulls still hold an advantageous position. Conversely, a reading below 50 implies the opposite. In the context of XLM, the RSI has declined but remains above 50, signaling an uncertain trend.
XLM Price Prediction: Is the Bottom In?
After evaluating the price movements of XLM using the Elliott Wave theory, a positive outlook emerges for its future price trajectory. However, a notable rebound is necessary at the present level for this projection to remain valid. The Elliott Wave theory, a tool employed by technical analysts to examine long-term price patterns and investor sentiment, is being utilized to make forecasts about market trends.
Considering the ongoing Elliott Wave analysis (white lines), the current position of XLM’s price is likely the end of the fourth wave within a five-wave upward sequence. This fourth wave has taken the form of a triangle pattern. This is the most commonly observed during this specific phase of the wave cycle.
Your crypto compass is here. Navigate with us: Stellar (XLM) Price Prediction
If this analysis holds true, it indicates that XLM’s price has potentially already reached a local low point (green icon) and is presently in the process of confirming its support line within the triangle pattern (white icon). Additionally, this suggests that XLM is nearing the conclusion of its consolidation phase.
As a result, it is anticipated that XLM will break out from the triangle pattern and undergo an ascent toward the subsequent long-term resistance level at $0.23. This projected increase is slightly over a 60% gain from the current price point.
Following the completion of the five-wave uptrend, a corrective phase might ensue. The 3.61 extension of wave one (white) also supports the target. Due to this confluence, it would be likely for the XLM price to reach a local top at this level.
To validate this positive scenario, it is imperative for XLM’s price to close above the resistance line of the triangle.
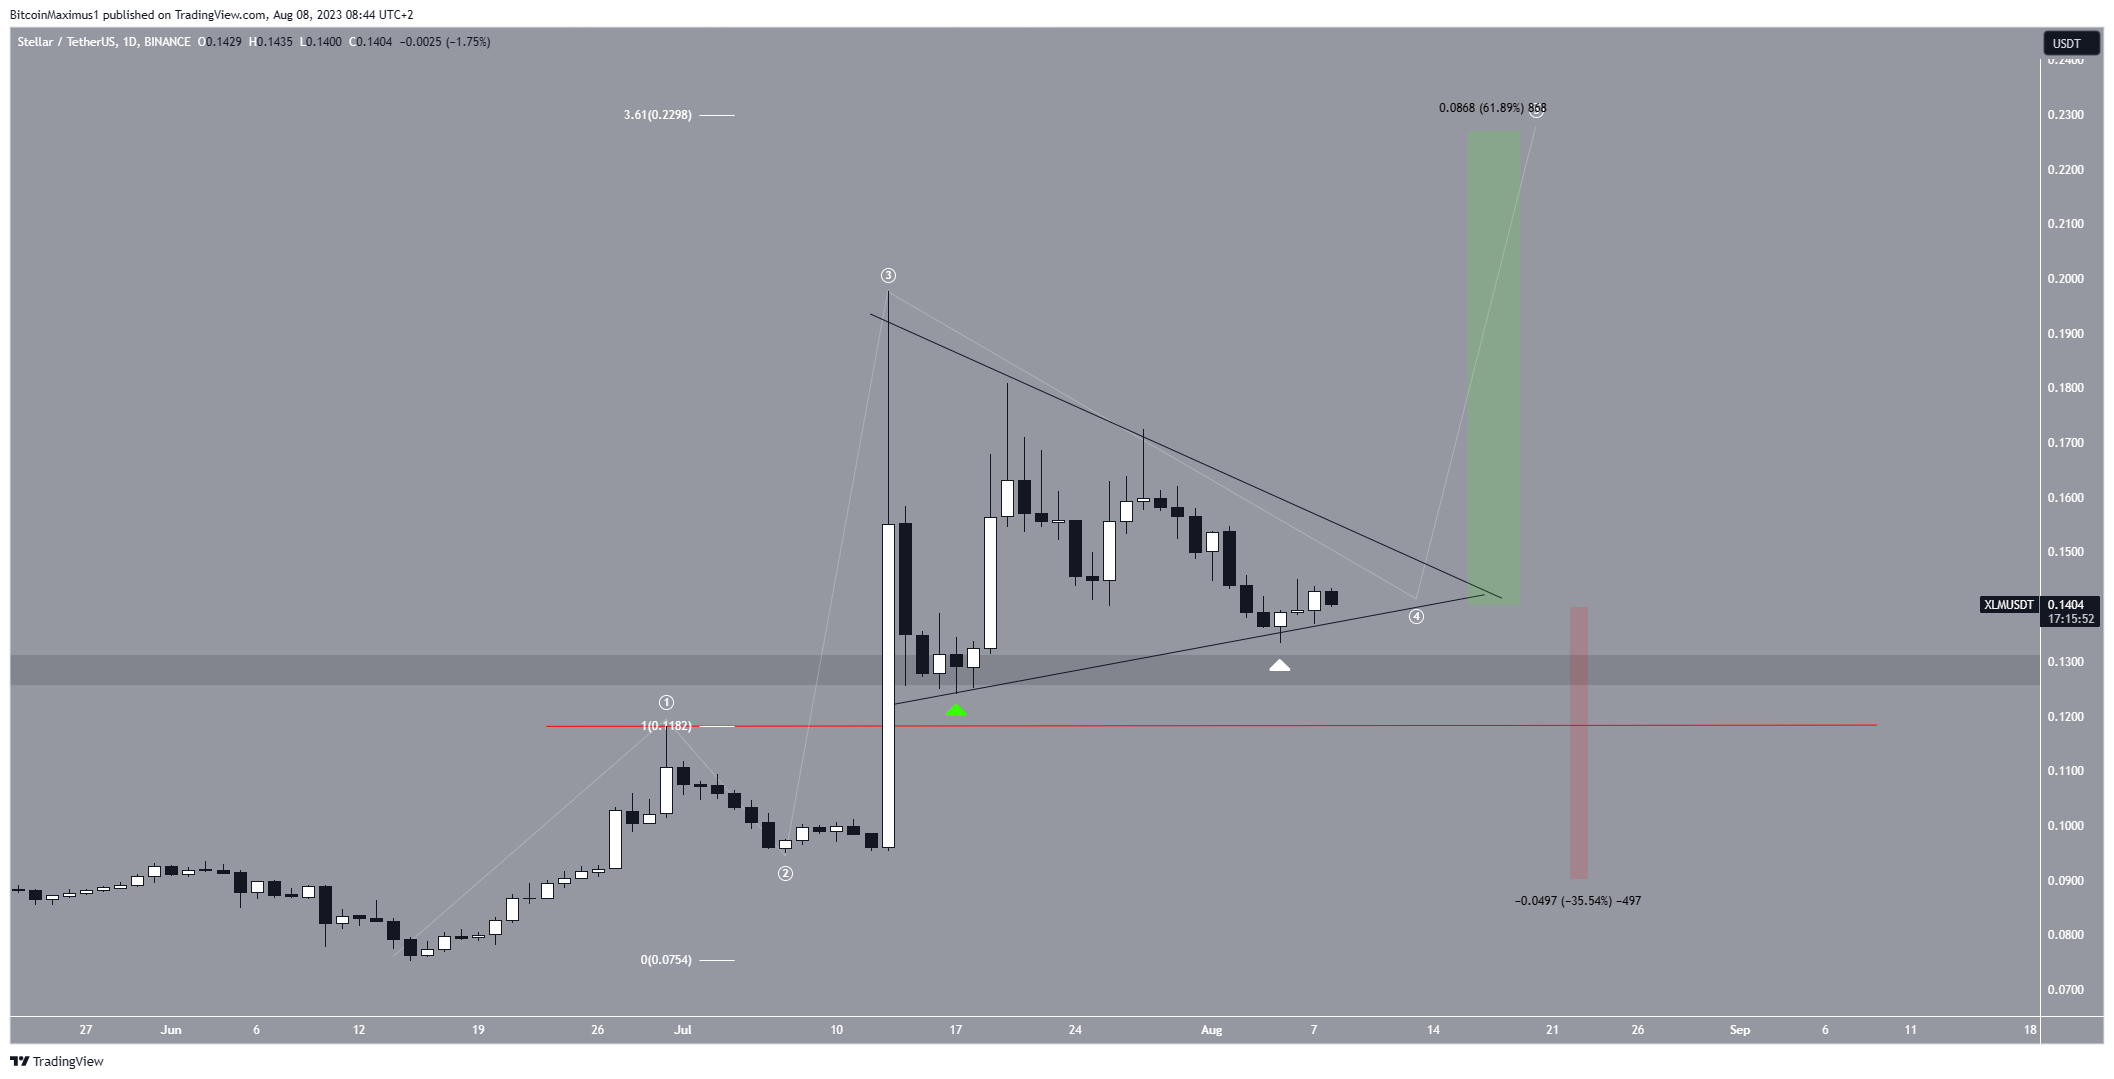
Nonetheless, despite this positive price prediction for XLM, a drop below the peak of wave one (red line) at $0.12 would indicate a shift toward a bearish trend.
In such a scenario, XLM’s price would probably experience a decline toward the next support level at $0.09. This would amount to a 35% decrease from the current price.
Read More: Best Cloud Mining Sites 2023: A Beginners Guide
For BeInCrypto’s latest crypto market analysis, click here.
Disclaimer
In line with the Trust Project guidelines, this price analysis article is for informational purposes only and should not be considered financial or investment advice. BeInCrypto is committed to accurate, unbiased reporting, but market conditions are subject to change without notice. Always conduct your own research and consult with a professional before making any financial decisions. Please note that our Terms and Conditions, Privacy Policy, and Disclaimers have been updated.
