


BeInCrypto looks at five altcoins that increased the most in this week’s crypto market, specifically from October 13 to 20.
The term altcoin refers to cryptocurrencies other than Bitcoin (BTC). These bullish altcoins have stolen the crypto news and cryptocurrency market spotlight this week as the biggest gainers:
- Bitcoin SV (BSV) price increased by 61.07%
- Stacks (STX) price increased by 32.97%
- MX TOKEN (MX) price increased by 27.70%
- Solana (SOL) price increased by 23.84%
- Injective (INJ) price increased by 15.91%
BSV Price Leads Crypto Gainers
The BSV price has increased alongside an ascending support trendline since June. The line has been validated numerous times, most recently on October 9 (green icon).
The price accelerated its rate of increase on October 19. This led to a high of $55.88 on October 20, made inside the $56 horizontal resistance area.
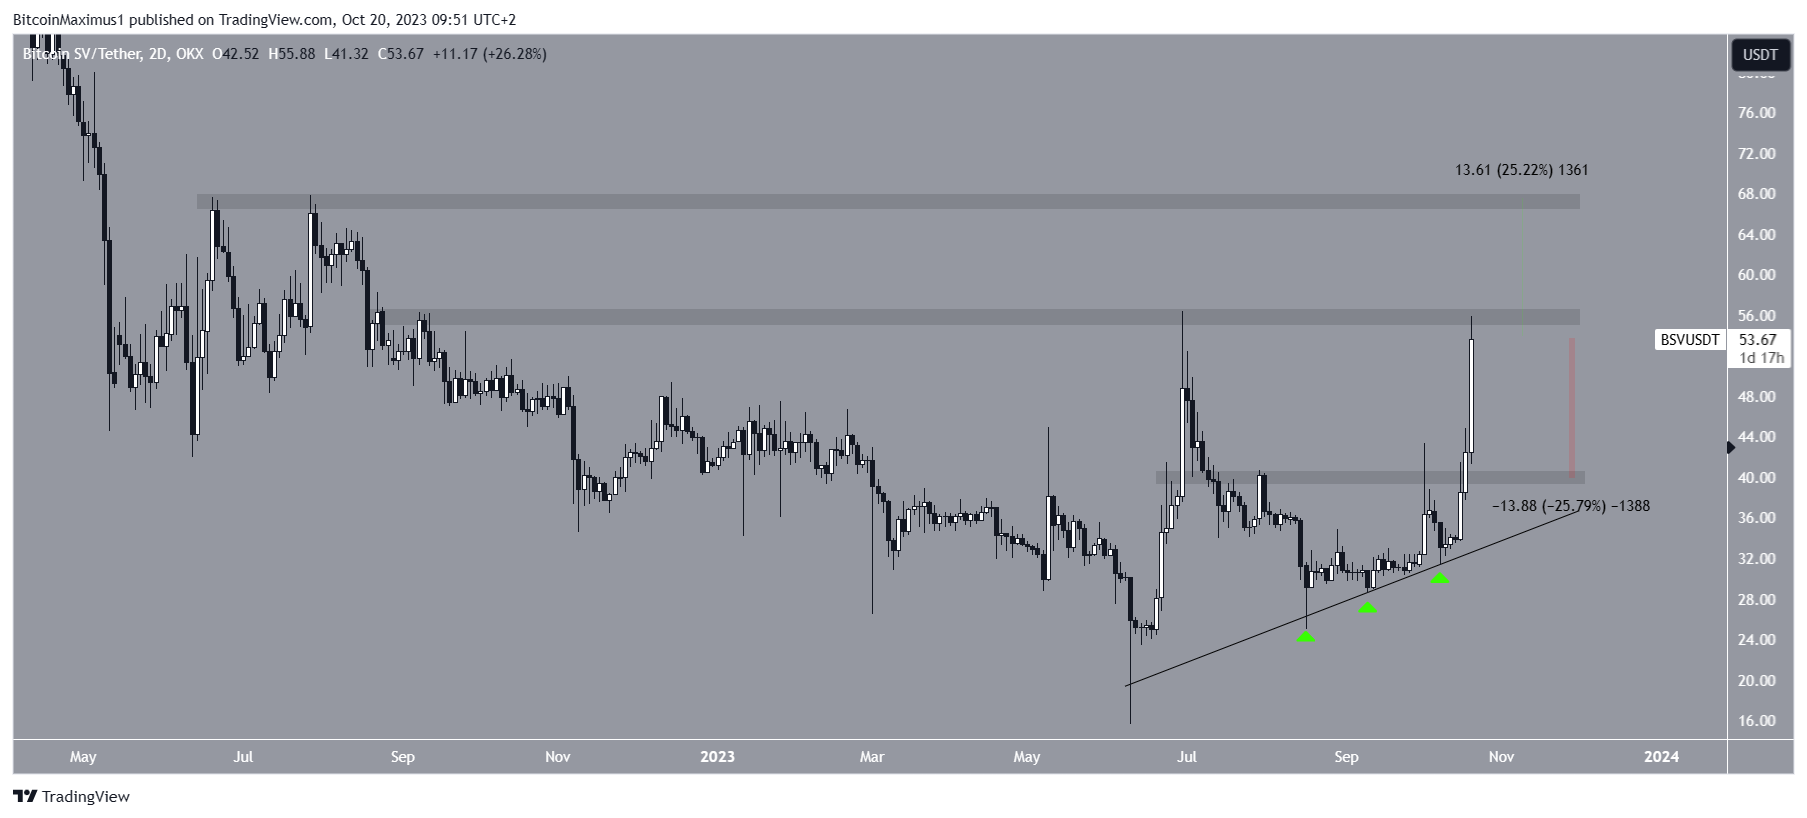
If the price breaks out, it can increase by 25% and reach the next resistance at $66. However, if it gets rejected, it can fall by 26% and drop to the $40 horizontal support area.
STX Price Breaks Out from Multiple Resistances
The STX price broke out from a descending resistance trendline (white) at the end of September. The initial increase was gradual and contained inside an ascending parallel channel (black).
However, STX broke out from the channel on October 20, creating a large bullish candlestick.
If the increase continues, the price can increase by another 35% and reach the $0.88 horizontal resistance area.
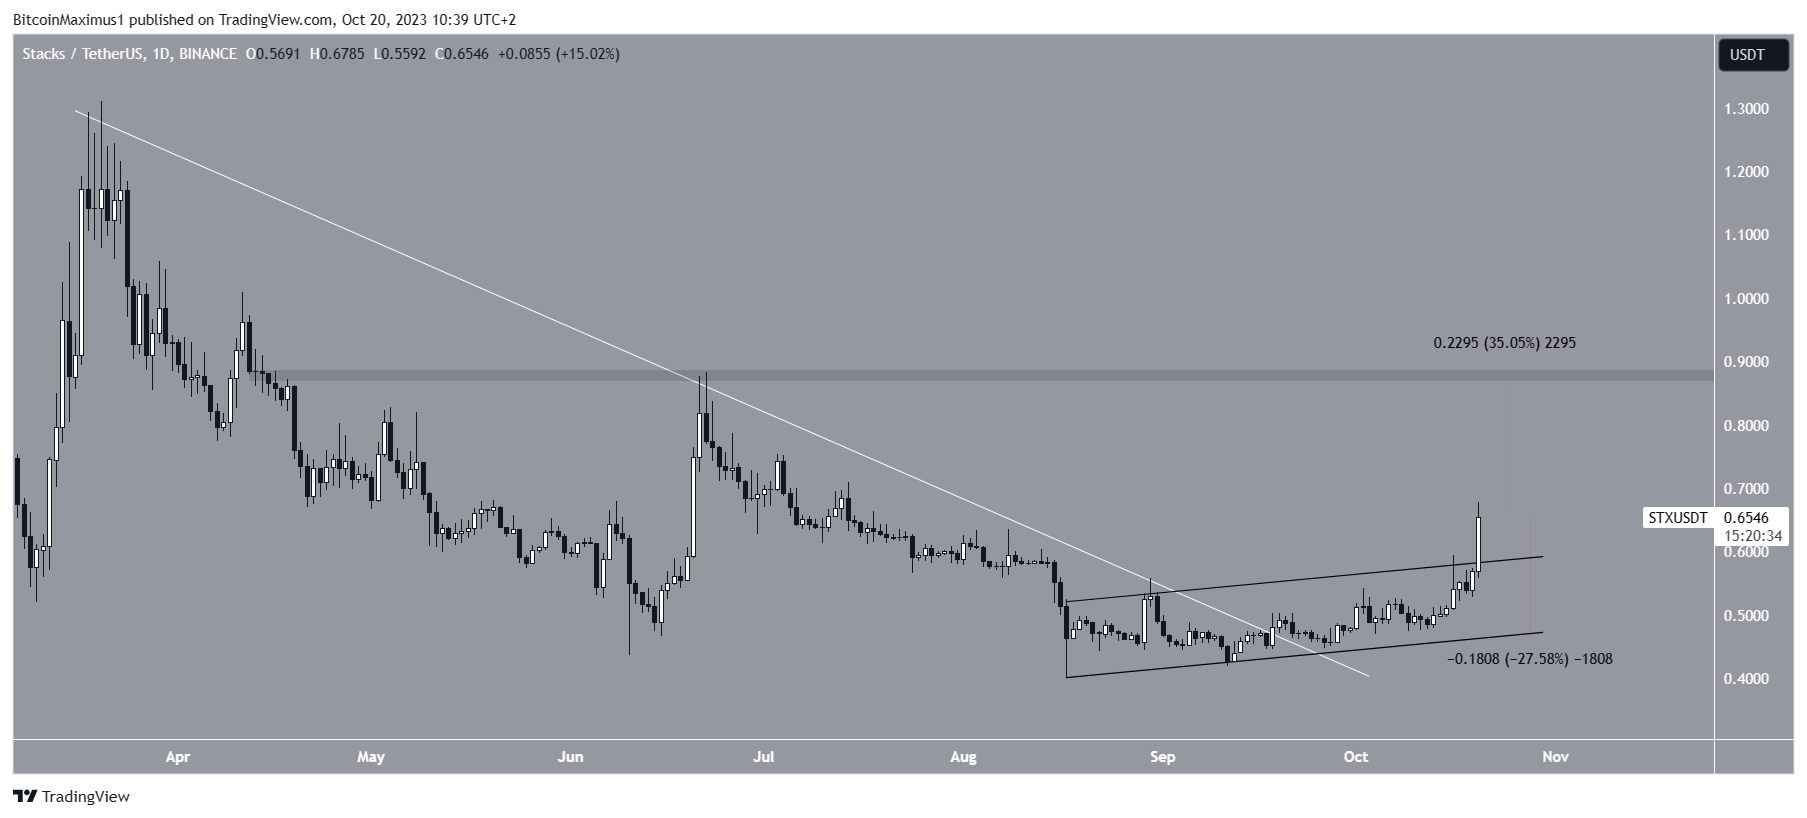
However, if STX cannot sustain its increase, it could fall by 28% and reach the channel’s support line at $0.50.
MX Token Completes Correction
Technical analysts employ the Elliott Wave theory to identify recurring long-term price patterns and investor psychology, which helps them determine the direction of a trend.
The most likely wave count for the MX token suggests that the price has completed an A-B-C corrective structure (white).
If so, it has now begun a new upward movement. The next target for this increase is $4.40, 56% above the current price.
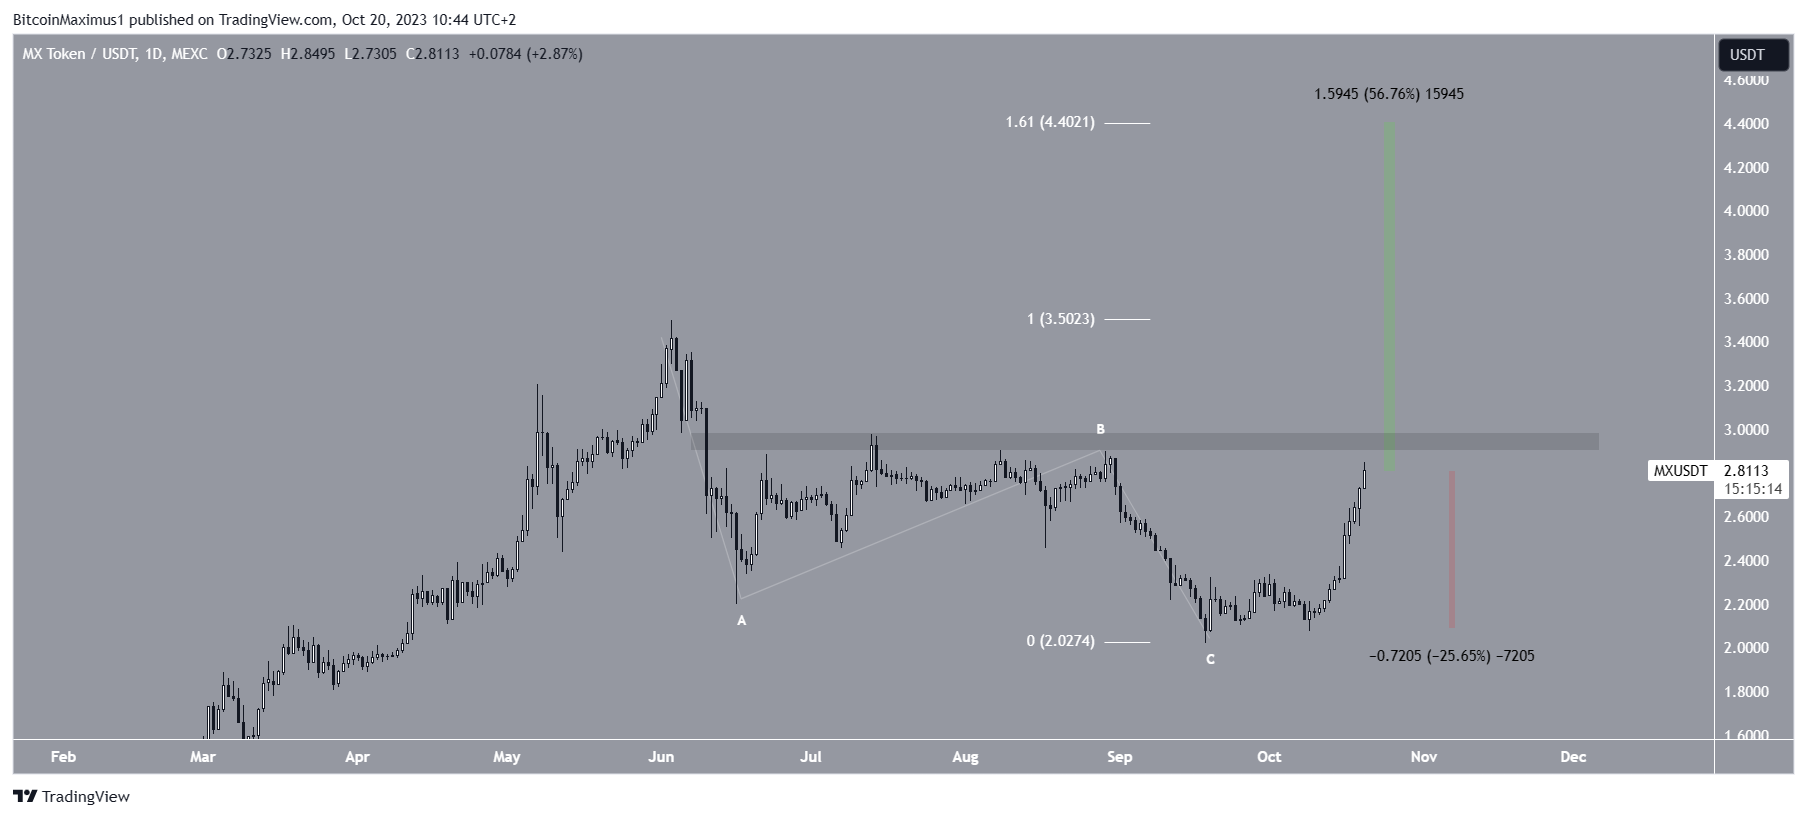
Despite this bullish MX price prediction, a rejection from the $2.90 resistance area will likely cause a 25% drop to the closest support at $2.10.
Looking For a New Exchange? These Are the Best Crypto Sign-Up Bonuses in 2023
Solana Breaks Out from Bullish Pattern
Since March, the SOL price has traded inside an inverse head and shoulders pattern. The inverse head and shoulders is considered a bullish pattern, meaning an eventual breakout from it is the most likely future price scenario.
Currently, SOL is in the process of breaking out from the pattern’s neckline.
A breakout that travels the entire pattern’s height will take SOL to $40, a 50% increase from the current price.
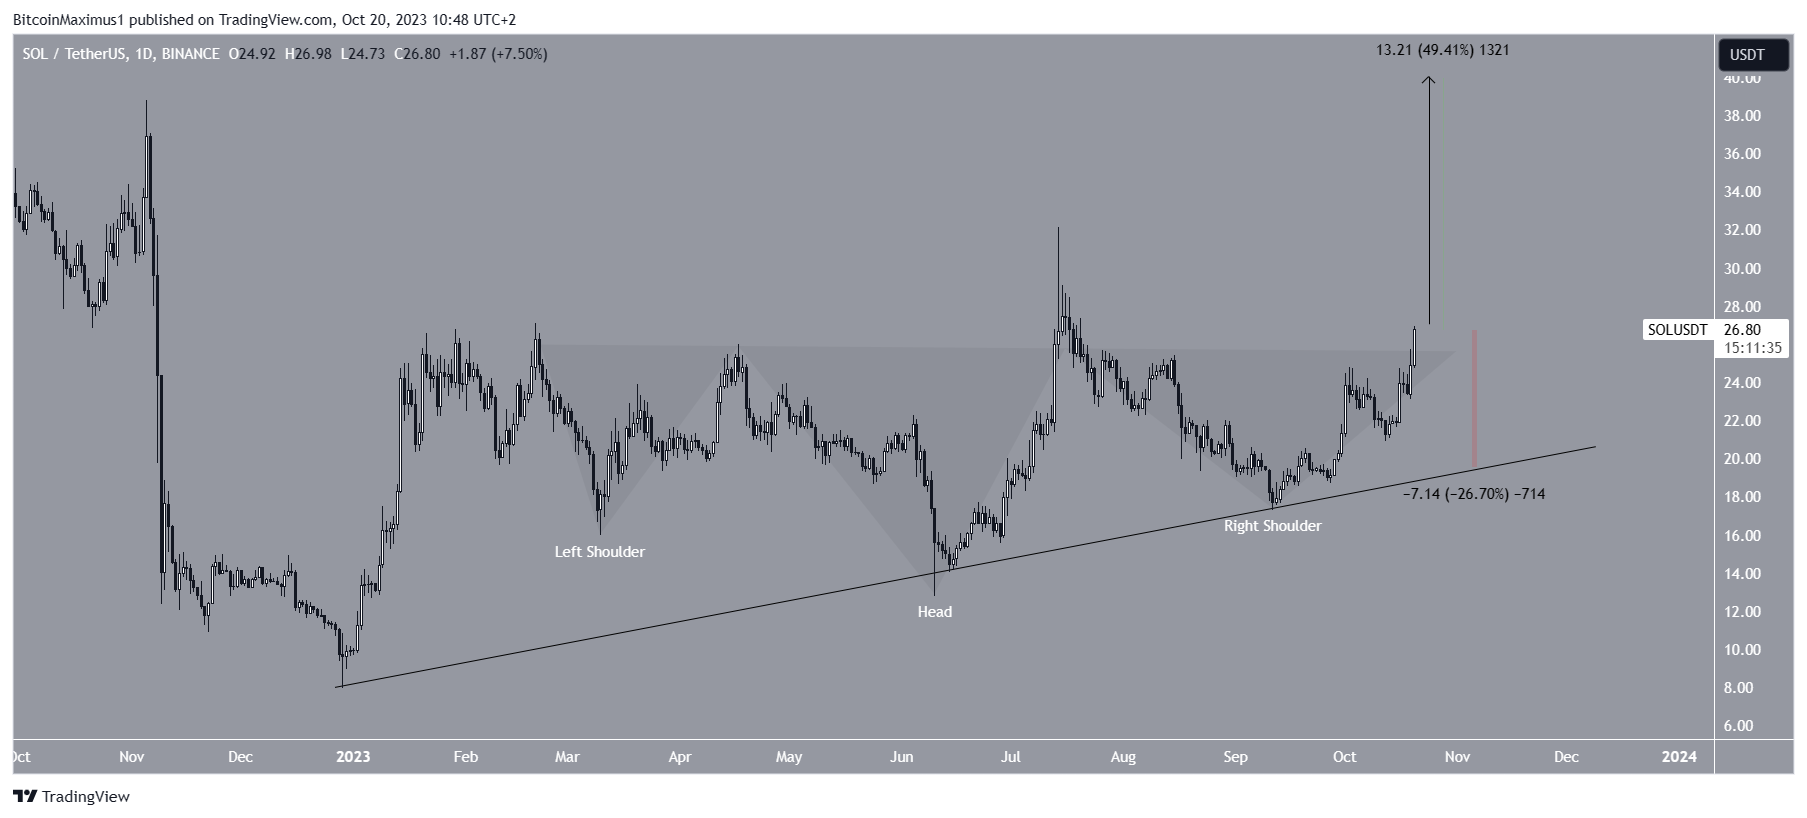
Despite this bullish SOL price prediction, a close below the neckline can lead to a 27% drop to the ascending support trendline at $21.
Injective Concludes Crypto Gainers
The INJ price has traded inside a long-term symmetrical triangle since April.
The wave count states the triangle is likely part of wave four in a five-wave upward movement.
If the count is correct, INJ will break out from the triangle and reach a high of $25, close to the all-time high of $25.60. This would be an increase of 200% from the current price.
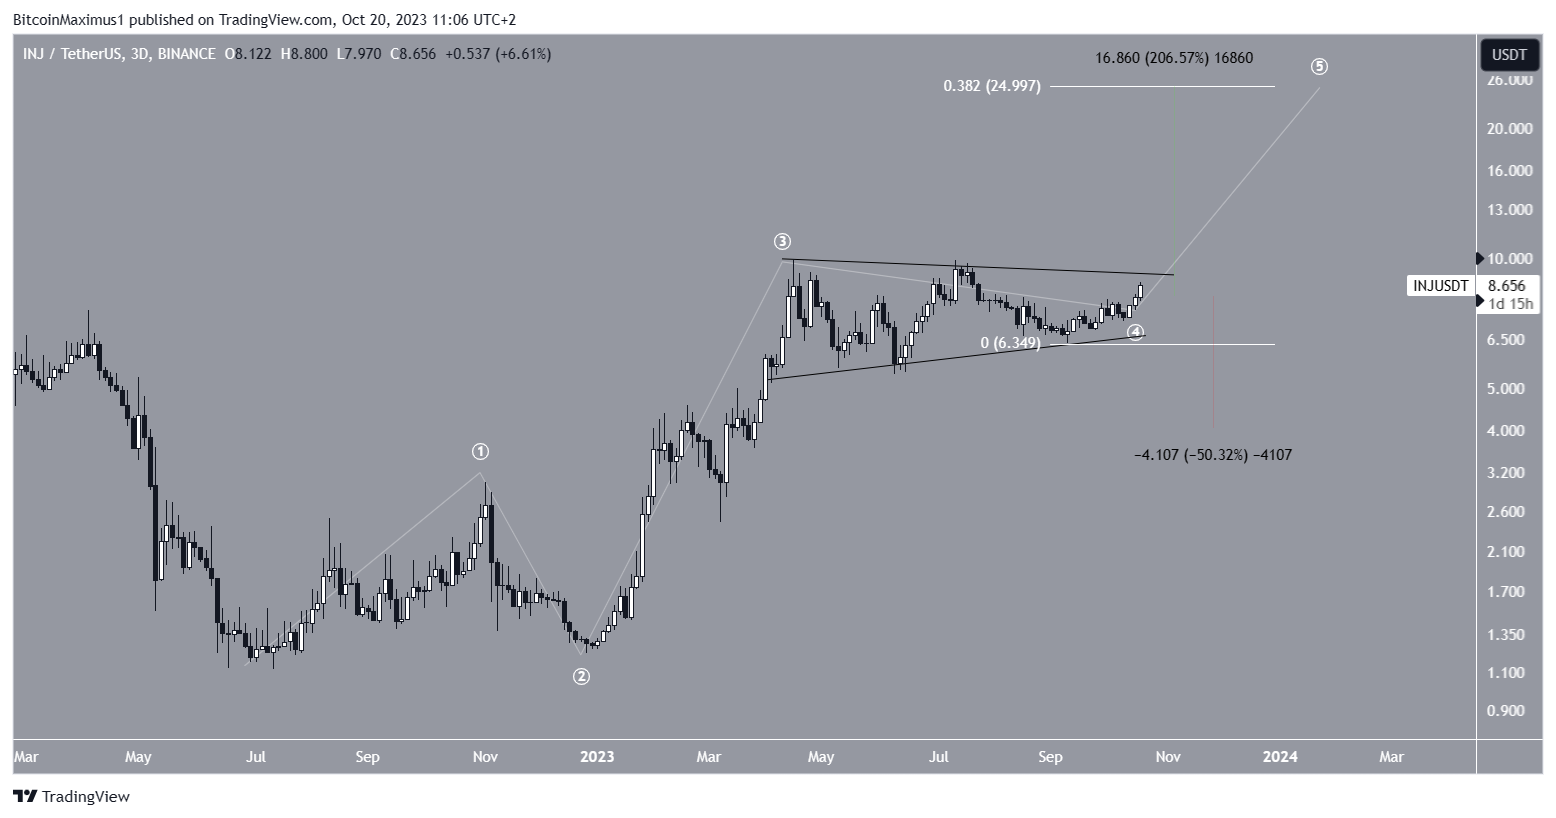
Despite this bullish INJ price prediction, a breakdown from the triangle can cause a 50% drop to the closest support at $4.
For BeInCrypto‘s latest crypto market analysis, click here.


