


Stellar’s (XLM) price is approaching the $0.105 area, which previously provided resistance and is now expected to provide support.
The price has broken out from a shorter-term diagonal resistance line, which could trigger a significant increase.
Stellar Almost Returns to Long-Term Support
The technical analysis from the weekly time frame provides several bullish signs. Firstly, it shows that the XLM price broke out from a 616-day resistance line in January 2023. Since the line had been in place for such a long period of time, the breakout from it is a sign that the previous correction is complete and that XLM has begun a new bullish trend.
After creating a higher low in June 2023, the XLM price initiated a sharp upward movement, leading to a new yearly high of $0.195 in July 2023. The breakout from such a long-term structure indicates the previous movement is complete. Therefore, the breakout was expected to catalyze a long-term bullish trend reversal.
After creating a higher low in June, Stellar lumens began a sharp upward movement, leading to a new yearly high of $0.195. However, the price has fallen since (red icon).
The weekly RSI supports the ongoing breakout. With the RSI as a momentum indicator, traders can determine whether a market is overbought or oversold and decide whether to accumulate or sell an asset.
Bulls have an advantage if the RSI reading is above 50 and the trend is upward, but if the reading is below 50, the opposite is true. The indicator moved above 50 in June (green circle), just before the price broke out from the $0.105 horizontal resistance area.
This is a sign that supports the legitimacy of the breakout. While the indicator has fallen since, it is still above 50, indicating the trend is bullish.
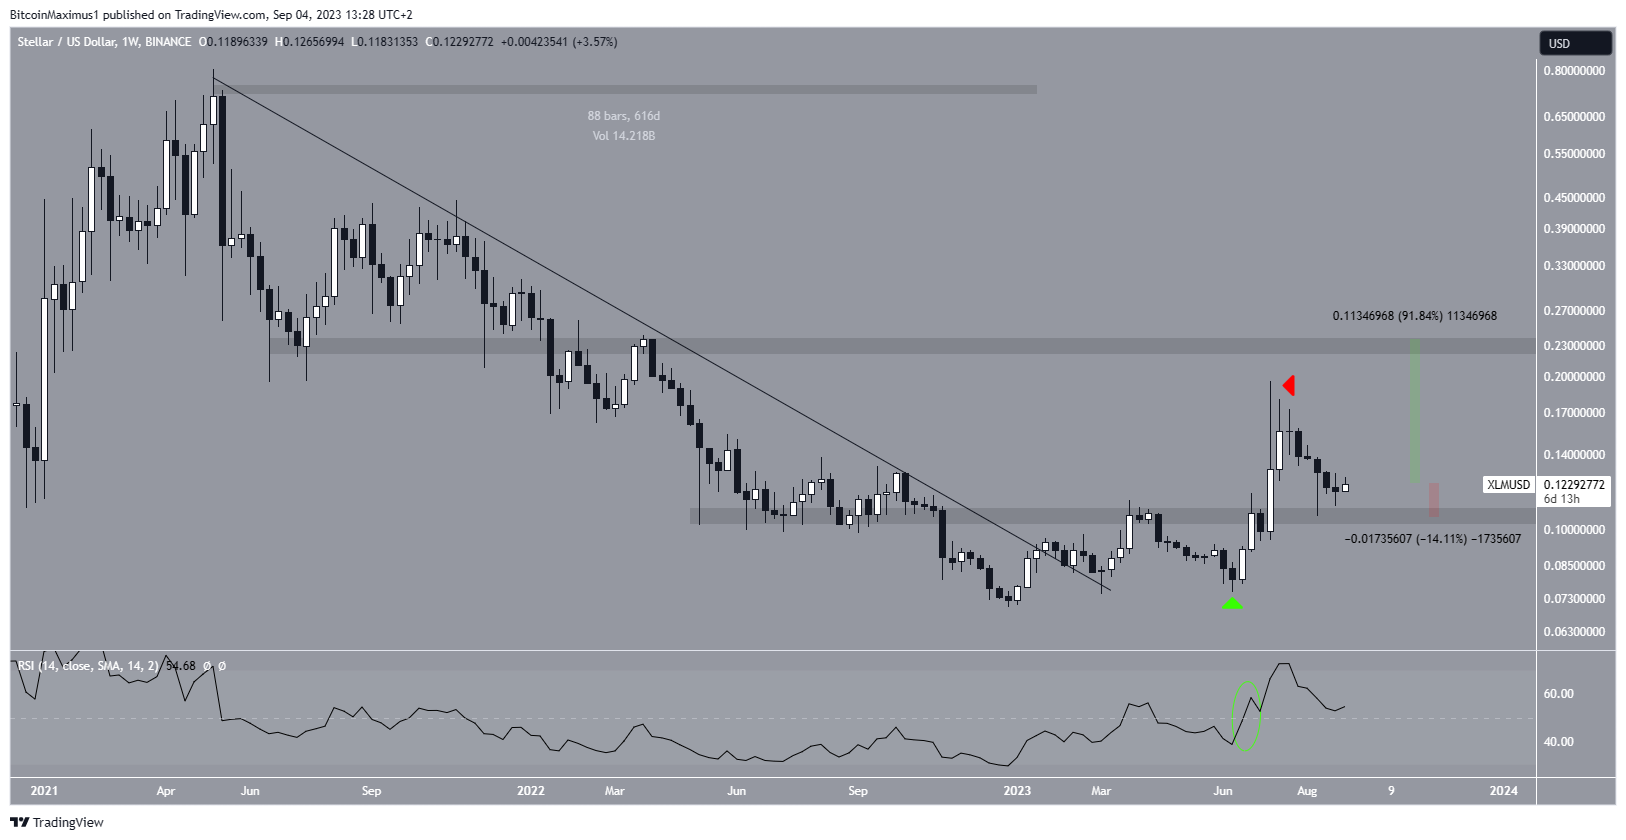
The closest resistance area at $0.23 is 90% above the current price, while the closest support at $0.105 is only 15% below the current price. As a result, the potential for the downside seems more limited than that for the upside.
XLM Price Prediction: Will Breakout Catalyze Price Surge?
The daily timeframe analysis presents a bullish outlook for XLM. The price has increased since August 17, when it created a long lower wick and validated the minor support area at $0.110.
On September 3, the price broke out from a descending resistance line that had been in place for 52 days. It is possible that this will catalyze a significant increase.
However, XLM still trades below the $0.130 horizontal area, which is providing resistance. The price has to reclaim this area to increase by another 32% and reach the $0.160 resistance.
It is possible that the increase occurred as a result of a surprise announcement by the Stellar Foundation. In a tweet, Stellar stated that “something cool” is dropping on September 12. However, they elected to keep the contents of the surprise a mystery.
The daily RSI supports the validity of the breakout. The RSI broke out from its own resistance line (green) on August 18, preceding the price breakout. The indicator has now nearly moved above 50. An RSI increase above 50 and a price increase above $0.130 will confirm that the trend is bullish.
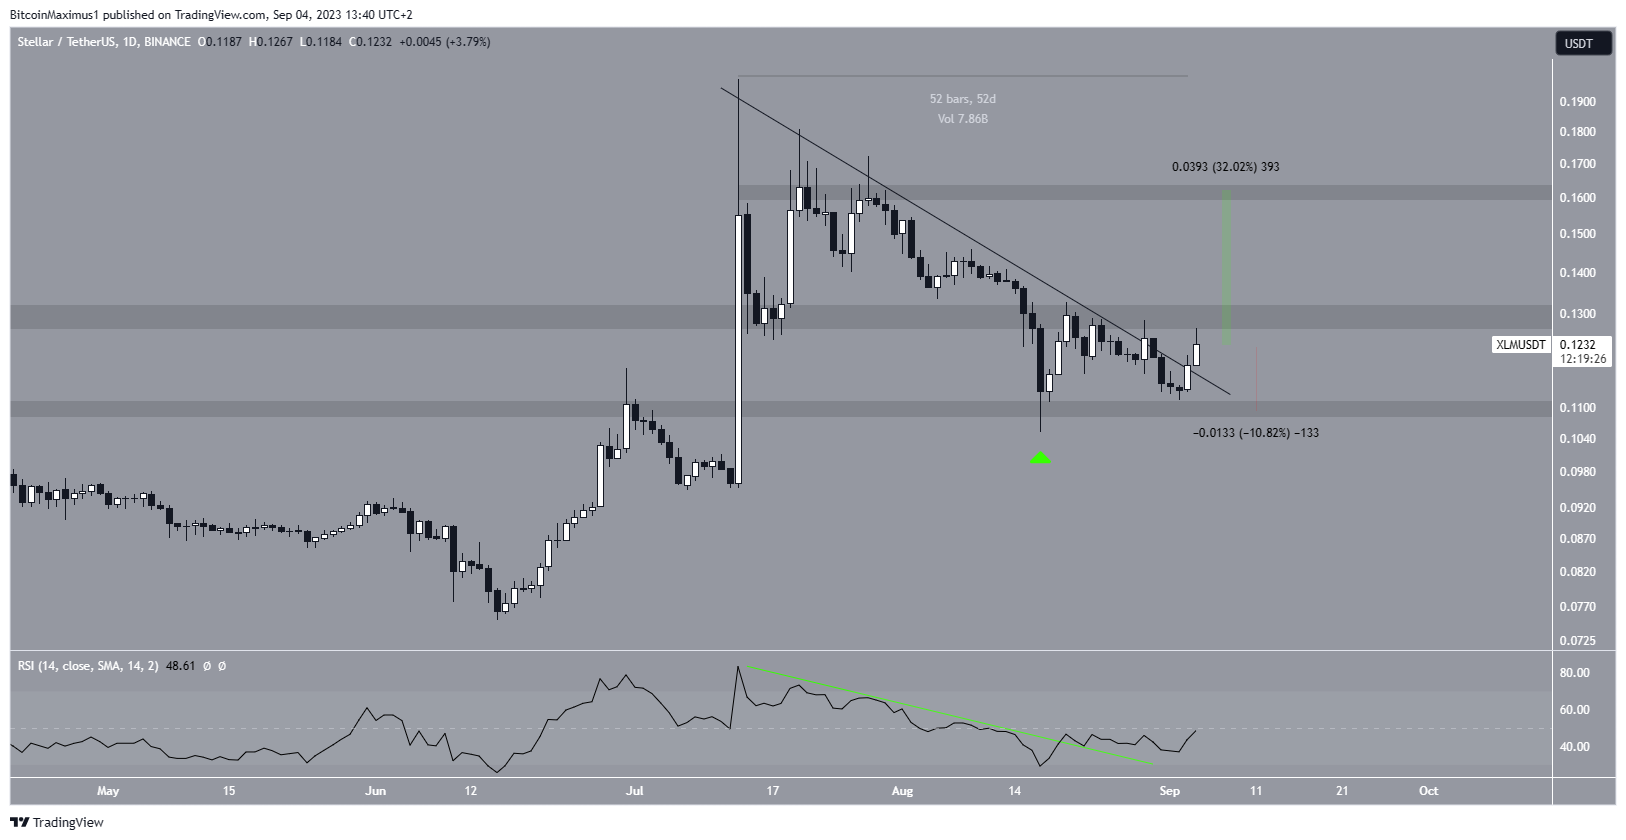
Despite this bullish XLM price prediction, failure to close above the $0.130 area can cause an immediate downswing. However, due to the presence of minor and long-term support at $0.110 and $0.105, respectively, this would likely cause a small drop of 11 to 15%.
Interested in AI Trading? 9 Best AI Crypto Trading Bots to Maximize Your Profits
For BeInCrypto’s latest crypto market analysis, click here.


