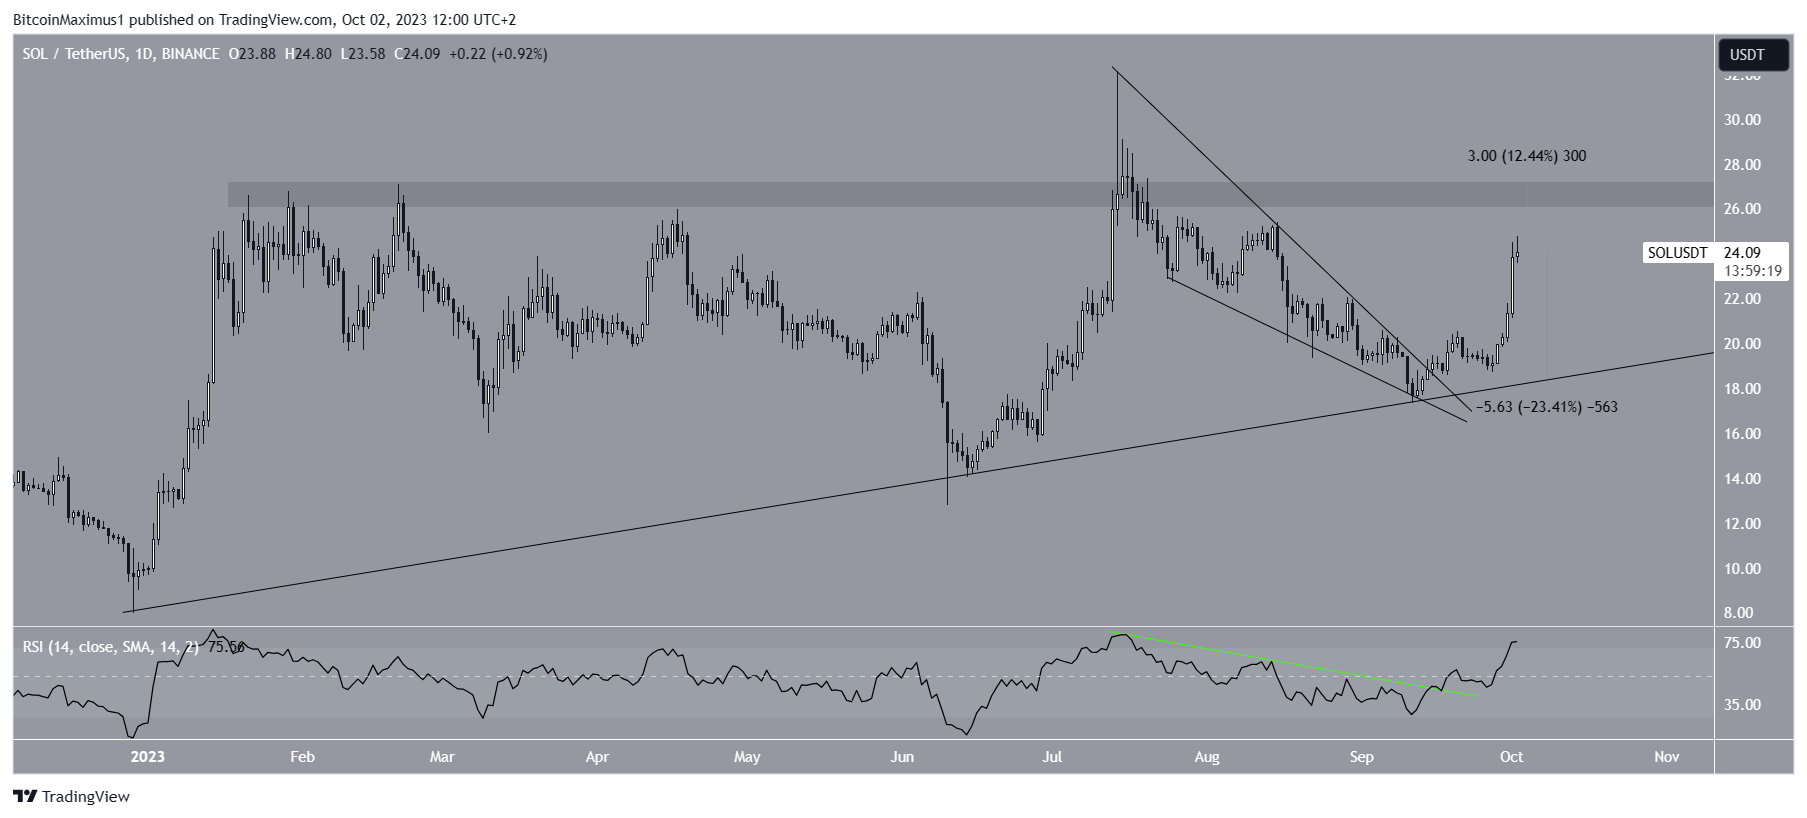
The Solana (SOL) Total Value Locked (TVL) reached a new yearly high last week. The price accelerated its rate of increase on September 27, culminating with a high of $24.80 today.
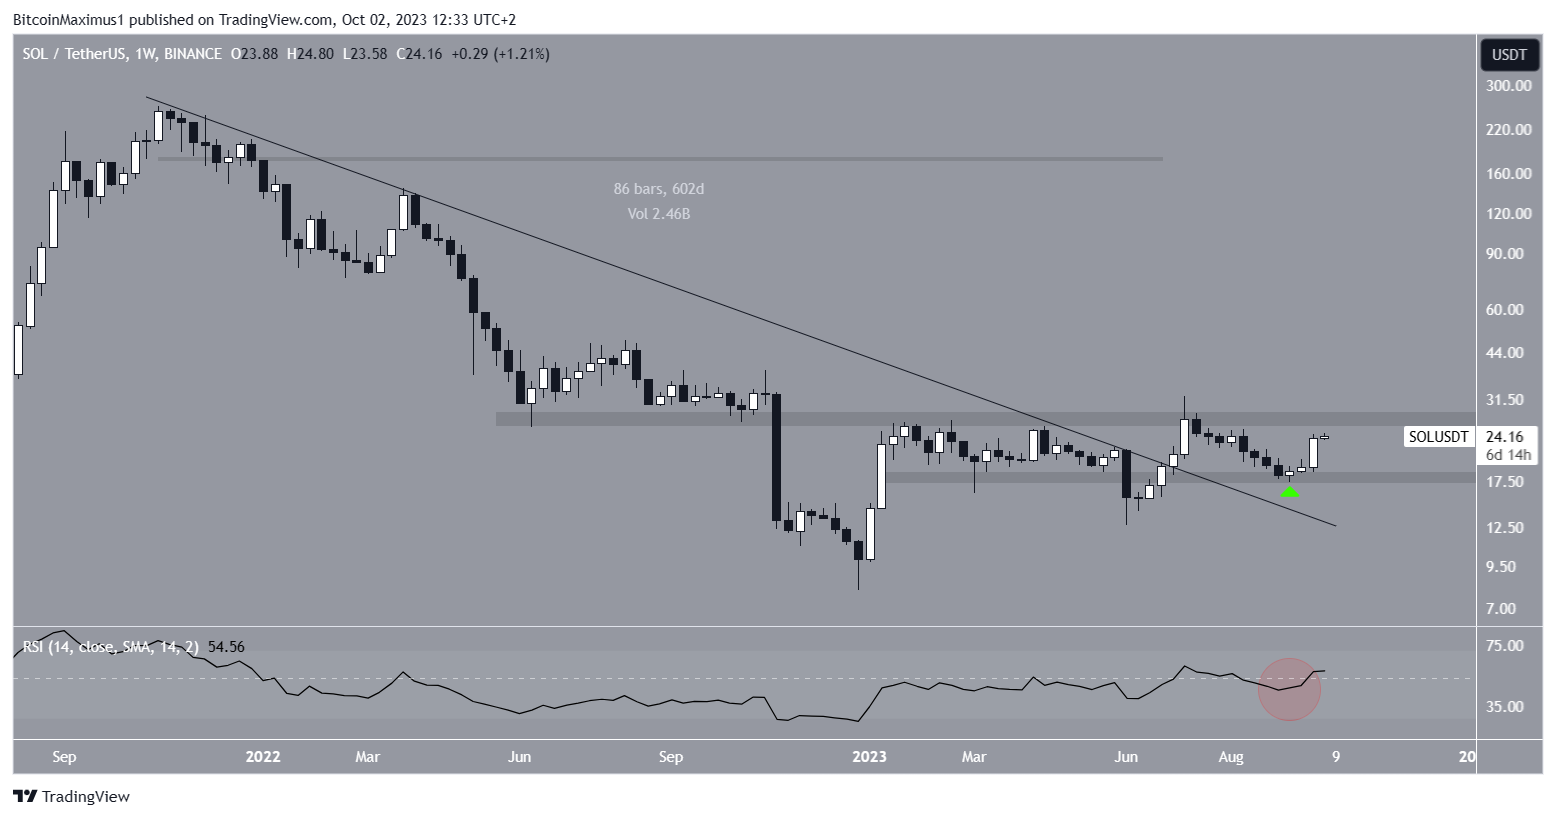
The price of Solana also trades inside a long-term horizontal range between $18 and $32.
Solana Closes Bullish Week
The weekly time frame analysis of SOL’s price movement reveals a substantial increase since the year began.
During this uptrend, SOL managed to break free from both the $18 resistance level and a long-standing descending trendline that had been in place for 600 days.
Following the breakout, Solana reached a peak of $32 before encountering resistance at $27. At the start of September, SOL’s price returned to the $18 horizontal level and rebounded (green icon), confirming it as a reliable support zone.
This has led to the creating of a trading range bounded by $18 and $32. In such trading ranges, prices typically consolidate between these extremes before deciding to move beyond them.

The weekly Relative Strength Index (RSI) is undetermined. The RSI is pivotal in helping investors identify momentum to make informed asset buying or selling choices.
Bulls find an RSI above 50 during an uptrend to be a positive sign, while a figure below 50 is considered bearish. The RSI is freely moving above and below 50, failing to confirm the trend’s direction.
SOL Price Prediction: Increase Accelerates After Daily Breakout
The daily timeframe technical analysis shows that the trend accelerated after the Solana price broke out from a descending wedge pattern on September 14. The price created a higher low on September 27 and then accelerated its increase. Until now, SOL has increased by 30%, reaching a high of $24.80.
It is possible that the increase aided the increase in the total value locked (TVL) in the Solana network. TVL reached a 2023 high of $337.49 million last week. TVL has been steadily growing since the court-approved liquidation of the FTX estate.
The daily RSI supports the continuing of the SOL price increase. When evaluating market conditions, traders use the RSI as a momentum indicator to determine if a market is overbought or oversold and to decide whether to accumulate or sell an asset.
If the RSI reading is above 50 and the trend is upward, bulls still have an advantage, but if the reading is below 50, the opposite is true.
Firstly, the RSI broke out from its descending resistance trendline (green line). Then, it moved above the 50 trendline (white) and has increased since.
These signs legitimize the breakout and suggest that the increase will continue. The next closest resistance at $27 is 12% above the current price.

However, despite the bullish SOL price prediction, a sudden drop in momentum could cause a 23% fall to the long-term ascending support line at $19.
For BeInCrypto’s latest crypto market analysis, click here
Disclaimer
In line with the Trust Project guidelines, this price analysis article is for informational purposes only and should not be considered financial or investment advice. BeInCrypto is committed to accurate, unbiased reporting, but market conditions are subject to change without notice. Always conduct your own research and consult with a professional before making any financial decisions. Please note that our Terms and Conditions, Privacy Policy, and Disclaimers have been updated.


