Since June 10, the price of Solana (SOL) has experienced a strong upward surge, resulting in a new yearly high of $32.13. This also caused a breakout from a long-term descending resistance line.
However, when observing the short-term price action, some indications raise concerns about the likelihood of a long-term bullish trend reversal. One of the reasons for this doubt is the deviation above a horizontal resistance level.
Solana Price Rally Stalls Despite Long-Term Breakout
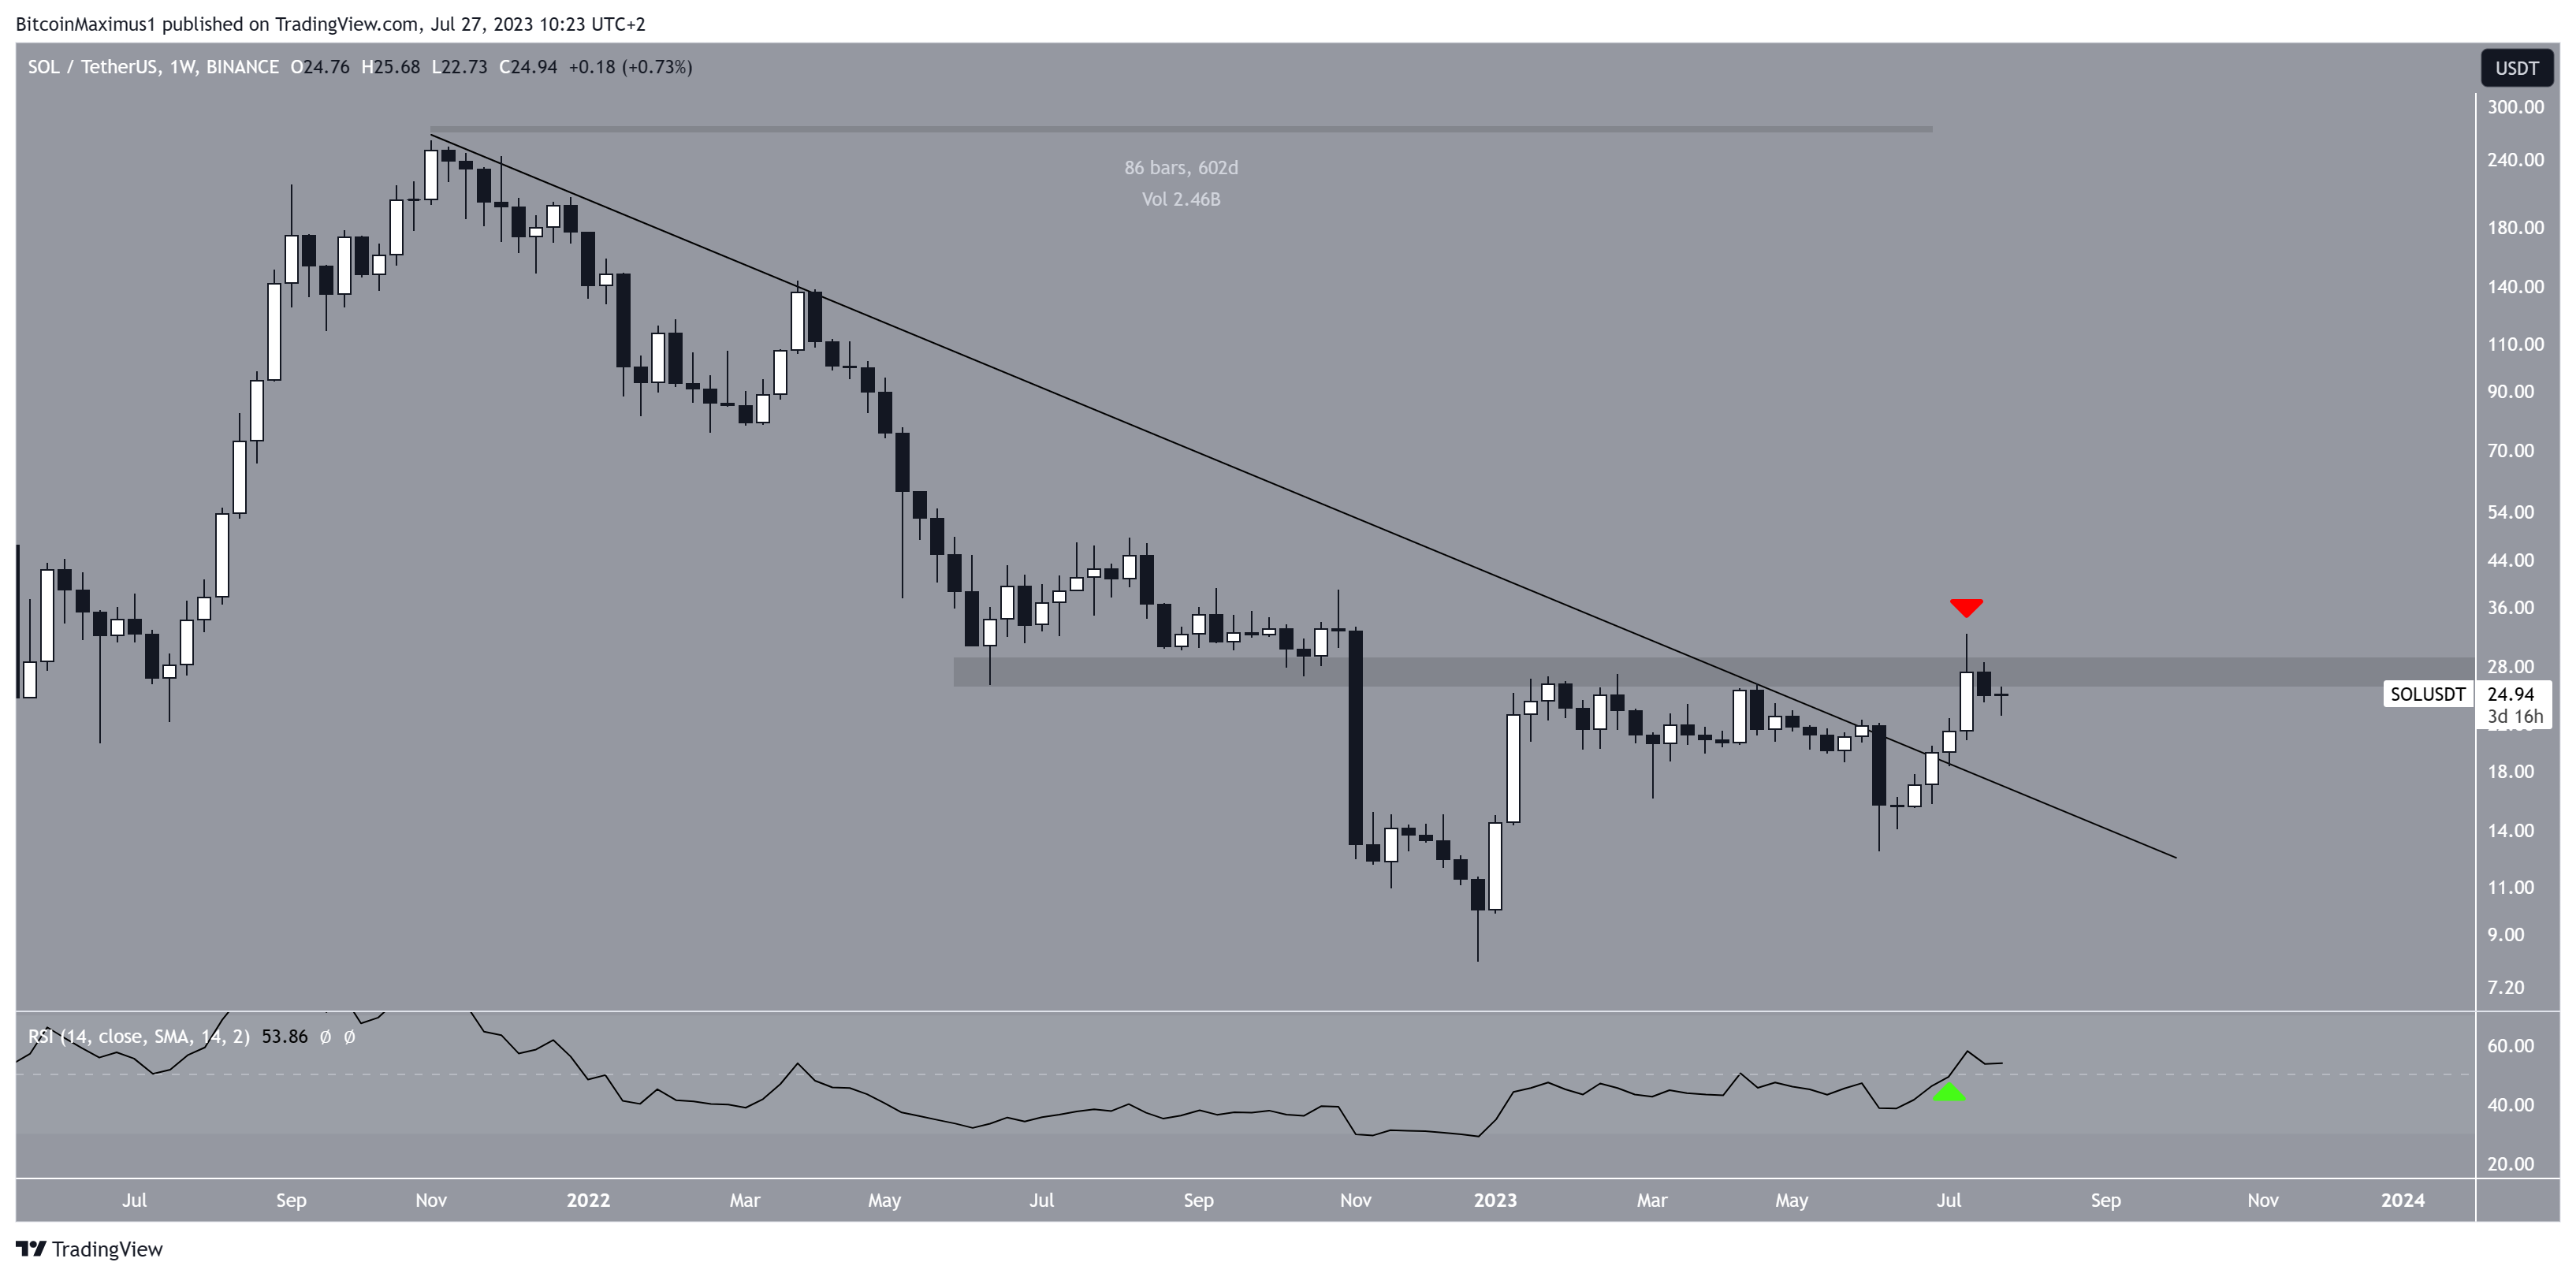
An examination of SOL’s weekly time frame reveals a notable event that occurred three weeks ago. During this time, SOL broke through a downward resistance line that had been active since November 2021, spanning over 600 days.
Such breakouts often indicate the end of the previous trend and signal the beginning of a new trend in the opposite direction. As a result, it seems probable that SOL’s price has now initiated a bullish trend reversal. SOL will gradually increase toward its previous highs if this is the case.
Turn the tide in your favor! Get token price predictions:
However, it’s important to note that the SOL price couldn’t sustainably surpass the $27 horizontal area. This led to creation of a long upper wick (red icon), which indicates selling pressure.

The legitimacy of the breakout is reinforced by the weekly Relative Strength Index (RSI), a tool commonly used by traders to assess market momentum and determine if an asset is overbought or oversold, influencing their buying or selling decisions.
Notably, the RSI has shown a higher low and is currently positioned above 50. Last week’s close above 50 (green icon) marked the first instance of this occurrence since the end of 2021.
Nonetheless, for the possibility of a bullish trend reversal to be confirmed, it will be crucial for SOL to break out convincingly from the $27 horizontal area.
SOL Price Reaction to $26 Level Will Determine Trend
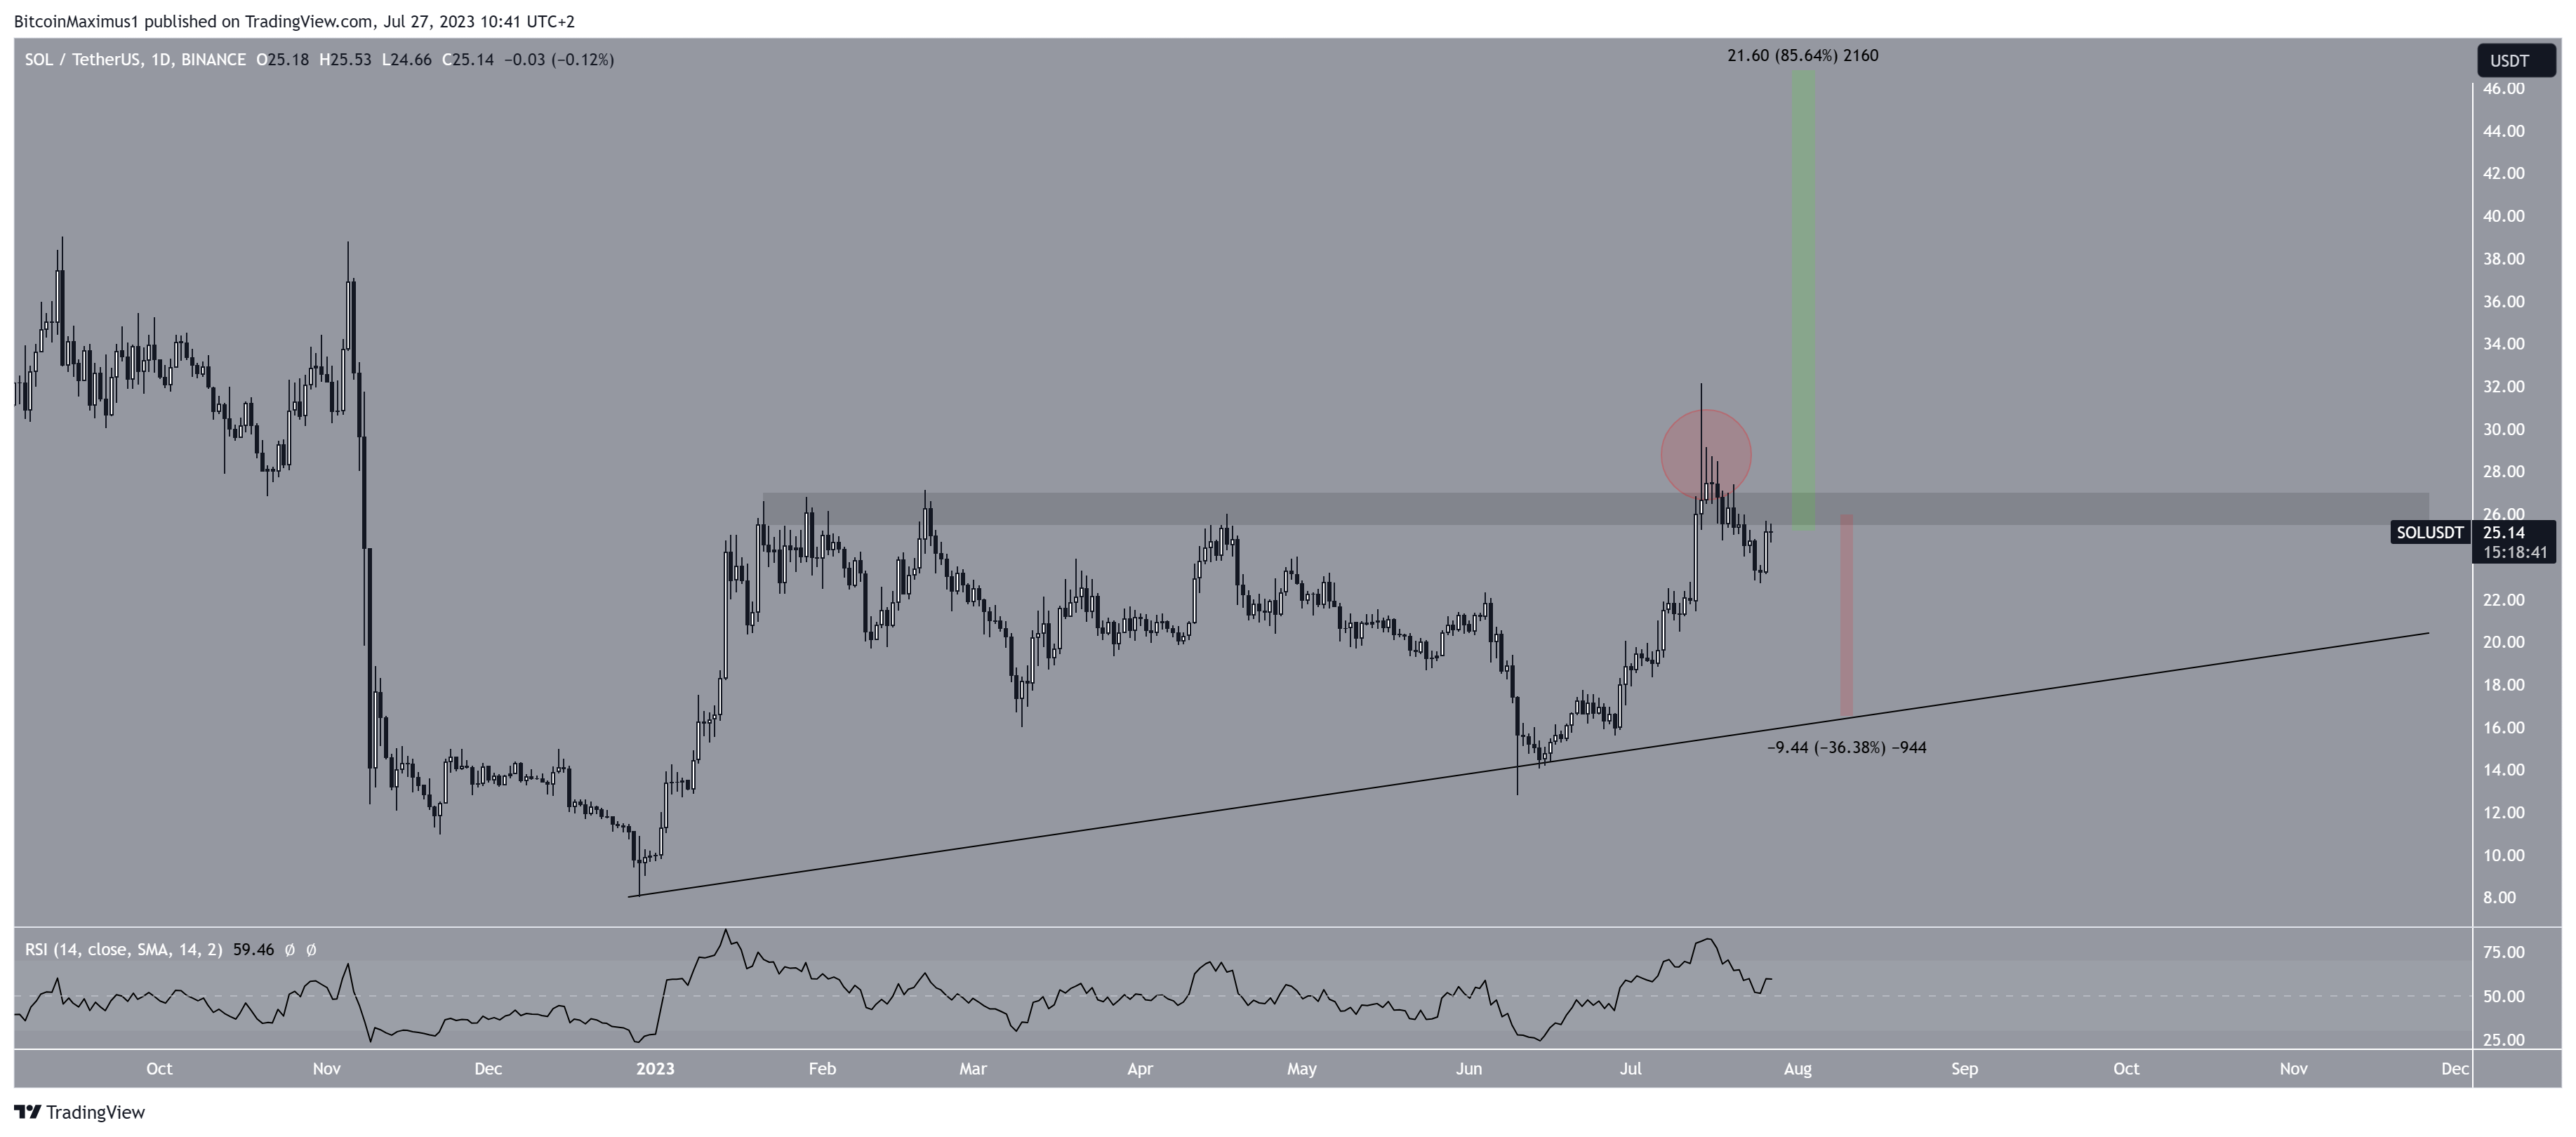
Despite the weekly technical analysis leaning bullish, the daily analysis remains uncertain. The primary reason for this uncertainty is the deviation above the $26 resistance area and the subsequent fall below it (red circle). Such deviations are typically considered bearish and often lead to significant movements in the opposite direction.
However, the price bounced afterward and is now trading close to the area again. Whether it gets rejected or reclaimed, it will be crucial to determine the future trend.
If the price reclaims the $26 area, it can quickly pump to the next resistance at $46, an 85% increase from the current price. It is worth noting that the Solana blockchain experienced zero outages in Q2 of 2023. This is a positive sign after the network was heavily criticized for eight outages in 2022.
There’s a risk of the daily Relative Strength Index (RSI) falling below 50. If this were to happen along with the rejection, it would confirm a bearish trend.
In such a scenario, the SOL price would probably decline to $18, reaching an ascending support line that has been in place since December 2022. This would be a decrease of 37% from the current price.

Therefore, while the long-term prediction for Solana remains bullish, the short-term outlook is bearish as long as the price remains below the $26 horizontal area.
If the price reclaims the $26 level, it could rise toward $35. However, if it fails to do so, it is likely to drop toward the ascending support line at $18.
Read More: Top 11 Crypto Communities To Join in 2023
For BeInCrypto’s latest crypto market analysis, click here
Disclaimer
In line with the Trust Project guidelines, this price analysis article is for informational purposes only and should not be considered financial or investment advice. BeInCrypto is committed to accurate, unbiased reporting, but market conditions are subject to change without notice. Always conduct your own research and consult with a professional before making any financial decisions. Please note that our Terms and Conditions, Privacy Policy, and Disclaimers have been updated.


