

The Solana (SOL) price reached a new yearly high of $68.20 on November 16 but has fallen since.
The price now trades slightly below a critical resistance area at $62.50. Will it break out or get rejected?
Solana Closes Five Consecutive Bullish Candlesticks
The SOL price has been on a sharp upward movement since the start of October. At the time, SOL had broken out from and validated a descending resistance trend line as support (green icon).
SOL broke out from the $27 and 50 resistance area during the upward movement. Last week, the Solana price reached a new yearly high of $68.20. This was the highest price since April 2022.
With the RSI as a momentum indicator, traders can determine whether a market is overbought or oversold and decide whether to accumulate or sell an asset.

Bulls have an advantage if the RSI reading is above 50 and the trend is upward, but if the reading is below 50, the opposite is true.
The RSI is increasing and is above 50, both positive signs. While the indicator is overbought, it has not generated any bearish divergence yet. Also, the current value of 80 is well below the all-time high of 99.
What Are Analysts Saying?
Cryptocurrency analysts on X have a positive outlook for the future trend. Bluntz Capital uses Elliott Wave theory to determine that the price will increase rapidly.
Technical analysts utilize the Elliott Wave theory to ascertain the trend’s direction by studying recurring long-term price patterns and investor psychology.

CryptoGodJohn and RektCapital have similarly bullish outlooks, though they both use horizontal price levels to achieve it. All three traders believe the SOL price will increase to a new yearly high.
Read More: 9 Best Crypto Demo Accounts For Trading
SOL Price Prediction: Retracement or Continuation?
While the weekly time frame is bullish, the six-hour one suggests that an initial retracement could occur before the altcoin eventually resumes its ascent.
The reason for this comes from the six-hour price action. The price action shows that SOL deviated above the $62.50 resistance area before validating it again.
The SOL price movement resembles a head and shoulders (H&S), considered a bearish pattern. In any case, the viability of this pattern has not been confirmed yet.
Read more: What Is Solana (SOL)?
The bearish pattern will only be confirmed if the SOL price breaks down from its neckline at $60. A 25% drop to the closest support at $45 will be expected in that case.
On the other hand, reclaiming the $62.50 area will invalidate the H&S pattern, leading to at least a 25% increase to the next resistance at $76.80.
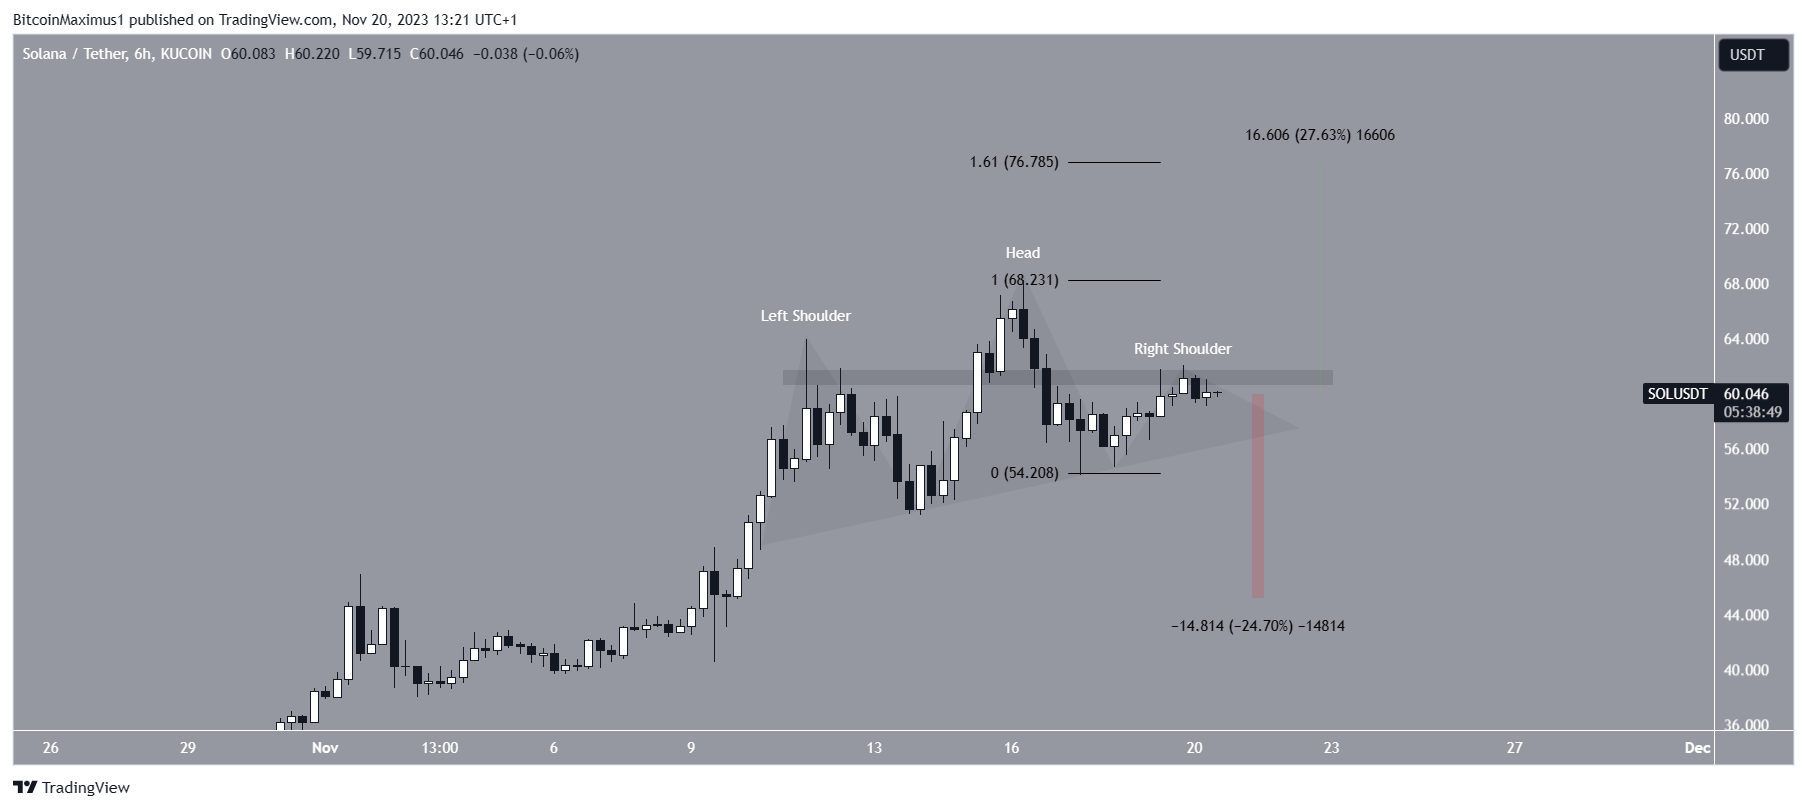
Therefore, the future SOL price prediction depends on the reaction to the $62.50 resistance area. Whether the price gets rejected or reclaimed the area can lead to a 25% decrease or increase, depending on if a rejection or reclaim occurs.
For BeInCrypto’s latest crypto market analysis, click here.
Trusted
Disclaimer
In line with the Trust Project guidelines, this price analysis article is for informational purposes only and should not be considered financial or investment advice. BeInCrypto is committed to accurate, unbiased reporting, but market conditions are subject to change without notice. Always conduct your own research and consult with a professional before making any financial decisions. Please note that our Terms and Conditions, Privacy Policy, and Disclaimers have been updated.
