


The Solana (SOL) price bounced at a long-term support level and broke out from a shorter-term descending resistance line afterward.
While the weekly timeframe does not confirm the trend’s direction, the daily timeframe provides a bullish reading, suggesting that the increase is likely to continue.
Solana Price Bounces at Range Low
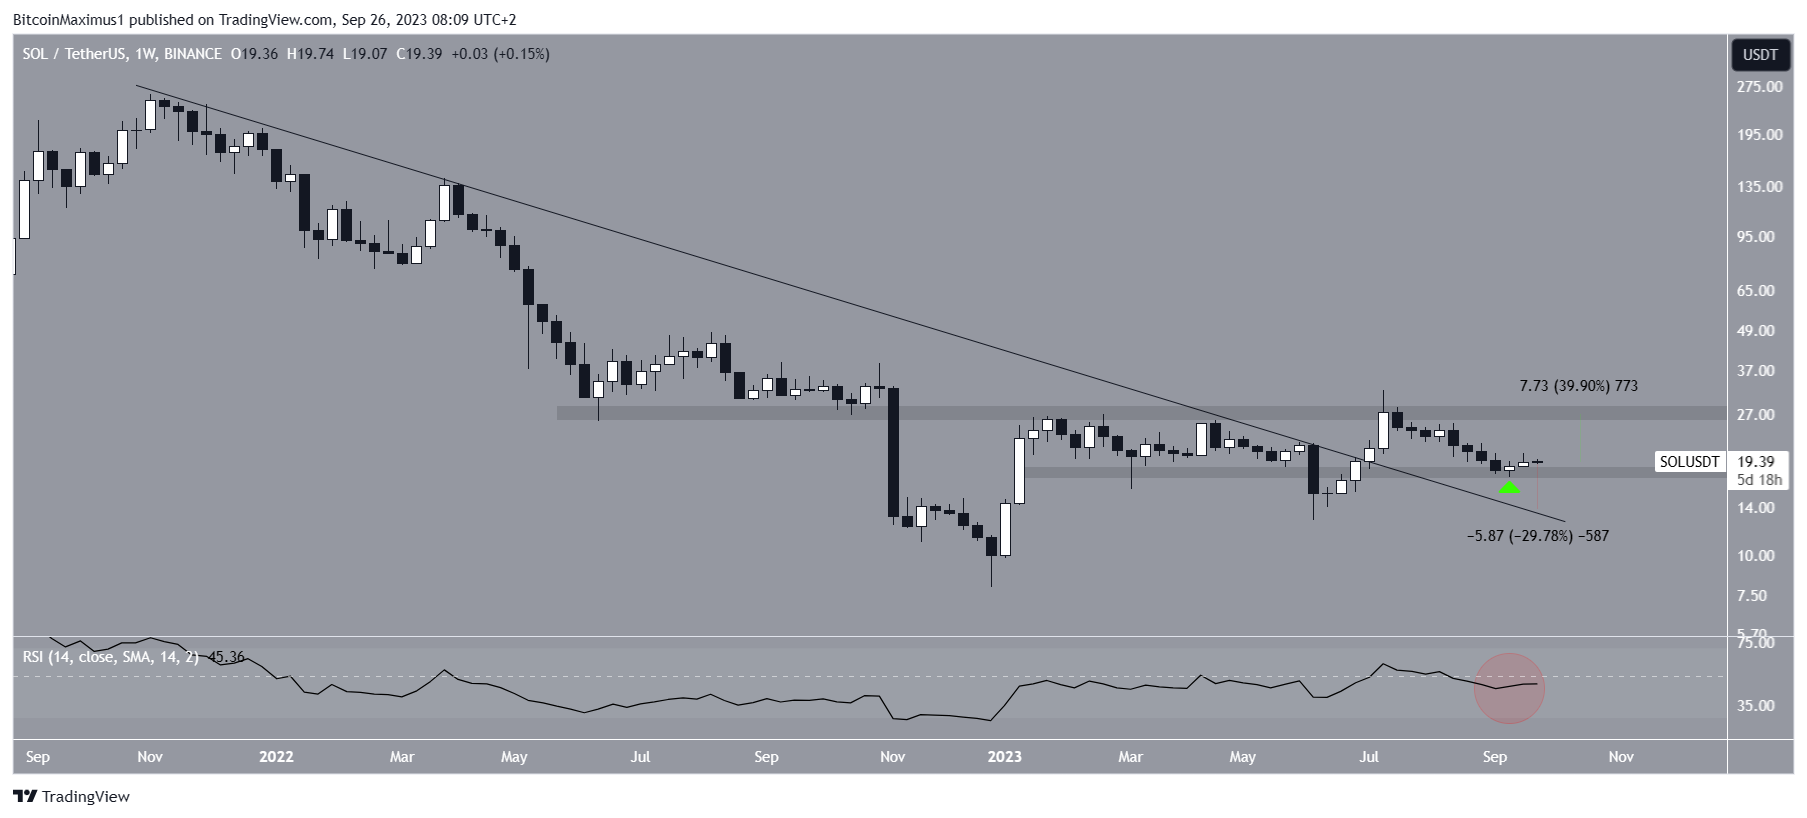
The analysis of SOL’s chart on a weekly time frame reveals a decline in price since SOL reached its highest point for the year at $32.13 in July. This downward trend hit a low of $17.33 on September 11.
However, the price subsequently rebounded and has been on an upward trajectory (green icon). Like how the price drop confirmed the $28 level as a resistance area, the rebound has confirmed the $18 horizontal level as a support.
If Solana’s price maintains its upward momentum, there is potential for a 40% increase, reaching the resistance at $28. Conversely, should the price drop below the $18 mark, it could see a further 30% decline, touching the descending resistance line at $14.
The weekly Relative Strength Index (RSI) is undetermined. Many traders employ the Relative Strength Index (RSI) as a momentum gauge, assessing whether a market is in an overbought or oversold condition, aiding them in buying or selling decisions. When the RSI surpasses the 50 threshold and demonstrates an upward trajectory, it signifies a preference for bullish sentiment.
Conversely, if it falls below 50, the opposite holds true. The indicator is currently making an attempt to cross the 50 mark (red circle), which would signify a bullish trend and confirm the potential rise towards the $28 resistance area. However, the attempt has been unsuccessful so far.
Solana network’s co-founder, Anatoly Yakovenko, has urged the US government to encourage cryptocurrency innovation without waiting for perfect regulations. Additionally, it’s noteworthy that the forthcoming FTX asset liquidation will involve $1.16 billion worth of SOL tokens, which could exert significant selling pressure on the market.
Will Breakout Lead to Range High?
While the weekly timeframe provides an undetermined outlook, the daily one is bullish. There are two main reasons for this.
Firstly, SOL bounced on September 11, validating a long-term ascending support line. The bounce at the support line aligned with the one at the long-term $18 horizontal area.
After the bounce, the SOL price broke out from a descending wedge on September 18. The descending wedge is a bullish pattern. So, the Solana price breakout from it could catalyze the beginning of a new upward movement.
Finally, the daily RSI has broken out from its descending resistance line (green). This is also a sign that the trend is changing. When combined with the Solana price breakout, this suggests that the increase is likely to continue towards the range high.
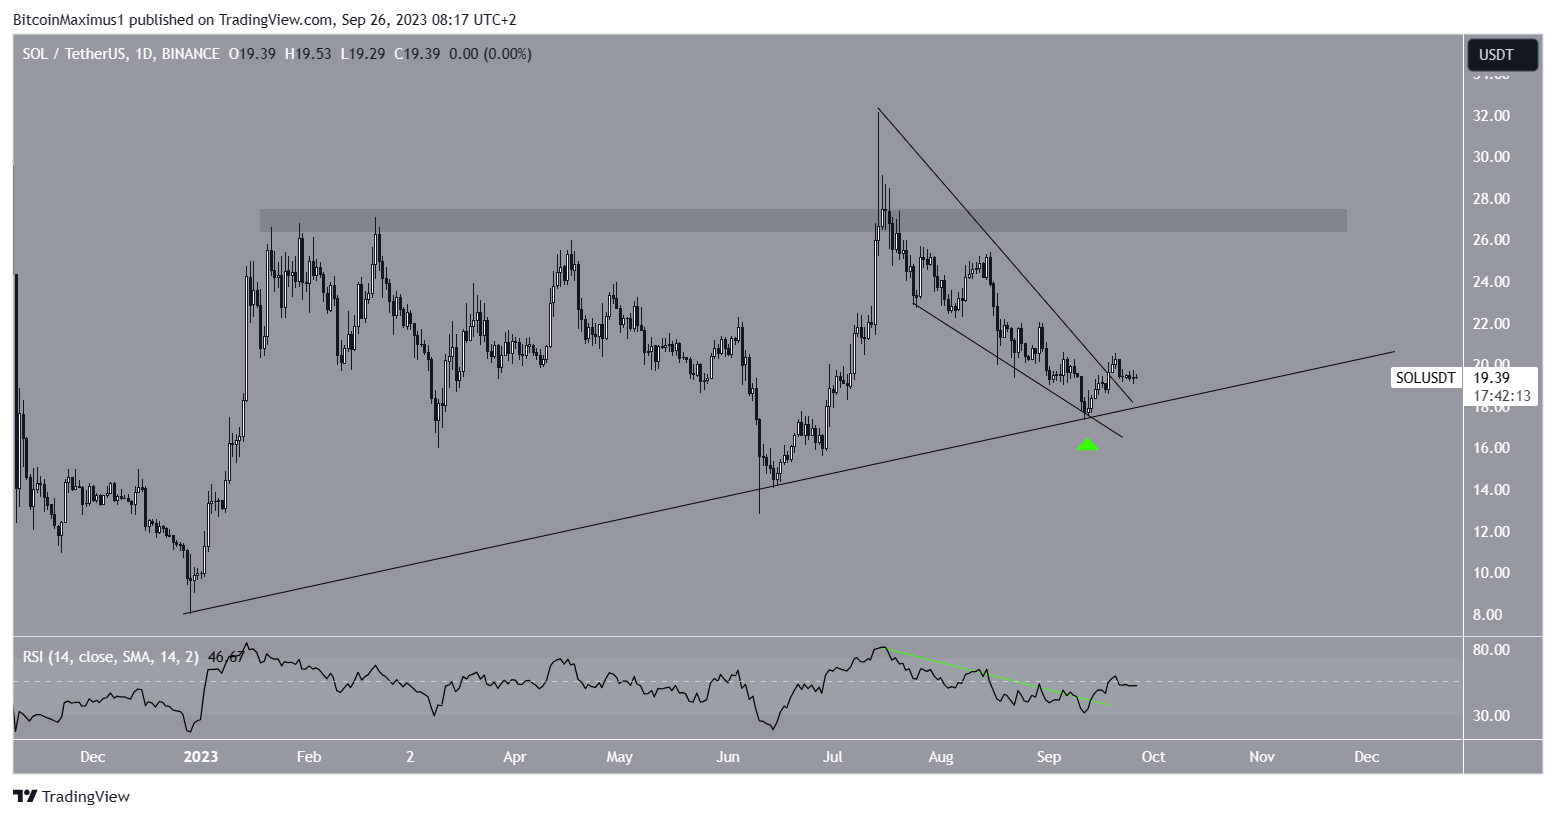
Despite this bullish SOL price prediction, a breakdown from the ascending support line will likely cause a 30% drop to the long-term descending resistance line near $14.
- Check Out the Top 11 Crypto Communities To Join in 2023
For BeInCrypto’s latest crypto market analysis, click here


