


Following its peak for the year at $32.13 on July 14, Solana (SOL) ‘s value has steadily decreased. This decrease has solidified the $27 horizontal range as the main resistance area.
The contradictory perspectives presented by the weekly and daily time frames make determining the future trend’s direction difficult. So far, the weekly trend is bullish, while the daily trend is bearish.
Solana Price Resumes Descent After Rejection
The outlook from SOL’s weekly time frame price movement shows that a significant breakout has been observed at the beginning of July.
At the time, SOL cleared a resistance line that had been active for more than 600 days. Such breakouts commonly indicate the conclusion of the prior trend and the beginning of a new upward trend.
This implies that SOL’s price might have initiated a reversal towards a bullish trend, suggesting a likelihood of gradual ascension back to its previous peak levels.
Nevertheless, SOL faced substantial resistance around the $27 mark, causing a long upper wick to form, indicative of selling pressure. As a result, the price has experienced three consecutive weeks of decline despite a positive performance from the Solana network. The price is currently trading below the $27 range.
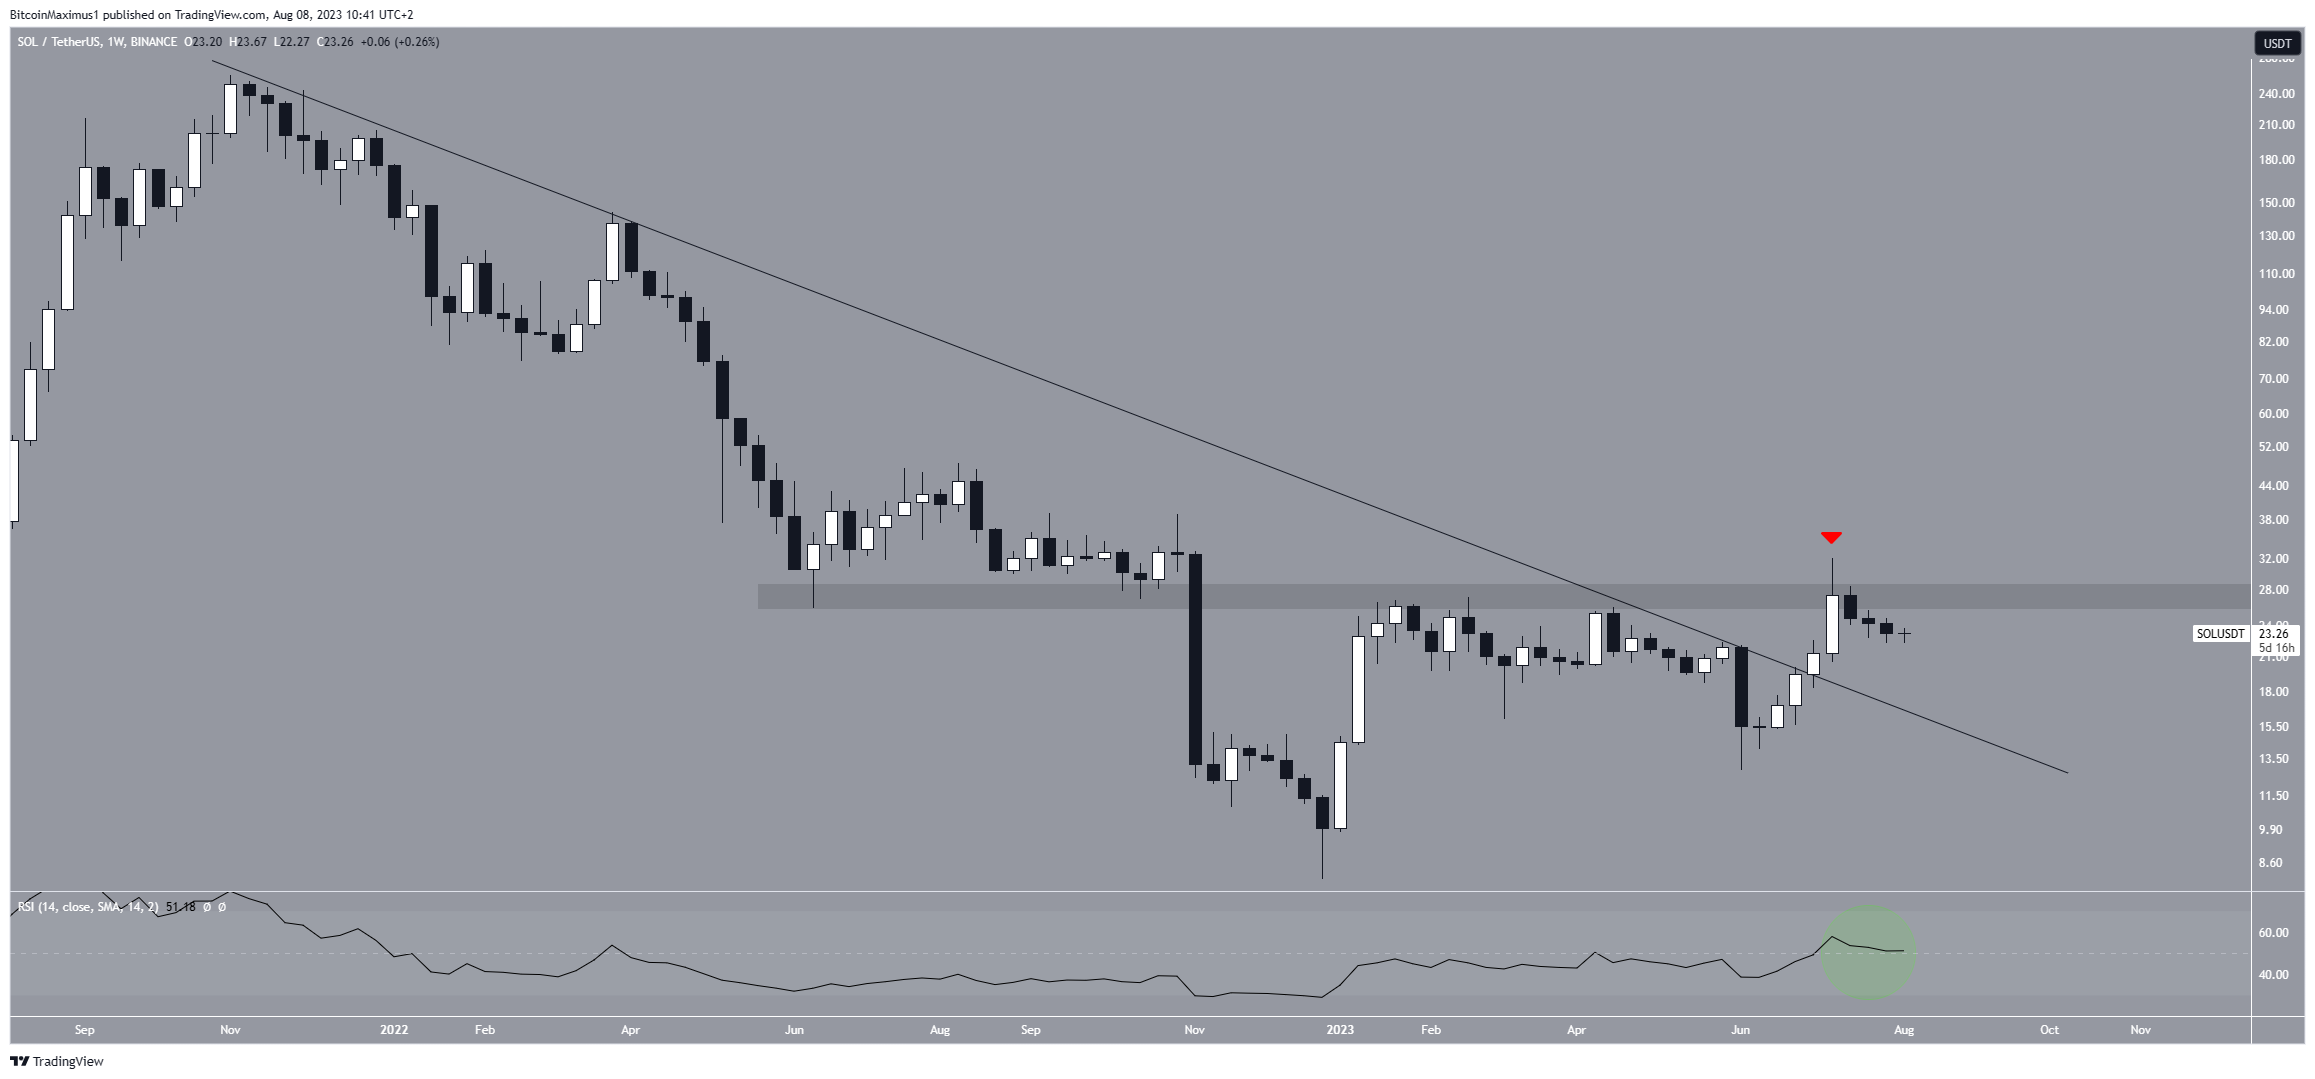
To confirm the authenticity of a breakout, traders frequently refer to the Relative Strength Index (RSI). The RSI is a tool to gauge market momentum and identify potential overbought or oversold conditions.
The RSI has displayed a higher low and is positioned above the 50 level. Additionally, last week’s closure above 50 represents the initial instance of this occurrence since the conclusion of 2021.
Nonetheless, the indicator is just hovering above the 50 line instead of beginning a sharp upward movement. An RSI bounce above 50 and a price breakout above $27 will be required to confirm the bullish trend reversal definitively.
SOL Price Prediction: Deviation Can Catalyze Decrease
Although the technical analysis on the weekly timeframe suggests a bullish outlook, the daily trend is displaying bearish readings. This creates uncertainty for the future trend’s direction.
The primary factor contributing to this bearish sentiment is the deviation and subsequent drop below the $27 resistance level (red circle). Such a deviation is typically seen as bearish and often precedes a notable price decline. It indicates that the previous breakout was illegitimate.
Following this deviation, the SOL price experienced a decline to a low of $22.23 and is currently trading just above this level.
The daily Relative Strength Index (RSI) is turning bearish on the daily time frame, as it has decreased over the past two weeks and recently crossed below the 50 threshold (red icon). Market participants commonly interpret movements below this threshold as indicators of a bearish trend.
If the downward movement persists, market analysts expect a long-term ascending support line to provide support. Currently, the line is at $16. Measuring from the current price, a drop towards it would amount to a decrease of nearly 31%.
However, if the SOL price rebounds, it could reach the $27 range again.
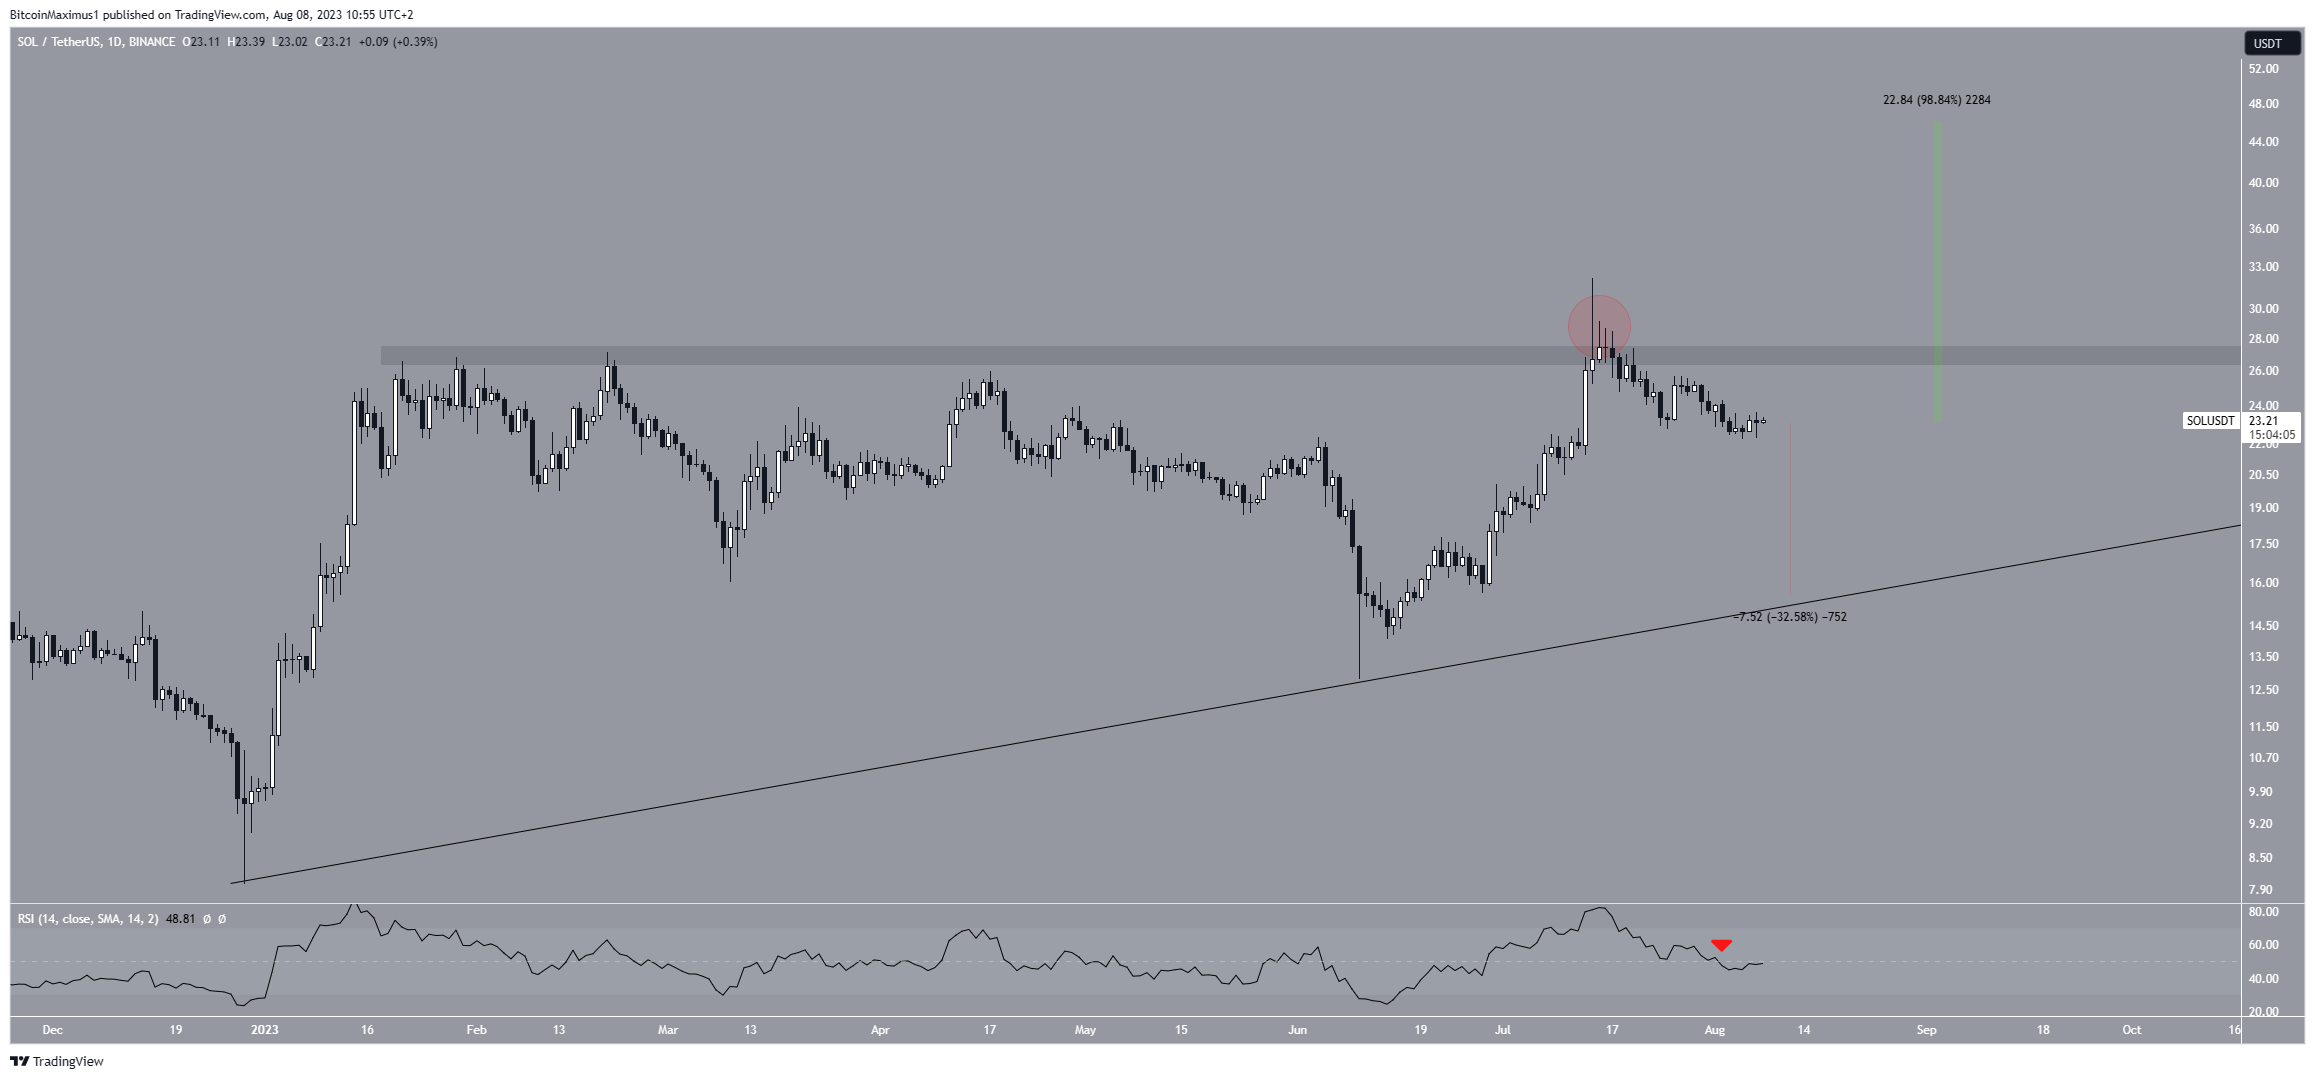
In conclusion, although the short-term prediction for SOL appears bearish, there is potential for a significant upward movement if the price breaks above the $27 level.
Such a breakthrough could lead to a long-term resistance at $47, representing a substantial 75% increase from the current price
Read More: Top 11 Crypto Communities To Join in 2023
For BeInCrypto’s latest crypto market analysis, click here


