

Cardano (ADA) came pretty close to surpassing our year-specific price prediction level. With the bulls knocking at the doors, waiting to barge in, the focus of the entire market shifts the expected price of ADA in 2025 and beyond. This updated Cardano price prediction takes a closer and more detailed look at the future of the Cardano blockchain going further.
Over the next few sections, you will find how we successfully predicted the highest price of ADA in 2023 and 2024. Plus, we will show (not tell) why we believe the price of ADA can breach the $5 mark by 2030.
- Cardano (ADA’s) long-term price prediction
- Cardano technical analysis
- Cardano (ADA) price prediction 2024 (successful)
- Cardano (ADA) price prediction 2025
- Cardano (ADA) price prediction 2026
- Cardano (ADA) price prediction 2027
- Cardano (ADA) price prediction 2028
- Cardano (ADA) price prediction 2029
- Cardano (ADA) price prediction 2030
- Cardano price forecast and impact of historical elements
- Cardano fundamentals and impact on ADA price prediction
- ADA tokenomics
- Is the Cardano price prediction model accurate?
- Frequently asked questions
Cardano (ADA’s) long-term price prediction
Yes, Cardano’s price action has been crazy, like a PEPE or a WIF. And, in the long run, the market is optimistic about ADA.
“Cardano’s been slow and steady for a while. It is not crypto like a memecoin, where you can expect a flip. A lot of the investors holding Cardano (ADA) are long on the crypto. They are Buy-and-Hold investors by definition.”
Crypto Jon, Crypto Analyst: YouTube
If you wish to hold ADA longer — even through 2035 — here is a table that can help you trace the expected price projections for the same:
| Year | Maximum price of ADA | Minimum price of ADA |
| 2024 | $1.22 | $0.41 |
| 2025 | $2.24 | $0.712 |
| 2026 | $2.14 | $1.32 |
| 2027 | $2.57 | $2.00 |
| 2028 | $3.85 | $3.01 |
| 2029 | $4.23 | $3.30 |
| 2030 | $5.26 | $4.10 |
| 2031 | $7.89 | $6.15 |
| 2032 | $10.65 | $8.30 |
| 2033 | $15.97 | $9.90 |
| 2034 | $18.37 | $14.33 |
| 2035 | $22.04 | $17.19 |
Now that the prices are revealed let us take a closer look at the detailed technical pointers in play.
Cardano technical analysis
Pattern identification
The weekly chart reveals a peak-like formation towards the extreme left of the chart. Before the peak, there is a smaller high, and post the peak, ADA makes a smaller high before going tepid and range-bound for close to 2.5 years.
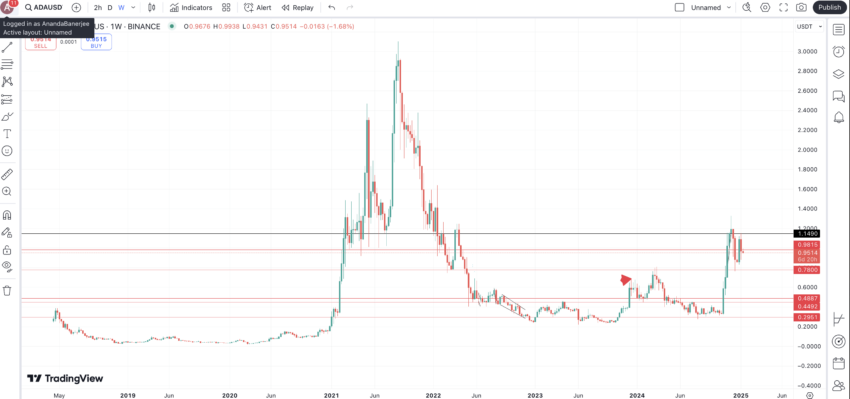
Post that, ADA makes two higher highs before peaking at over $3. After that, there are two discernible lower highs.
We can now locate every crucial high and low point on the chart to help you identify the average high-to-low and low-to-high moves.
Price moves and changes
Now that we have marked all the crucial points before, after, and between the peaks, it is time to locate the price percentage changes and distances between them. For that, we will focus on two paths: A to O and O to O1.
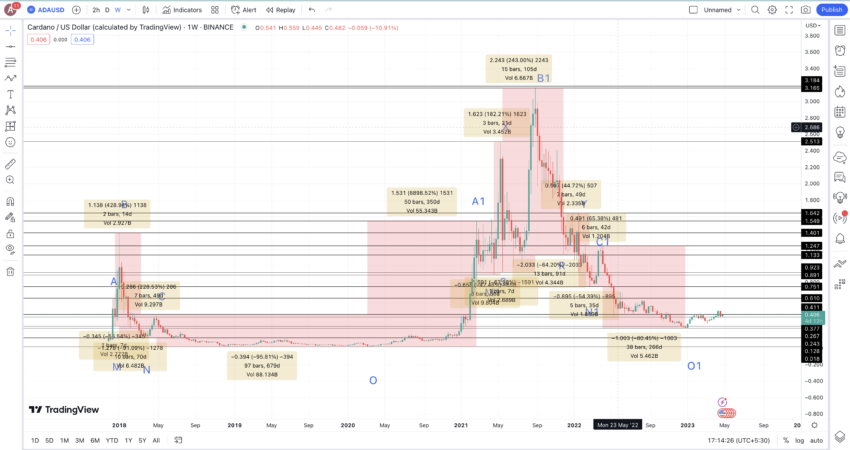
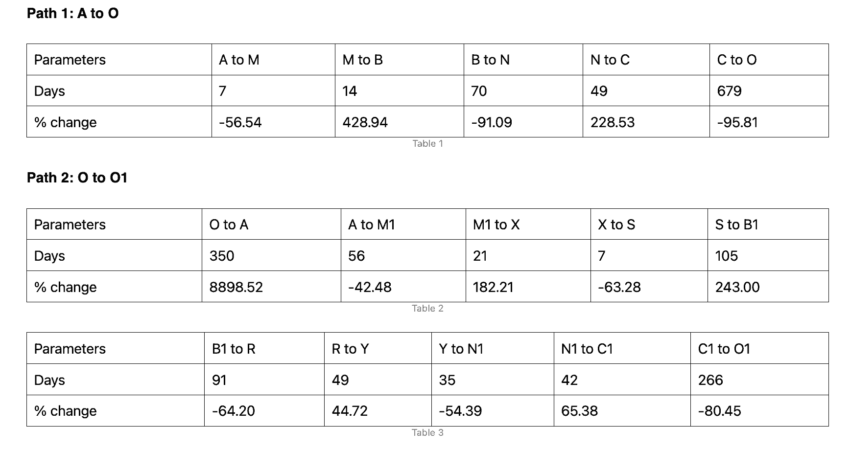
Now that we have data for all the chart points, let us use the negative and non-negative values to locate the averages.
The sum and average of all the negative values return a percentage drop (high-to-low) of 68.53%. The time taken for the same can be 151 days (average of the negative days).
Optimism surrounding ADA:
Calculations
The sum and average of all the non-negative values return a percentage hike (low-to-high) of 198.79%. We purposefully kept the O to A values of 8898.52% out to keep the calculations within permissible limits. The time taken for the same can be 90 days (average of the non-negative days).
Note: The high-to-low and the low-to-high moves can vary from the calculated average depending on the crypto market conditions, support levels, and even the resistance levels.
Now, let us use the calculations to identify the Cardano price prediction levels for the years to come.
Cardano (ADA) price prediction 2024 (successful)
Now that we have A1 — the highest Cardano price forecast level for 2023 (which was nearly fulfilled) — we used the high-to-low percentage average of 68.53% to chart the low in 2024. However, there were some strong support levels close to $0.41.
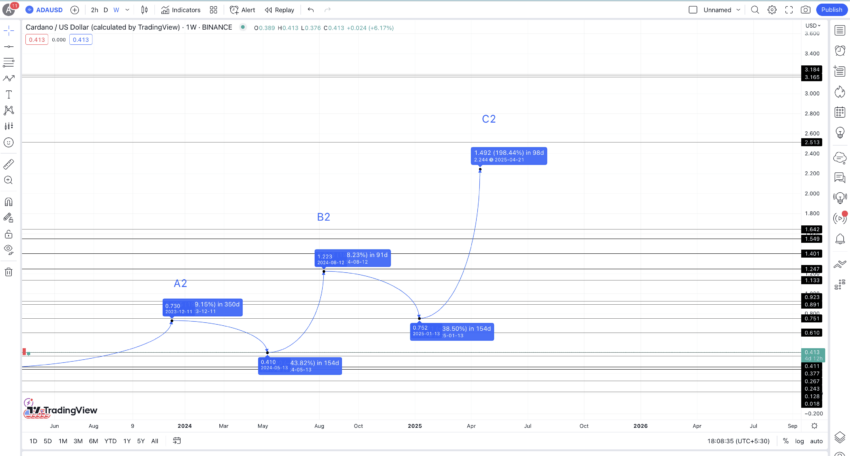
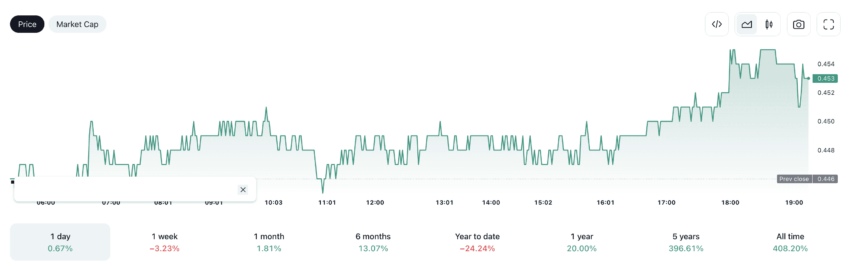
We also predicted the high to settle around $1.3 and ADA did manage to end 2024 at $1.22, successfully aligning with our predictions.
Cardano (ADA) price prediction 2025
Outlook: Moderately Bullish
The next low from this high of $1.22 or B2 could again be closer to the support level of $0.752 — translating into an average price drop of 38.50%. As this low is still higher than the 2023 high of $0.675, we can expect the price of ADA to be in an uptrend, even in 2025.
Also, using the average price hike of 198.79%, we can plot the 2025 high for ADA, which could settle at $2.24.
Projected ROI from the current level: 376%
Cardano (ADA) price prediction 2026
Outlook: Neutral
Let us now assume that the high in 2025 for ADA is termed C2. From this level, the average drop of 68.53% might be possible due to increased selling pressure applied by the recently turned-in-the-money holders. Therefore, over the next 150 days, the next drop can see the average price of ADA surface at $0.712.

This can, therefore, be the lowest price in 2025, beating the first low of $0.752. The low of $0.712 makes sense if followed by the average price hike of 198.79%. This value puts the next high — towards the onset of 2026 — at $2.14. If we mark this high as B3, we can again see a lower high formation in play for ADA — like the previous patterns.
This expectation aligns with the slow-yet-steady price action of Cardano.
Projected ROI from the current level: 355%
Cardano (ADA) price prediction 2027
Outlook: Moderately Bullish
When compared to 2026, where the prices are expected to dip in comparison to 2025, 2027 can see ADA rise anywhere between 10% to 44% — the lowest percentage hike per the tables above. Assuming a 20% hike, which is more than adequate per Cardano’s reputation, the 2027 price prediction high surface at $2.57.
Assuming that the market conditions remain neutral, the lowest price for 2027 should not drop below $2.
Projected ROI from the current level: 445%
Cardano (ADA) price prediction 2028
Outlook: Bullish
In 2028, the ADA bulls might take center stage with steady gains of over 44%. As mentioned, 44% is the lowest price surge for ADA across any interval. Under standard market conditions, this price surge is expected.
Pairing the 2026-2030 price chart, looking at the extrapolated points, and keeping the historical price surge into consideration, the Cardano price prediction for 2028 would be close to the $3.90 mark.
Projected ROI from the current level: 719%
Cardano (ADA) price prediction 2029
Outlook: Moderately Bullish
After a year with almost a 50% spike in prices, the most practical pathway for ADA would be anywhere between 10% and 50%. Assuming 10% to the most practical positioning, the ADA price prediction for 2029 should hold somewhere around the $4.23 mark.
The low for 2029, per the Fibonacci indicator, shouldn’t drop under $3.30 unless the market conditions go seriously awry.
Projected ROI from the current level: 800%
Cardano (ADA) price prediction 2030
Outlook: Bullish
With the 2023 low and 2026 high, we can extrapolate the Cardano price prediction path to locate the prices till 2030. Following the same growth path till 2026, we can expect the price of ADA to settle at $5.26 by 2030.
Projected ROI from the current level: 1019%
Cardano price forecast and impact of historical elements
Cardano (ADA) has experienced significant fluctuations since its inception. Launched in late 2017, ADA saw rapid growth, reaching an all-time high of $1.33 in January 2018 during the crypto boom.
However, the subsequent market crash saw its price plummet to as low as $0.03 by early 2019. Despite these fluctuations, ADA began a steady recovery, particularly in 2020 and 2021, fueled by continuous development and updates from the Cardano team.
Notable price movements include its peak of around $3.10 in September 2021, driven by the broader crypto bull run and significant upgrades like the Alonzo hard fork, which introduced smart contracts to the network. These advancements highlighted Cardano’s potential and attracted significant investor interest.
Impact of major events
The broader cryptocurrency market, particularly Bitcoin’s halving cycles, has a considerable impact on Cardano’s price. Bitcoin halving events, which reduce the block reward for mining Bitcoin by half, have historically led to bullish phases due to reduced new Bitcoin supply, indirectly benefiting other cryptocurrencies like Cardano.
For instance, the 2020 Bitcoin halving contributed to the 2021 crypto bull run, during which ADA reached new highs. Even post the 2024 halving event, ADA showed significant bullishness, crossing the famed $1, in under a few months.
Additionally, Cardano’s internal developments significantly influence its price. The Shelley upgrade in 2020, which introduced staking, and the Goguen phase in 2021, which enabled smart contracts, were pivotal in ADA’s price surges.
These upgrades enhanced Cardano’s functionality, making it more attractive to investors and developers. Regulatory developments and shifts in market sentiment also play crucial roles in ADA’s price dynamics. For example, positive regulatory news often boosts prices, while uncertainty or negative news can lead to declines.
Cardano fundamentals and impact on ADA price prediction
Founded by Charles Hoskinson, Cardano is easily one of the more technologically-equipped blockchains around. Here is a quick refresher to how powerful and feature-loaded the Cardano network actually is:
- Cardano comes with a layered architecture, making transaction handling more flexible.
- The blockchain comes with a more energy-efficient version of the Proof-of-Stake consensus — the Ouroboros.
- You can stake ADA to secure the network or even use it to take part in on-chain governance.
- The Cardano blockchain is developer-focused, offering ample DApp and smart contract development resources.
- The Cardano ecosystem is interoperability-focused and boasts periodic technical upgrades.
And that’s just scratching the surface when the functionality of Cardano and its native ADA tokens are concerned.
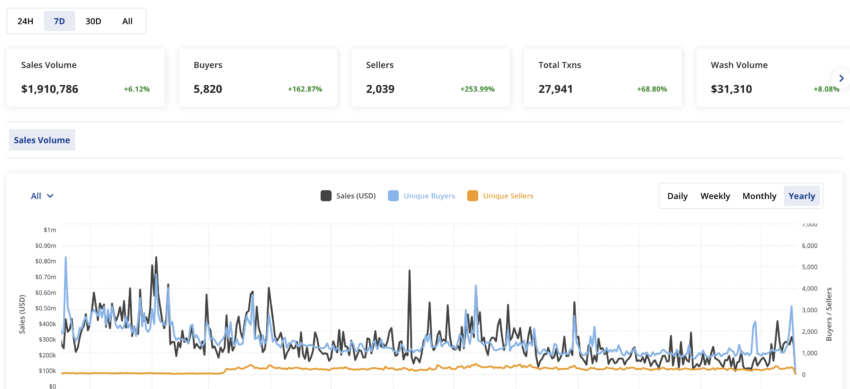
Cardano is also steadily evolving into a breeding ground for NFTs with marketplaces like Jungle, jpg.store, Pun City, and more setting shops.
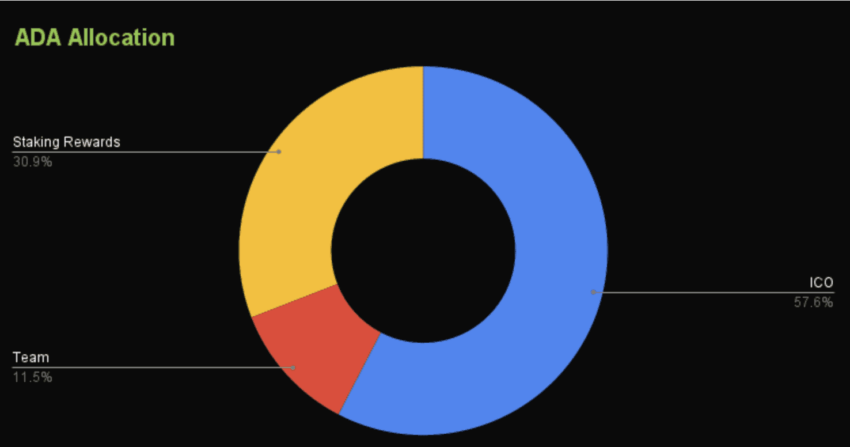
ADA tokenomics
As far as ADA tokenomics is concerned, Cardano has a maximum supply of 45 billion. Do note that almost 31.1 billion ADA tokens were initially allocated. Here is what the ratio looked like:
Per calculations, the entire Cardano supply might take close to 2050 to become liquid. Until then, we will have to deal with a standard inflation or issuance rate. Do note that the inflation rate might start dropping as and when the circulating supply starts approaching the supply cap. But that would still take some time.
Is the Cardano price prediction model accurate?
This Cardano price prediction model takes technical analysis seriously. A wide range of tracking points helps us fetch the most accurate and relative projections. However, the ADA coin price prediction levels might change depending on the changing market cap of Cardano. Other factors like the number of active developers, upgrades like the Vasil Fork, and more might also come into play. Therefore, it is advisable to keep tracking every ADA price prediction level alongside Cardano’s network-specific growth and the broader crypto market.
Disclamer: This analysis focuses on Cardano (ADA) and its market outlook. Cryptocurrency investments, including ADA, are highly volatile and subject to risks. Conduct thorough research (DYOR) and consult a financial advisor before making any investment decisions.
Frequently asked questions
What will Cardano be worth in 2025?
Will Cardano reach $100?
Will Cardano reach $20?
Is Cardano a safe long-term investment?
Disclaimer
In line with the Trust Project guidelines, the educational content on this website is offered in good faith and for general information purposes only. BeInCrypto prioritizes providing high-quality information, taking the time to research and create informative content for readers. While partners may reward the company with commissions for placements in articles, these commissions do not influence the unbiased, honest, and helpful content creation process. Any action taken by the reader based on this information is strictly at their own risk. Please note that our Terms and Conditions, Privacy Policy, and Disclaimers have been updated.


