Kava is a layer-1 project built on top of the Cosmos network. As a decentralized finance (DeFi) platform, it offers multiple services specific to earning, borrowing, and lending — use cases that may become even more popular as the crypto market turns increasingly bullish. This Kava price prediction offers a peek at the price potential of the project’s native coin, KAVA.
The following projections are based on actionable technical analysis, project-specific fundamentals, as well as on-chain metrics. Here’s what to know.
NOTE: This article contains out of date figures and information. It will be updated with fresh analysis for 2025 and beyond in the New Year. In the meantime, please see our Kava price prediction tool for the most recent, data-informed projections.
- Kava (KAVA) price prediction until 2035
- Kava (KAVA) price prediction and technical analysis
- Kava (KAVA) price prediction 2024
- Kava (KAVA) price prediction 2025
- Kava (KAVA) price prediction 2026
- Kava (KAVA) price prediction 2027
- Kava (KAVA) price prediction 2028
- Kava (KAVA) price prediction 2029
- Kava (KAVA) price prediction 2030
- KAVA fundamentals
- Kava price prediction and on-chain metrics
- What is the future of KAVA?
- Frequently asked questions
Kava (KAVA) price prediction until 2035
Before we dive into the technical analysis, here’s a summary of the possible price levels from 2024 and 2035.
| Year | Maximum price of KAVA | Minimum price of Kava |
| 2024 | $4.30 | $1.04 |
| 2025 | $4.45 | $2.23 |
| 2026 | $8.42 | $3.64 |
| 2027 | $3.83 | $0.93 |
| 2028 | $7.316 | $3.66 |
| 2029 | $12.59 | $3.05 |
| 2030 | $15.85 | $7.93 |
| 2031 | $18.00 | $7.78 |
| 2032 | $20.00 | $4.85 |
| 2033 | $25.00 | $12.50 |
| 2034 | $30.00 | $7.17 |
| 2035 | $35.00 | $17.50 |
Do note that these levels might vary anywhere between the maximum and minimum price within a given year. To learn more about how we reached these price levels were reached, read on.
Kava (KAVA) price prediction and technical analysis
There are two aspects of technical analysis — short-term movement capturing and long-term analysis. You will first see what the short-term price movement for KAVA looks like.
Bullishness around KAVA:
Short-term analysis
A clear pennant pattern is visible. And it seems KAVA has broken out of it. However, the candlestick patterns aren’t that convincing, and only a clear move above $0.78 can signal a strong uptrend. Even the RSI is hinting at a bearish divergence. Should KAVA fall under the lower trendline of the showcased pattern, it is possible for it to touch the lowest level of 2024 — $0.56.
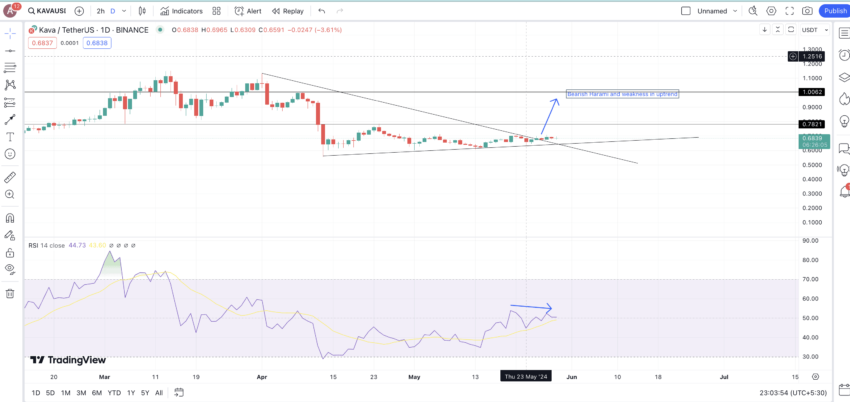
However, a move above $0.78 can push the price of KAVA to $1, depending on the state of the crypto market.
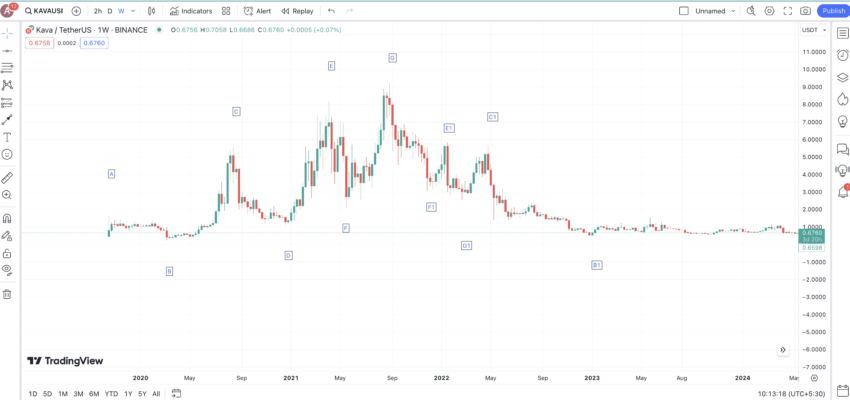
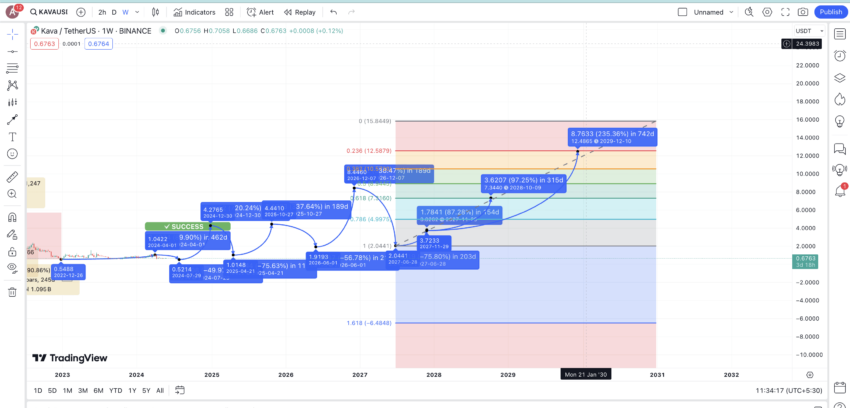
Long-term analysis
For the long-term analysis, we can refer to the weekly chart of KAVA. Notice how the price action starts low and makes a series of higher highs. Following an all-time high of over $9, the price begins correcting, making the same number of lower highs, eventually reaching levels similar to the starting point.
Historical price movement of KAVA:
The flow resembles a foldback pattern where the right side of the formation is symmetrical to the left. This way, we expect the price of KAVA to start making higher highs soon.
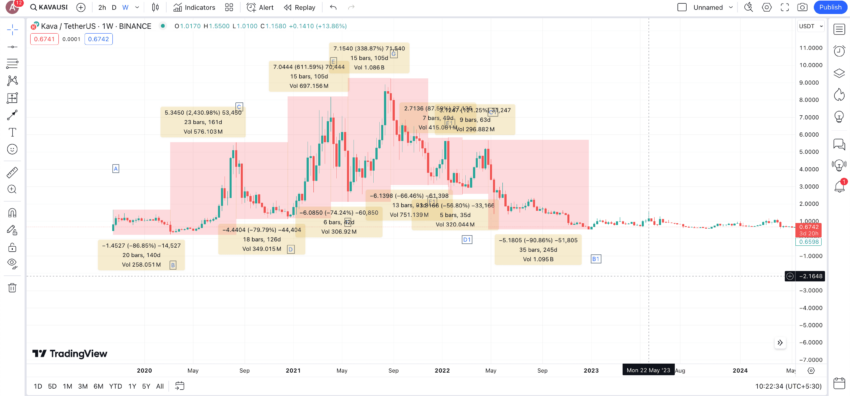
However, to locate the exact nature of the surges and upcoming dips, it is important to locate the average price hike and dip percentages. Here is a quick table that considers the price and distance change between two relevant consecutive points on the chart:
| A to B | -86.85% in 140 days |
| B to C | 2430.98% in 161 days |
| C to D | -79.79% in 126 days |
| D to E | 611.59% in 105 days |
| E to F | -74.24% in 42 days |
| F to G | 338.87% in 105 days |
| G to F1 | -66.46% in 91 days |
| F1 to E1 | 87.59% in 49 days |
| E1 to D1 | -56.80% in 35 days |
| D1 to C1 | 121.25% in 63 days |
| C1 to B1 | -90.86% in 245 days |
The average price hike and price drop percentages are as follows:
Average price surge
- Percentage increase: 718.06%
- Average duration: 96.6 days
Average price dip
- Percentage decrease: -75.83%
- Average duration: 113.17 days
Do note that in bullish markets, the drop could be lower than the average, and during bearish or less volatile phases, the surges can also be on the lower side. It all depends on the market sentiments at any given time.
We will now use this data to chart KAVA’s long-term price potential.
Kava (KAVA) price prediction 2024
Outlook: Very bullish
The lowest price of KAVA in 2024 should not fall under $0.5214, which aligns with B1 on the price chart. From B1, the next high, or A1, can surface as high as 87.59%, the lowest price percentage hike per Table 2. This price level is considered instead of the average price surge percentage of 718% for two specific reasons: the market is still deciding on a direction, and the price of KAVA has stabilized over the years.
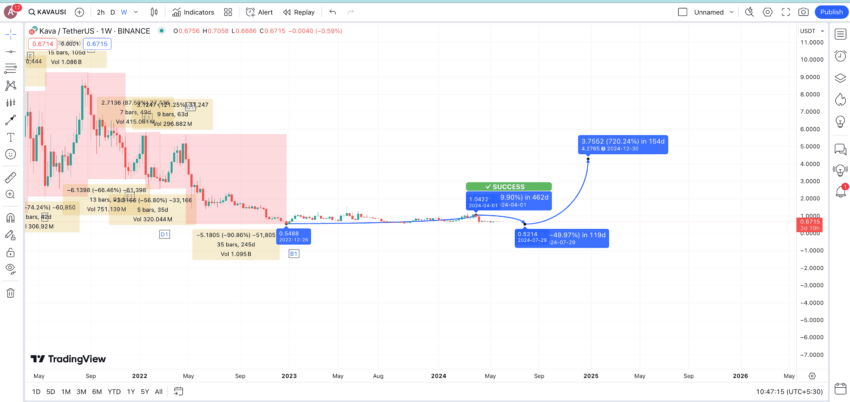
An 87.59% surge puts A1 at $1.04. The price of KAVA has already reached this level, which shows the solidarity of this price prediction. Therefore, A1 is already there. In 2024, we can thus expect another correction, not lower than $0.52. From this point, the next surge can be expected to go as high as 718.06%. This way, the price of KAVA can go as high as $4.30 by the end of 2024.
Project ROI from the current level: 532.35%
Kava (KAVA) price prediction 2025
Outlook: Bullish
Once KAVA reaches $4.30 by 2024, presumably, you can expect rapid sell-offs at the counter. The price correction, therefore, could be 75.83% from the average dip calculation you did earlier. Therefore, the minimum price of KAVA in 2023 could surface at $1.04.
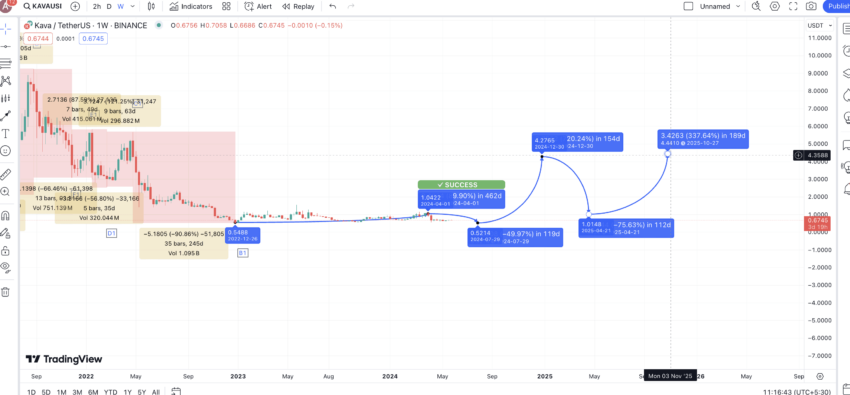
However, the next leg of the surge could be restricted to 338.87%, the third lowest surge value per Table 2. While we can expect the higher-high formation to hold, another 718% increase in as many years might not be practical. This assumption puts the maximum price of KAVA in 2025 at $4.45.
Project ROI from the current level: 554.41%
Kava (KAVA) price prediction 2026
Outlook: Bullish
By early 2026, another correction could be expected at KAVA’s counter. However, it might not be as aggressive as 75.83%, particularly if the project starts improving from a fundamental perspective. Therefore, we expect a correction of 56.80%, the lowest price correction per Table 2. This assumption puts the 2026 low for Kava at $1.92.
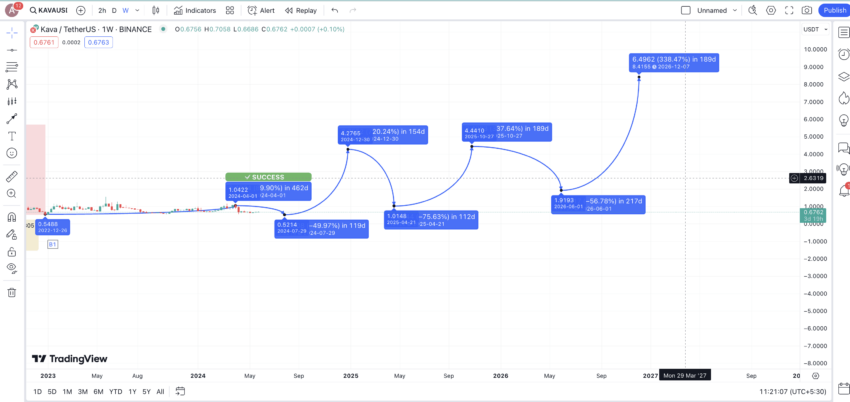
As the usual formation for KAVA beckons another higher high, we anticipate a 338.87% increase from the 2026 low. This puts the maximum price of KAVA in 2026 at $8.42. Notice that this level is close to KAVA’s all-time high of $9+.
Project ROI from the current level: 1138.24%
Kava (KAVA) price prediction 2027
Outlook: Bearish
In 2027, the bears will likely reenter the scene, pushing the prices down by the average calculated value of 75.83%. Therefore, the minimum price in 2027 could be $2.04. The high might go up to the lowest surge percentage of 87.59%, per expectations. Therefore, the KAVA price prediction high for 2027 might show up at $3.83.
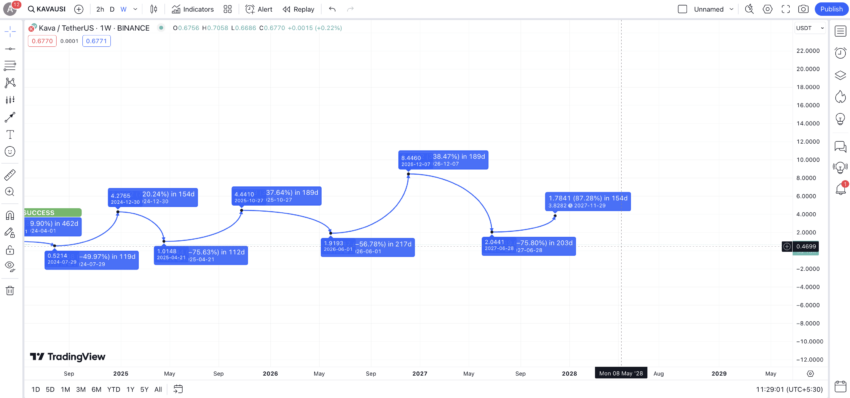
Project ROI from the current level: 463.24%
Kava (KAVA) price prediction 2028
Outlook: Bullish
Using the swing highs and lows of 2027, we can extrapolate KAVA’s path until the year 2030, taking assistance from the Fibonacci Retracement indicator. This puts the 2028 high at almost $7.316, which expect to hold if other key levels are reached.
Project ROI from the current level: 975.29%
Kava (KAVA) price prediction 2029
Outlook: Very Bullish
Using the Fib retracement indicator, the maximum price of KAVA in 2029 could go all the way up to $12.59.
Project ROI from the current level: 1751.47%
Kava (KAVA) price prediction 2030
Outlook: Very bullish
If we extrapolate the Fibonacci retracement lines until 2030, especially the year’s end, the highest possible price can surface at $15.85. This is assuming that in 2029, KAVA will make multiple all-time highs, finally breaching the $9 mark.
Project ROI from the current level: 2232.45%
KAVA fundamentals
The technical analysis focusing on KAVA’s price looks optimistic. Yet, does Kava have the fundamentals to sustain this growth in the long term? Here is what you should know about this layer-1 blockchain and its native coin.
Tokenomics
Total supply: 1,082,856,249 KAVA
Circulating supply: Matches total supply, meaning all coins are in circulation.
Token distribution:
- Seed investors & strategic partnerships: 40%
- Community pool: 25% for ecosystem development
- Team & advisors: 20%
- Liquidity incentives & staking rewards: 15%
Positive elements:
- Fixed supply: A fixed total supply prevents dilution, potentially leading to a stable and increasing price of Kava.
- Incentive programs: Staking rewards and the Kava Rise program promote active network participation and security, driving demand.
Concerning elements:
- High circulating supply: The large number of coins already in circulation could limit substantial price increases unless demand grows significantly.
- Competitive landscape: Intense competition from other blockchains and DeFi platforms may hinder Kava’s adoption.
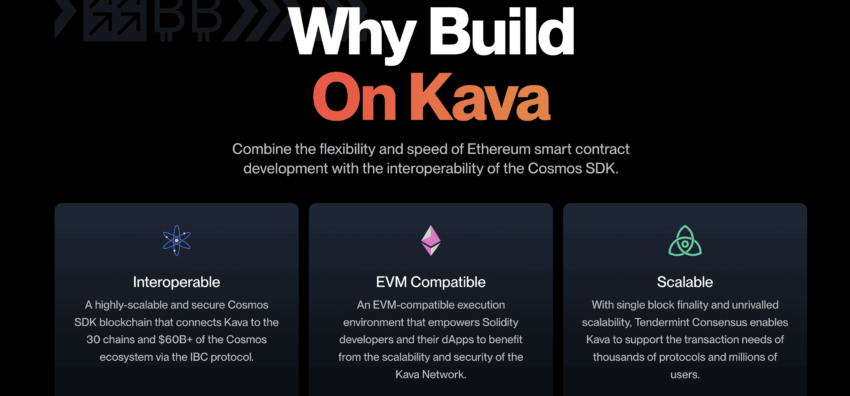
Innovation and technology
Interoperability: Kava leverages the Cosmos SDK, connecting to over 30 chains and the $60 billion Cosmos ecosystem via the IBC protocol.
“Kava has the capability to grow and support and wide variety of new crypto assets, which include derivatives products and new synthetics.”
Guy Turner, founder of Coin Bureau: YouTube
EVM compatibility: Supports Solidity developers and their DApps with scalability and security through its EVM-compatible environment.
Scalability: Utilizes Tendermint Consensus for single block finality, supporting thousands of protocols and millions of users with unmatched scalability.
Low transaction fees: Average transaction fees on the Kava network are as low as $0.0001.
Positive elements:
- Dual-chain architecture: Enhances utility and adoption across multiple blockchains.
- Scalability: High throughput and affordable transaction fees make Kava attractive for DeFi applications.
- Active ecosystem: Hosts over 125 DApps and $625 million in on-chain assets, driving continuous growth.
Did you know? Kava has a unique feature known as the Hard Protocol, which allows users to lend and borrow digital assets across different blockchains. Unlike many other DeFi platforms that focus solely on Ethereum, Kava’s Hard Protocol supports assets from multiple chains, including BTC, BNB, and XRP. This cross-chain capability significantly enhances liquidity and utility for its users.
Weaker elements:
- Complexity: The dual-chain setup, while innovative, might be complex for new developers, potentially slowing down adoption.
- Market dependence: The platform’s growth heavily depends on the broader crypto market and adoption trends, which can be volatile.
Kava’s robust fundamentals, innovative technology, and strategic tokenomics position it well within the crypto market. While there are some challenges, the potential for innovation and increased adoption could drive the price of Kava higher. For adherence to the Kava price prediction levels, monitoring market cap trends, regulatory developments, and technical indicators is essential.
Kava price prediction and on-chain metrics
It’s important to understand the on-chain metrics in order to gauge the price movement and future price potential of any crypto.
Volatility analysis
The first image concerns the price volatility:
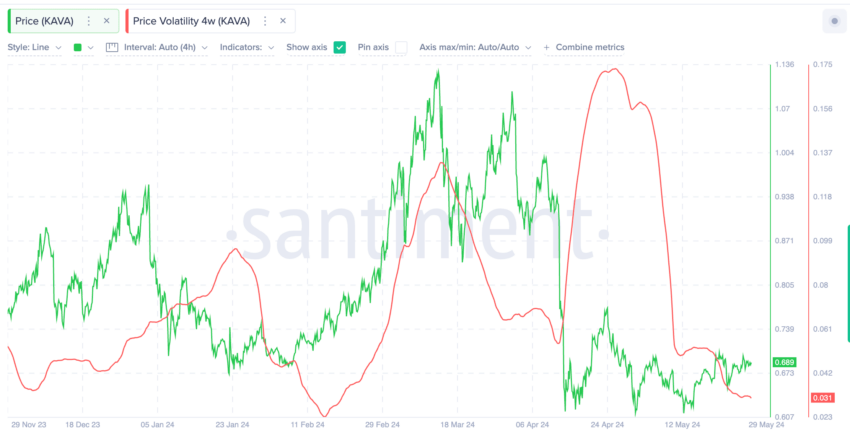
This chart shows the price of Kava (green line) alongside its 4-week price volatility (red line). High volatility periods often correspond with significant price movements. For instance, peaks in volatility align with notable price increases and decreases.
Traders need to understand:
- Volatility trends: High volatility indicates potential price swings, which are useful for traders looking for entry/ exit points.
- Price correlation: Understanding how price responds to volatility can help predict future movements.
Development activity
Here is the second chart that captures the development activity within the blockchain:
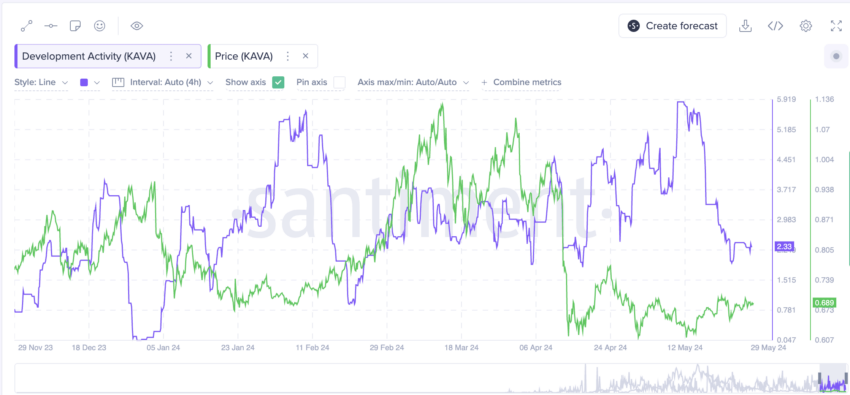
This chart displays Kava’s price (green line) compared with its development activity (purple line).
Peaks in development activity often precede or coincide with price increases, indicating that active development positively influences Kava’s price.
Traders should look for:
- Development activity: Sustained high development activity suggests ongoing improvements and innovations, potentially leading to price appreciation.
- Price movements: Monitoring development trends can provide early signals of potential price action.
By analyzing these on-chain metrics, traders can gain valuable insights into the crypto market dynamics and make informed decisions.
What is the future of KAVA?
The future of KAVA looks promising, bolstered by strong fundamentals, innovative technology, and positive on-chain metrics. The Kava price prediction indicates a bullish trend extending to 2035, supported by robust development activities, optimistic price movements, and strategic tokenomics. The interoperability with both Cosmos and Ethereum ecosystems, along with low transaction fees and high scalability, positions Kava well in the crypto market. Traders should monitor ongoing developments and market trends to capitalize on potential price increases and project growth.
Frequently asked questions
Is KAVA coin safe?
What is KAVA crypto?
Is Kava a stablecoin?
Disclaimer
In line with the Trust Project guidelines, the educational content on this website is offered in good faith and for general information purposes only. BeInCrypto prioritizes providing high-quality information, taking the time to research and create informative content for readers. While partners may reward the company with commissions for placements in articles, these commissions do not influence the unbiased, honest, and helpful content creation process. Any action taken by the reader based on this information is strictly at their own risk. Please note that our Terms and Conditions, Privacy Policy, and Disclaimers have been updated.