
Decentraland, the Ethereum-based metaverse, is many things — software, a virtual reality platform, and a decentralized game with a focus on player incentivization. The ecosystem allows users to build, monetize, purchase, and trade content seamlessly. Yet unlike other metaverse realms with one native crypto, Decentraland has two — MANA and LAND. This Decentraland price prediction primarily looks at the future price potential of the MANA token.
KEY TAKEAWAYS
➢ According to our fundamental and technical analysis-backed price prediction, MANA has the potential to reach $154.18 by 2035, with significant price hikes and corrections due along the way.
➢ MANA powers the Decentraland ecosystem, with use cases in trading, governance, and metaverse activities, alongside LAND as an NFT counterpart.
➢ Partnerships, user adoption, and controlled token supply (via burns) are all key factors supporting long-term MANA growth.
- Decentraland (MANA’s) long-term price prediction until 2035
- Decentraland price prediction and technical analysis
- Decentraland (MANA) price prediction 2025
- Decentraland (MANA) price prediction 2030
- Decentraland fundamentals
- Decentraland tokenomics
- Is the Decentraland price prediction model accurate?
- Frequently asked questions
Decentraland (MANA’s) long-term price prediction until 2035
We can extrapolate the same to locate the price projections till 2035. Here is a table for your reference:
| Year | Maximum price of MANA | Minimum price of MANA |
| 2025 | $4.66 | $2.39 |
| 2026 | $6.66 | $2.82 |
| 2027 | $11.65 | $7.22 |
| 2028 | $17.47 | $10.83 |
| 2029 | $28.83 | $22.48 |
| 2030 | $35.81 | $22.20 |
| 2031 | $57.30 | $35.52 |
| 2032 | $74.48 | $58.33 |
| 2033 | $89.38 | $69.71 |
| 2034 | $102.78 | $63.72 |
| 2035 | $154.18 | 120.26 |
Decentraland price prediction and technical analysis
Price identification
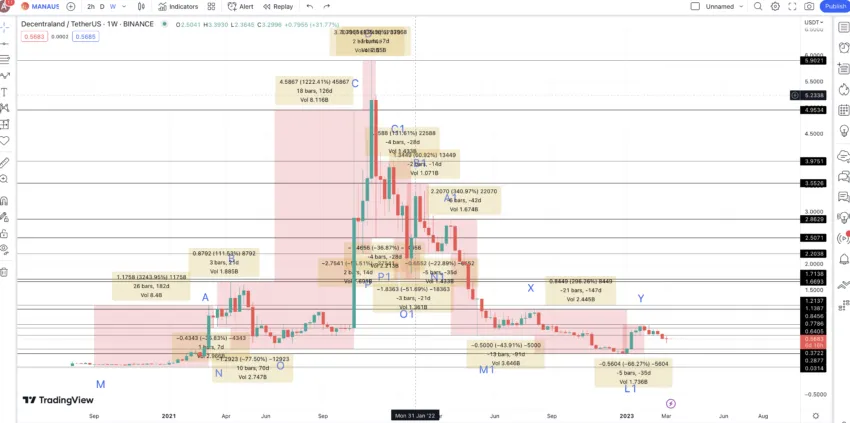
The weekly price chart of MANA shows a higher high formation to the peak, followed by a lower high formation to the current levels.
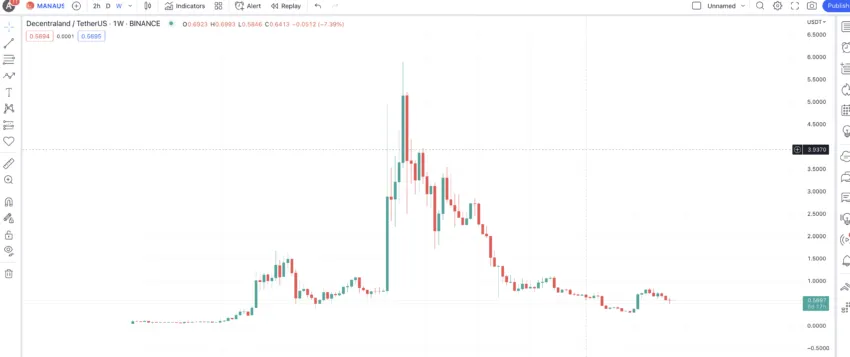
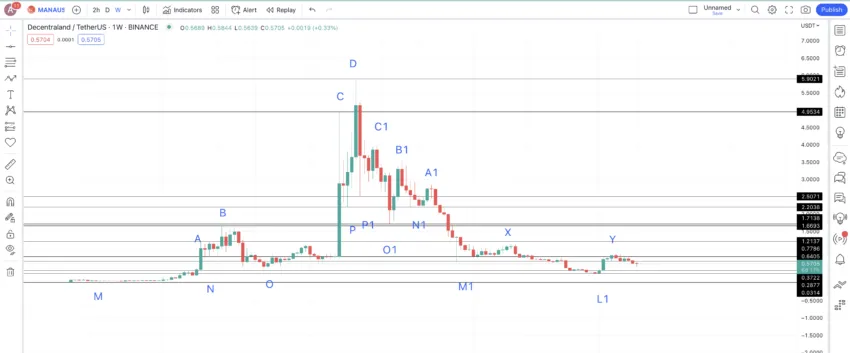
Let us first mark all the maximum prices and minimum prices associated with the weekly chart to acquire usable data. Here is the marked chart.
Things to infer from the weekly chart:
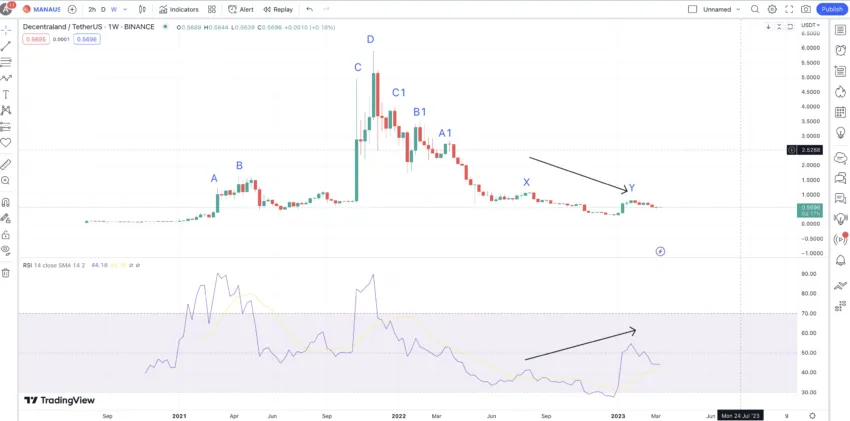
- The RSI is forming a bullish divergence, which might hint at a trend and even pattern reversal. We can then assume that a new pattern starts soon after Y.
- We would still need to locate the next low after Y, which will help us complete the pattern better.
Price changes
We can find the price percentage and distance between each point corresponding to two paths: M to D and Y to D (reverse path of D to Y).
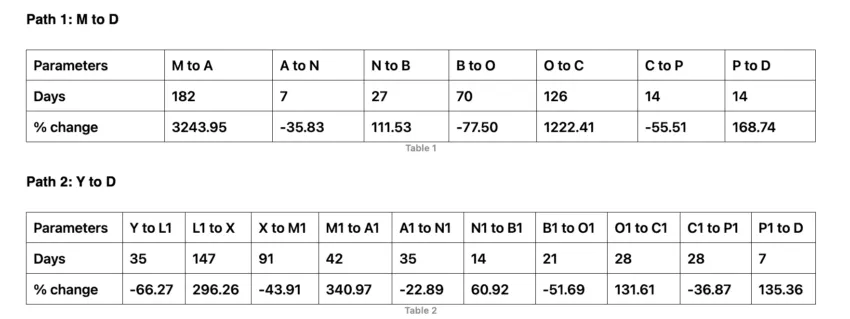
That’s quite a lot of data points. We must take the average of the non-negative and negative column values to locate the probable points for the next low-to-high and the next high-to-low moves. Low-to-high average (non-negative column values): 634.64% and in 7 to 182 days (from the tables above). High-to-low average (negative column values): -48.81% and in 7 to 91 days (from the tables above).
The price percentages between the highs and lows can vary depending on the market conditions. They might not always adhere to the average values and can be higher or lower. We shall now use the data sets and calculated values to locate Decentraland price prediction levels till 2030 and even onwards.
Decentraland (MANA) price prediction 2025
The next low, using the average of 48.81%, puts the low O2 at $2.20. From this point, we can expect the MANA price prediction for 2025 to surface at $4.66. This translates into a hike percentage of 111.53%, the second lowest one from the tables above.
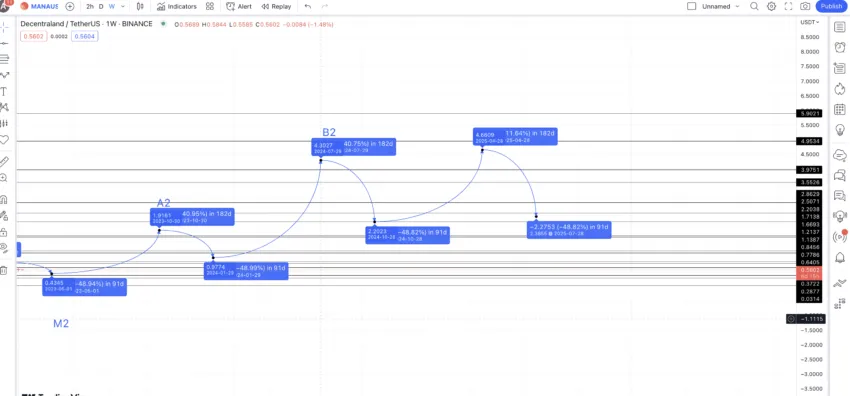
Note: We resorted to a lower growth percentage as after reaching almost $4.5 in 2024, long-term holders might consider getting out. Hence, the 2025 high could be a bit less aggressive. Still, we expect the MANA price prediction for 2025 to be higher than that of 2024.
The next low, or the Decentraland price prediction low in 2025, could drop to $2.386.
Projected ROI from the current level: 813%
Decentraland (MANA) price prediction 2030
Outlook: Very bullish
From the 2025 low, we can expect the next high to follow again a price hike of 131.61% — the third lowest growth percentage — as there will be new players and the onset of the bull market in sight. Therefore, D2 could surface at $5.53. It would, therefore, take some doing for MANA to breach its all-time high and a strong resistance level of $5.90.
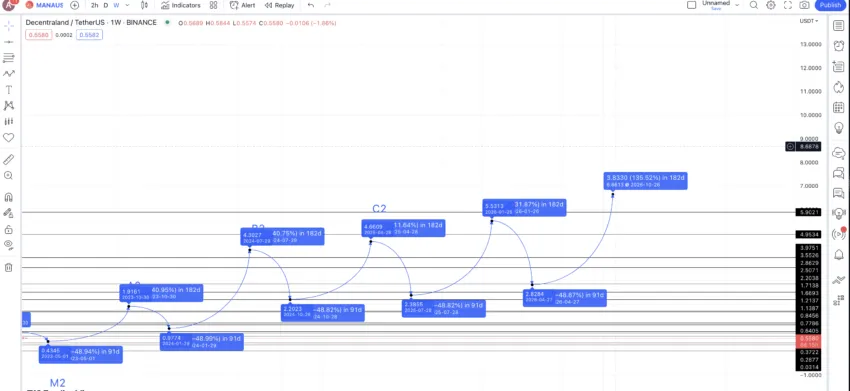
The Decentraland price prediction low for 2026 could then go as low as $2.82. The next high from this level could go as high as 135.36% (fourth lowest growth percentage). This would place the 2026 high at $6.66. Hence, we expect the price of MANA to breach its all-time high in 2026.
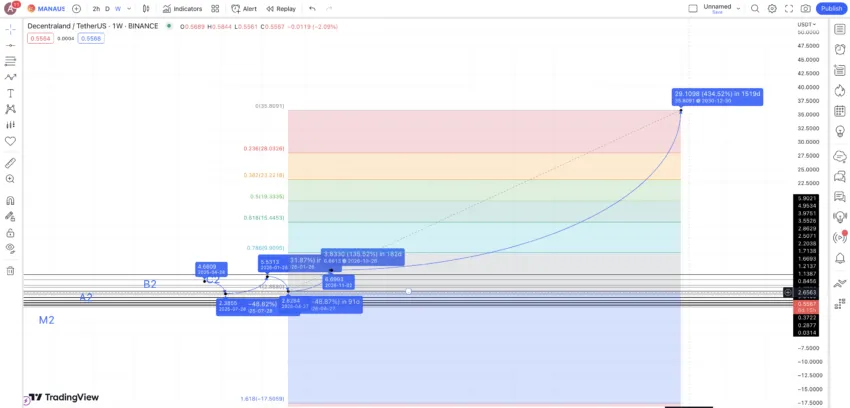
Now that we have the 2026 low and the 2026 high, we can use the Fib levels to extrapolate the prices till 2030. This extrapolation might not be completely accurate, but it does paint a picture regarding the MANA price prediction till 2030. This puts the Decentraland price forecast for 2030 at $35.81.
Projected ROI from the current level: 6894%
Decentraland fundamentals
OVER, one of the largest DeFra (Decentralized Infra) services, has also partnered with Decentraland, heightening the expectations of prospective MANA token investors.
Did you know? The OVER and Decentraland partnership happened across a four-day digital event that saw a record number of participants — roughly 49,000
Back to the Decentraland basics
Decentraland is a one-stop digital marketplace for content creators nestled within a decentralized virtual reality platform. It is a full-fledged world with land, collectibles, and avatars.
MANA is the native currency of Decentraland and is an ERC-20 token. Think of it as the official currency of this digital and virtual world, capable of being used for trading, purchasing land, and other services. Additionally, Decentraland boasts a dual-token ecosystem, with LAND — an ERC-721 token — being the second one. LAND tokens are more like non-fungible tokens with values dependent on exclusivity and user sentiments.
“Why is Decentraland is diff to FaceBook. – Content is hosted by multiple people/servers around the world, (no central kill switch)”
MattyVerse, Founder of The Meta Key: X
Here are some additional Decentraland-specific insights:
- MANA tokens can also serve as governance tokens. Users can convert them to wMANA (Wrapped MANA) and commit them for voting via the Decentraland DAO.
- The ecosystem comprises three layers: consensus, content, and real-time. This allows developers, regular users, and NFT enthusiasts to interact with the platform seamlessly.
- Esteben Ordano and Ariel Meilch are the brains behind Decentraland.
- The entire ecosystem comprises 90,601 pieces of LAND, both private and public.
If you are a LAND enthusiast, here is a map that you can refer to for easy understanding.
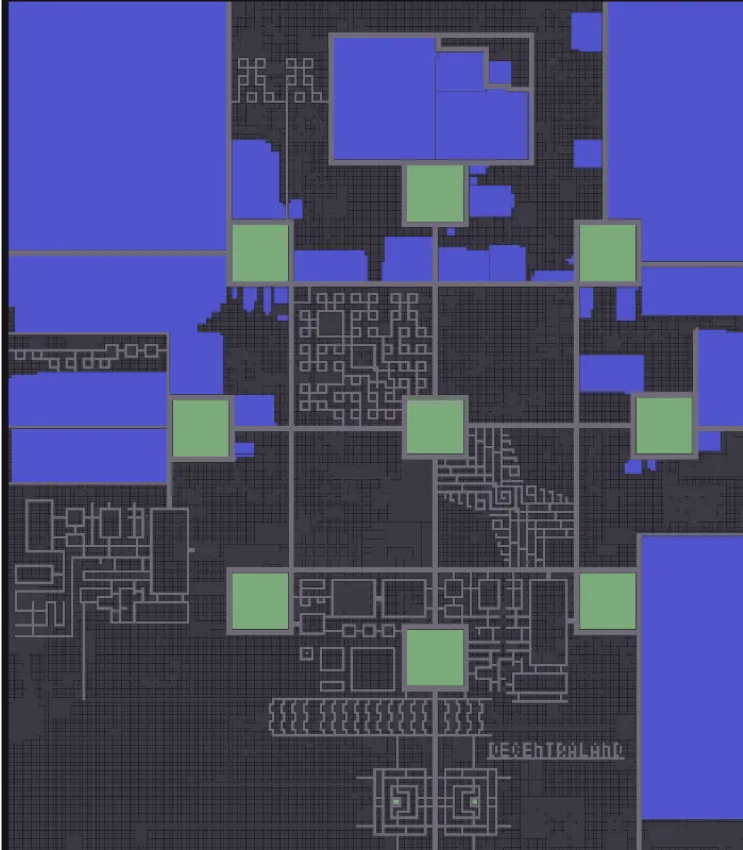
Dark grey areas are private and tradable LAND parcels, whereas the purple ones are DISTRICTS or themed communities. These aren’t for sale. Large green areas are PlAZAS, attract high footfall, and aren’t available for sale. Areas/Lines in light grey are ROADS and are also not meant for sale.
Decentraland tokenomics
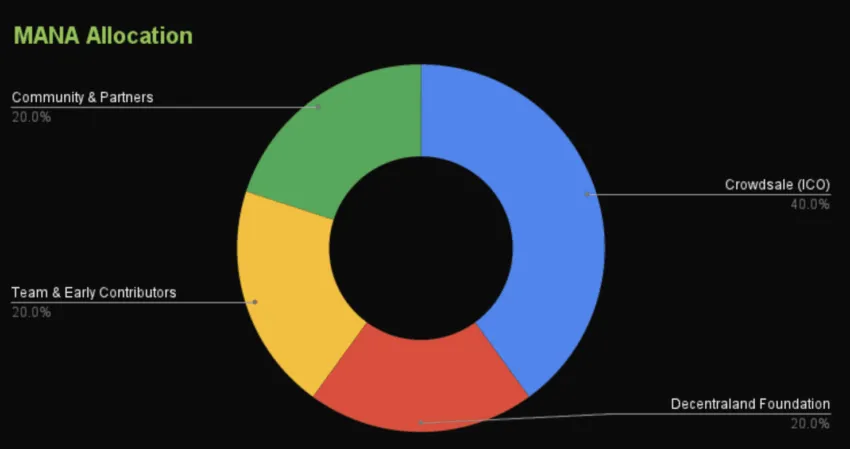
Decentrland’s MANA was shelled out as part of an Initial Coin Offering in 2017. Note that 40% of the initial supply was distributed as part of an ICO, whereas three chunks of 20% went out as team allocation, community incentives, and development team or, rather, an early contributor allocation.
Coming to the total supply, 2.19 billion MANA tokens exist, with almost 600 million already burned courtesy of LAND auctions. At present, close to 85% of the total supply makes the circulating supply. Decentraland even has a 2.5% burn cap set to keep a tab on the growing supply.
Is the Decentraland price prediction model accurate?
This Decentraland price prediction model considers the fundamentals, tokenomics, on-chain metrics, and technical analysis of this feature-laden metaverse and its native tokens. As such, we consider it to be as accurate as possible in a dynamic and often volatile crypto market. However, for each of these price levels to hold, the NFT marketplace and the market cap relevant to Decentraland must continue to grow and onboard new users into web3.
Disclaimer: This information is not financial advice. Cryptocurrency investments are speculative and involve significant risks. Conduct your own research and consult with a financial advisor before investing.
Frequently asked questions
Does Decentraland have a future?
How much will MANA be worth in 2030?
How much will Decentraland cost in 2025?
Can MANA reach $100 dollars?
Disclaimer
In line with the Trust Project guidelines, the educational content on this website is offered in good faith and for general information purposes only. BeInCrypto prioritizes providing high-quality information, taking the time to research and create informative content for readers. While partners may reward the company with commissions for placements in articles, these commissions do not influence the unbiased, honest, and helpful content creation process. Any action taken by the reader based on this information is strictly at their own risk. Please note that our Terms and Conditions, Privacy Policy, and Disclaimers have been updated.