


The GALA price broke down from a short-term horizontal support level and is approaching its all-time low region.
The readings from both the daily and six-hour timeframes are bearish, supporting the continuation of the drop.
GALA Decreases Below Long-Term Resistance
The GALA price has fallen under a descending resistance line since the beginning of the year. A similar decrease has been seen in Bitcoin and the rest of the crypto market. Most recently, the line caused a rejection on August 6 (red icon). The price has fallen since and is still trading below the descending resistance line.
If the decrease continues, the all-time low region at $0.0155 will be expected to provide support. The area is 28% below the current price. On the other hand, GALA can increase by 45% in the event of a breakout. The $0.0320 area will be expected to provide resistance in that case.
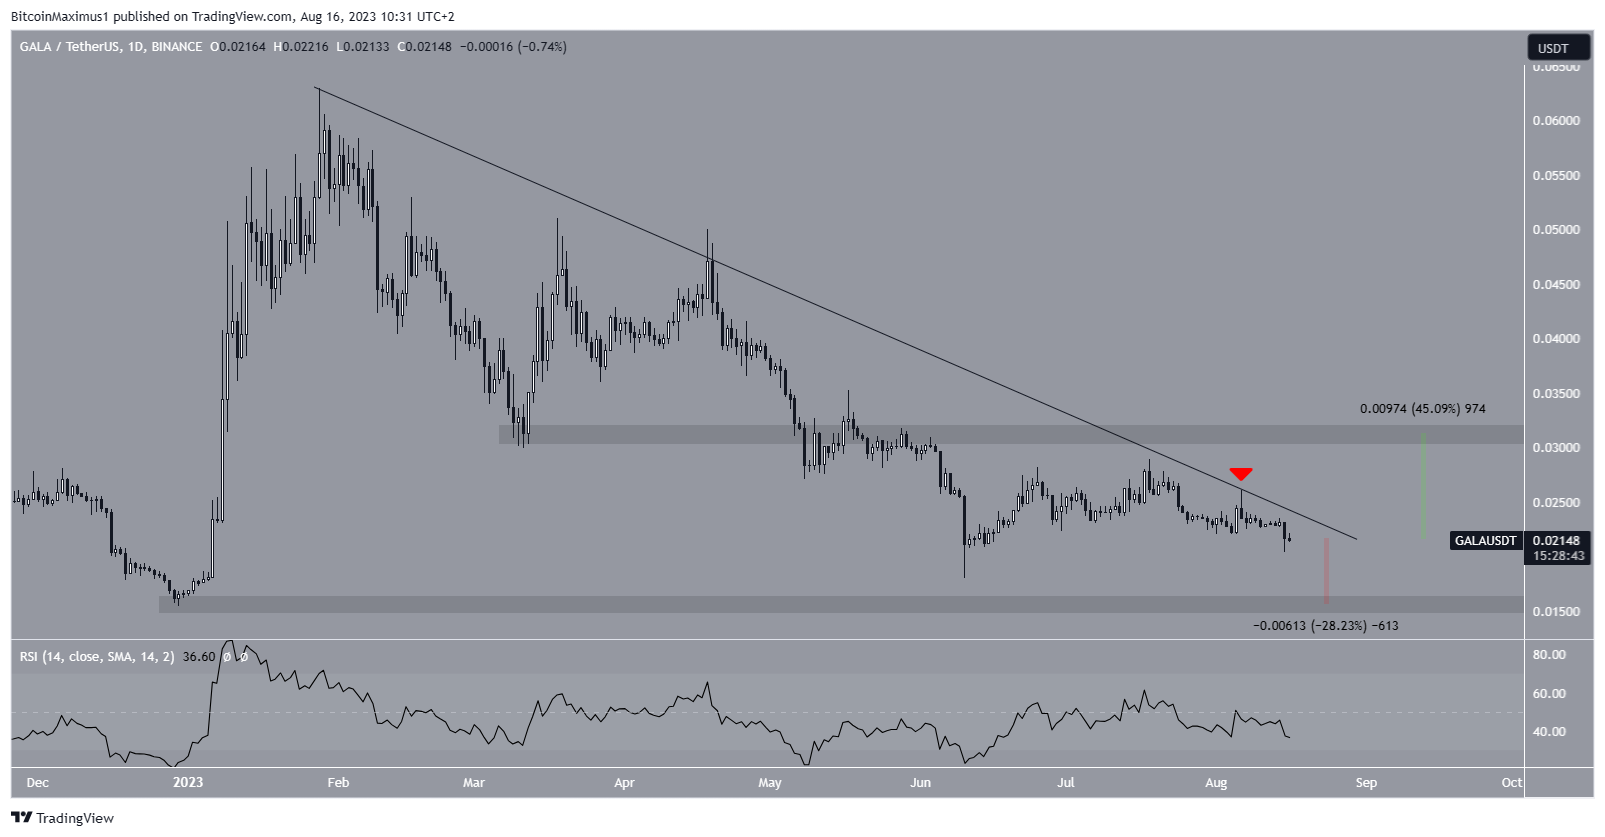
The daily RSI is bearish, indicating that the continuing decrease is the most likely future price scenario. With the RSI as a momentum indicator, traders can determine whether a market is overbought or oversold and decide whether to accumulate or sell an asset.
Bulls have an advantage if the RSI reading is above 50 and the trend is upward, but if the reading is below 50, the opposite is true. The indicator is below 50 and falling, both signs of a bearish trend.
GALA Price Outlook: Breakdown Could Catalyze Significant Drop
The technical analysis from the six-hour chart aligns with the daily timeframe’s bearish readings. The main reason for this is the ongoing breakdown from the $0.0225 horizontal area. The area had acted as support for nearly 60 days before today’s breakdown.
Therefore, it is possible that the price has begun its descent towards the $0.0150 all-time low region.
The RSI also supports this possibility. At the time of the breakdown, the RSI fell below 50 (red icon) and has fallen since, a sign of a bearish trend.
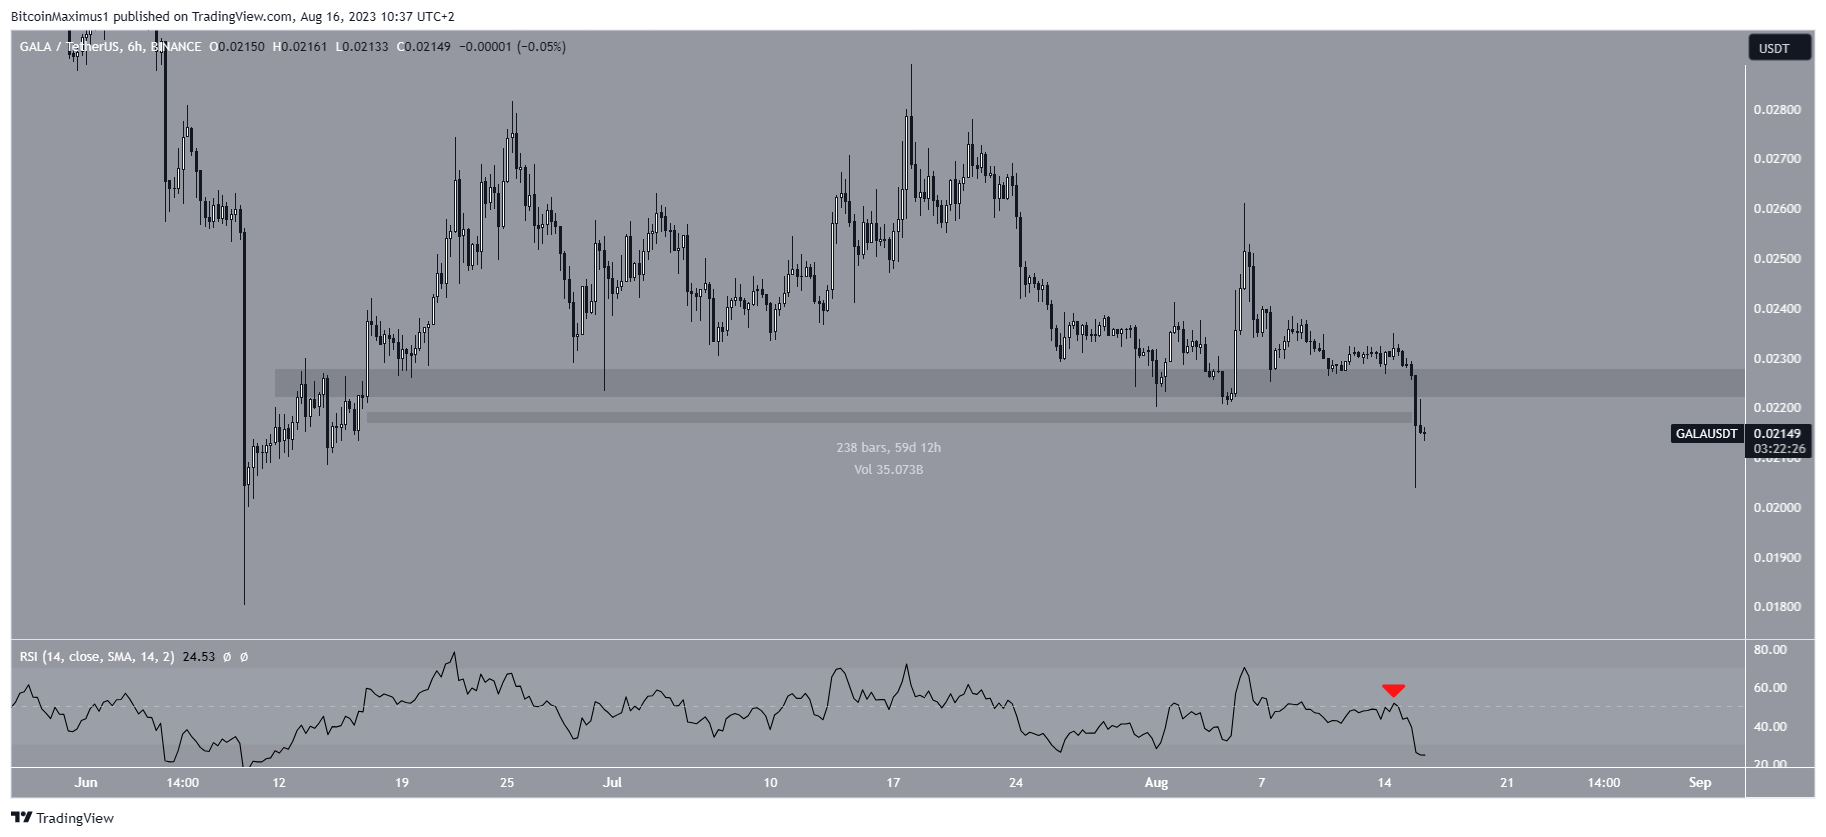
Despite this bearish GALA price prediction, reclaiming the $0.0225 horizontal area will mean that at least the short-term trend is bullish.
In that case, a breakout from the descending resistance line and a 45% increase to the next resistance at $0.0320 will likely be the future price scenario.
Read More: Top 11 Crypto Communities To Join in 2023
For BeInCrypto’s latest crypto market analysis, click here.


