The Polygon (MATIC) price has fallen since reaching a local high of $0.98 on November 14.
The decrease caused a deviation above an important horizontal area, validating it as resistance. How long will this decrease continue?
MATIC Reaches 700-Day Resistance
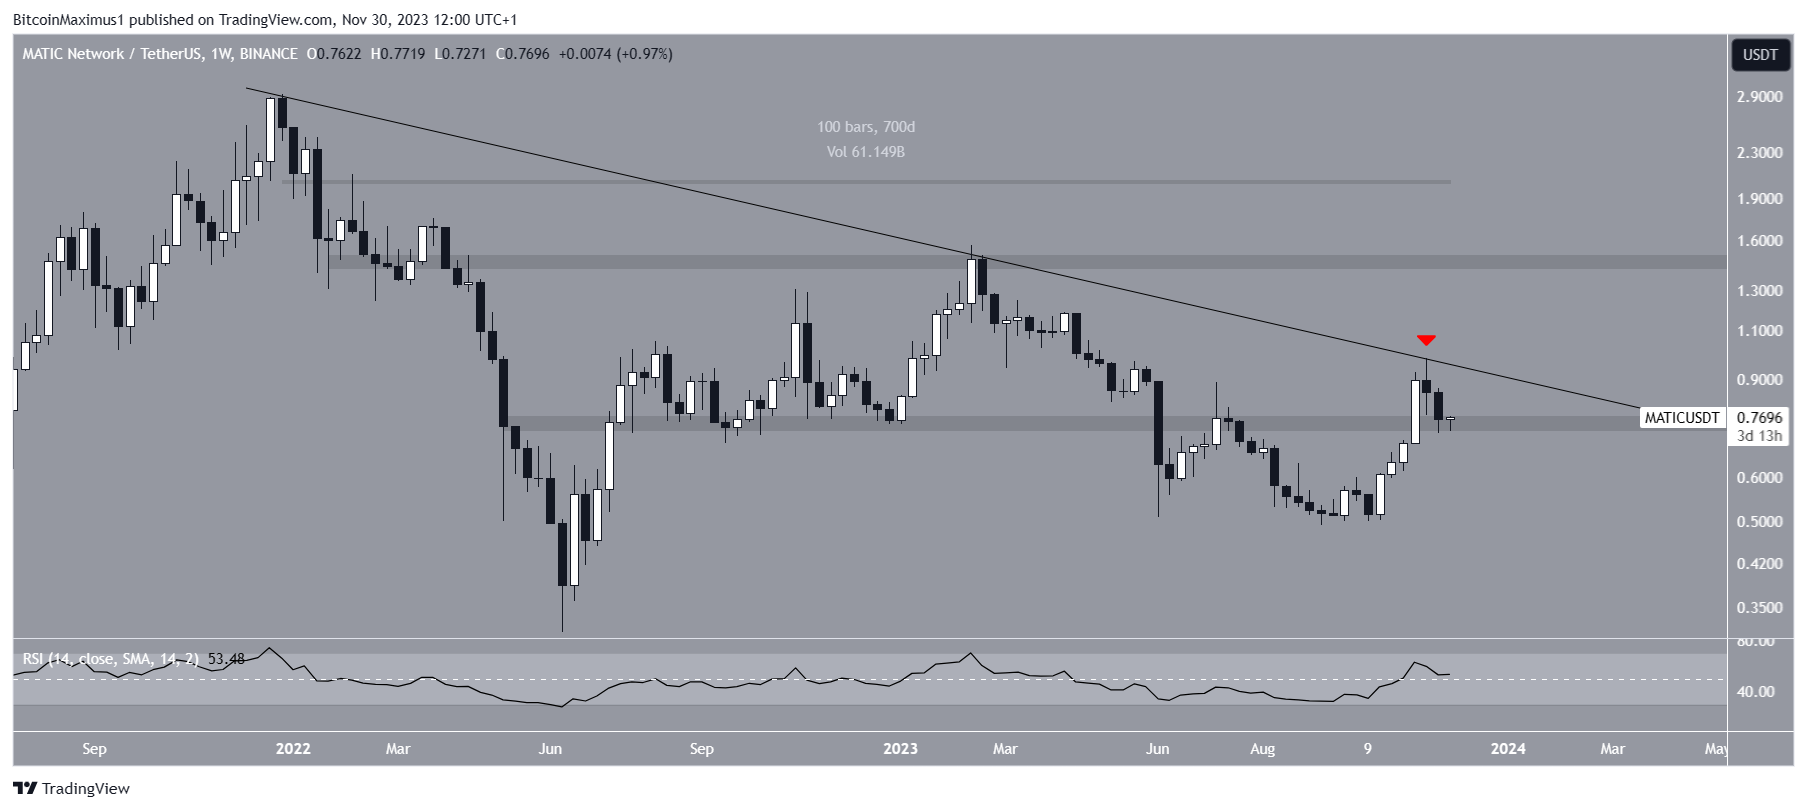
The weekly time frame technical analysis for MATIC shows that the price has decreased under a descending resistance trend line since its all-time high in December 2021.
The trend line has been in place for 700 days, causing a rejection two weeks ago (red icon).
Despite the rejection, MATIC trades inside a critical horizontal area, which has intermittently acted as support and resistance since April 2022.

Market traders use the Relative Strength Index (RSI) as a momentum indicator to identify overbought or oversold conditions and to decide whether to accumulate or sell an asset.
Readings above 50 and an upward trend indicate that bulls still have an advantage, whereas readings below 50 suggest the opposite.
The weekly RSI is increasing and is above 50, both signs of a bullish trend.
Read more: Polygon (MATIC) Price Prediction
MATIC Price Prediction – What’s the Trend’s Direction?
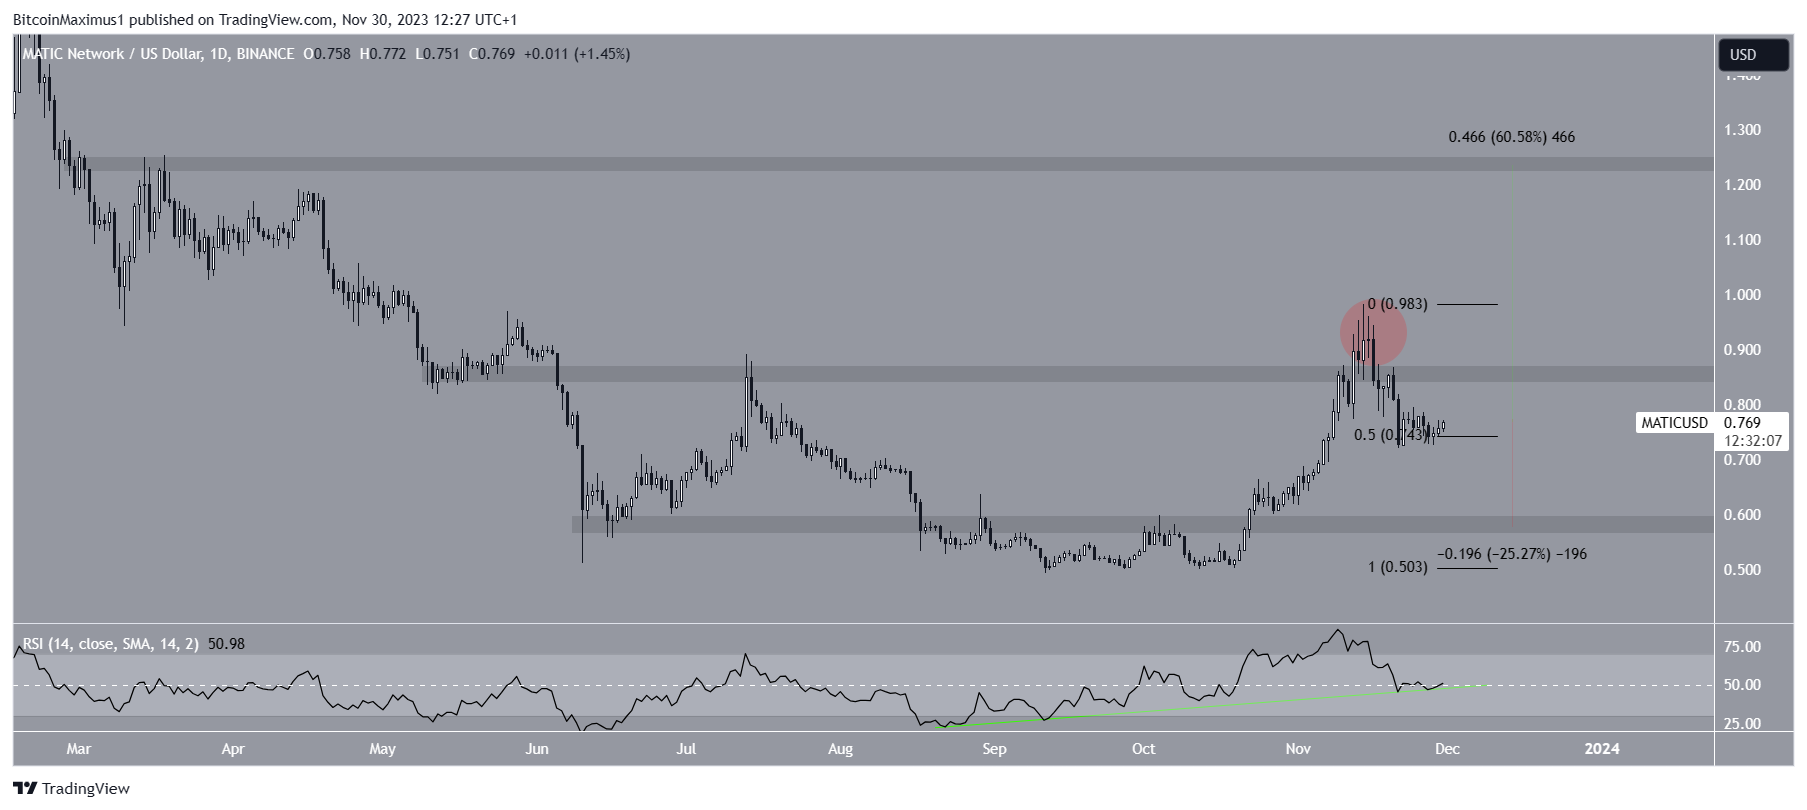
Similarly to the weekly time frame, the daily one gives a mixed outlook. The main reason is the deviation and subsequent drop below the $0.86 horizontal area. The area has intermittently acted as support and resistance since May 2023.
While the MATIC price moved above it on November 12, it failed to sustain its increase and fell afterward (red circle).
The ensuing decrease took the MATIC price to the 0.5 Fib retracement support level of $0.74.
The daily RSI also gives a mixed reading. While the indicator is falling, it still holds above the bullish divergence trend line (green) in place since August.
Therefore, the reaction to the $0.74 support level will be key in determining the future trend. Cryptocurrency trader CWTrades believes that a short-term bounce at the level is likely.
If the MATIC price bounces at the $0.74 support level and moves above $0.85, it can increase by 60% and reach the next resistance at $1.25.

On the other hand, a breakdown from the $0.74 support level will likely trigger a 25% MATIC price decrease to the next closest support at $0.60.
Read more: 9 Best AI Crypto Trading Bots to Maximize Your Profits
For BeInCrypto’s latest crypto market analysis, click here.
Disclaimer
In line with the Trust Project guidelines, this price analysis article is for informational purposes only and should not be considered financial or investment advice. BeInCrypto is committed to accurate, unbiased reporting, but market conditions are subject to change without notice. Always conduct your own research and consult with a professional before making any financial decisions. Please note that our Terms and Conditions, Privacy Policy, and Disclaimers have been updated.


