The Ripple (XRP) price, after moving sideways for nearly four weeks, raises questions about potential upcoming volatility.
This period of stability in Ripple’s price may indicate a pending significant market move, leading to speculations of “the calm before the storm.”
XRP’s Bullish Price Goal Set Around $0.75
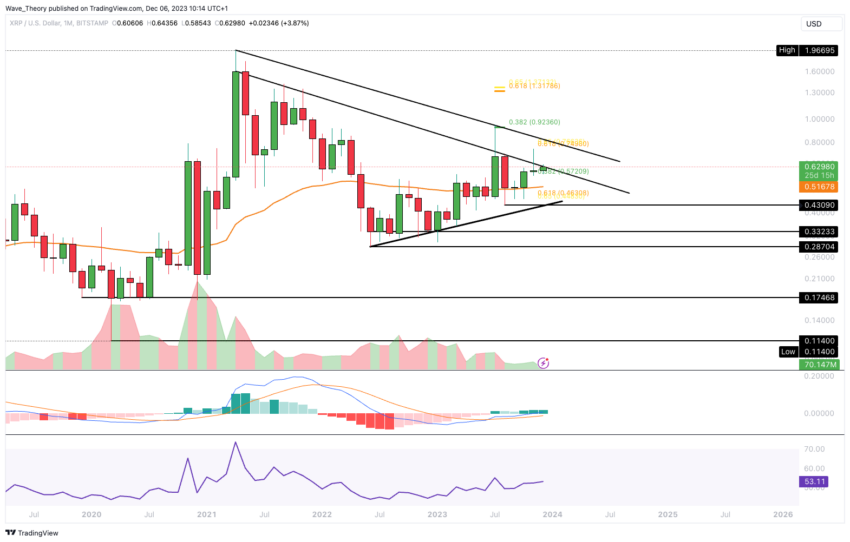
In the monthly chart, Ripple’s price maintains a bullish trend. For three months, the Moving Average Convergence Divergence (MACD) histogram has been ascending bullishly, and the MACD lines have crossed a bullish direction.

Concurrently, the Relative Strength Index (RSI) is positioned in neutral territory. The next bullish target for Ripple is around the $0.75 mark, a level corresponding to the golden ratio where Ripple faced a bearish rejection in November.
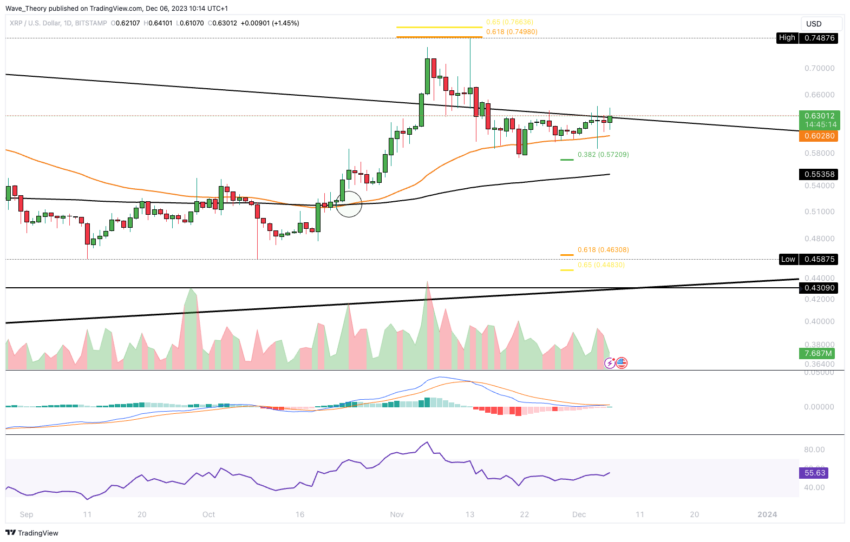
Ripple Price Rebounds from $0.57, the 0.382 Fibonacci Support Level
Following a bearish rejection at the Golden Ratio resistance near $0.75, XRP corrected the 0.382 Fibonacci support at about $0.57. Ripple achieved a bullish rebound there, indicating a potential re-targeting of the Golden Ratio resistance around $0.75.
Read More: What’s Next for the Ripple (XRP) Price Prediction
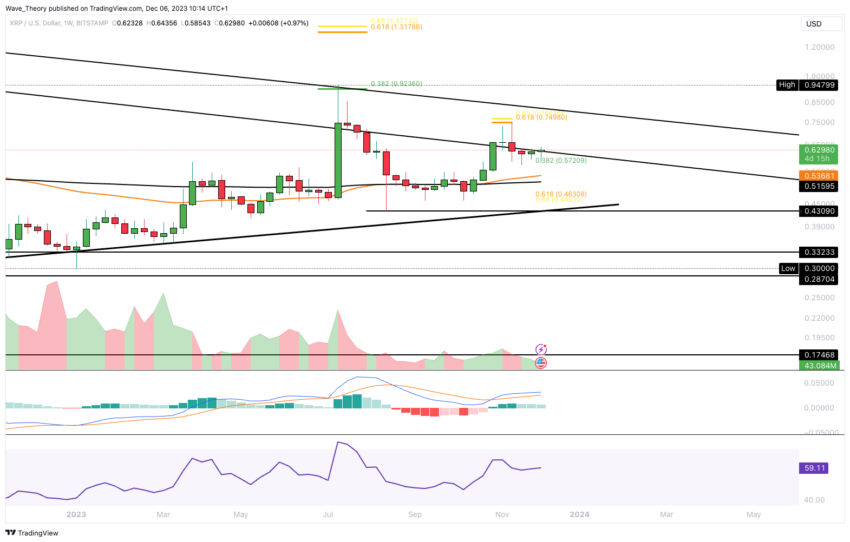
In the weekly chart, the indicators are mixed. The Exponential Moving Averages (EMAs) display a golden crossover, supporting a medium-term bullish trend. The MACD lines have also crossed bullishly, while the Relative Strength Index (RSI) remains neutral. However, the MACD histogram has been trending bearishly downward for three weeks.

Despite these mixed signals, the trajectory seems more inclined towards a rise to the Golden Ratio near $0.75. Should Ripple surpass this resistance, the next significant Fibonacci resistances are anticipated at approximately $0.923 and $1.35.
Ripple’s Daily Chart Shows Predominantly Bullish Indicators
Should XRP breach the 0.32 Fibonacci (Fib) support level at approximately $0.57 in a downward, bearish direction, Ripple’s next substantial Fib support is anticipated to be around $0.46.
Moreover, the daily chart indicators for Ripple present a generally bullish outlook. A golden crossover is observed here, affirming a bullish trend in the short to medium term. The Moving Average Convergence Divergence (MACD) histogram shows an upward trend, suggesting that the MACD lines might soon experience a bullish crossover.

The Relative Strength Index (RSI) is also positioned in neutral territory, adding to this mixed yet cautiously optimistic scenario.
Ripple Exhibits Clear Sideways Trend in 4H Chart Analysis
In the 4-hour (4H) chart, the XRP indicators are predominantly bullish. The Relative Strength Index (RSI) is in neutral territory, indicating a balanced market condition. Additionally, the Moving Average Convergence Divergence (MACD) lines have crossed in a bullish direction, and the MACD histogram is also trending higher, reinforcing the bullish sentiment.
The Exponential Moving Averages (EMAs) exhibit a golden crossover, further confirming the short-term bullish trend. Despite these bullish indicators, Ripple’s price movement in the 4H chart shows a clear sideways pattern. Since mid-November, Ripple has been trading within a range between $0.574 and $0.65.

This consolidation phase suggests Ripple might soon break out of this sideways movement, potentially leading to significant volatility.
Given the bullish signals from the various technical indicators, the likelihood appears to be more inclined towards an upward movement. However, as with market predictions, this remains subject to change based on evolving market dynamics.
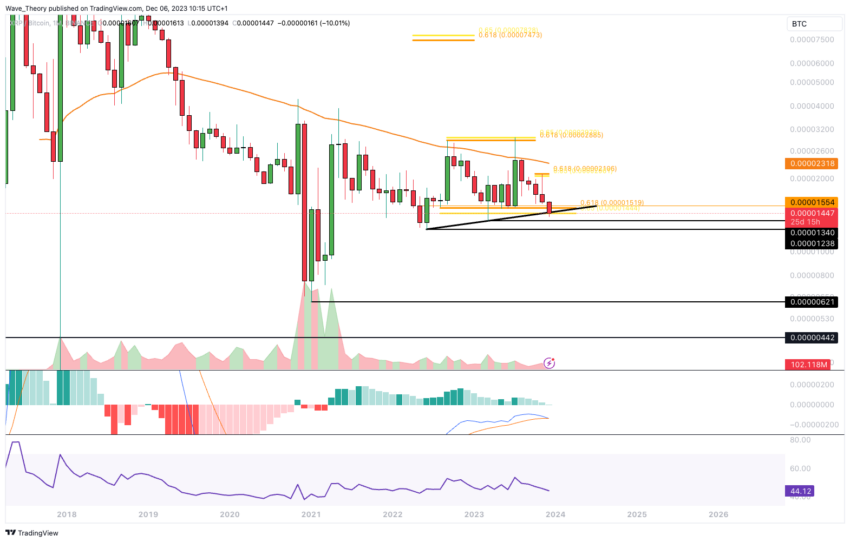
XRP May Breach 0.0000155 BTC Golden Ratio Support Against Bitcoin, Bearishly
In its trading pair with Bitcoin (BTC), XRP is facing the possibility of a bearish break below the golden ratio support level, which is situated at approximately 0.0000155 BTC. Should this bearish movement occur, Ripple’s next significant support levels are expected to be in the range of 0.0000124 BTC to 0.0000134 BTC.
Moreover, the Moving Average Convergence Divergence (MACD) histogram has shown a bearish trend for several months. This prolonged downward trend in the histogram suggests that the MACD lines are now close to a bearish crossover, a potential indicator of continued bearish momentum.

Meanwhile, the Relative Strength Index (RSI) remains in neutral territory, not providing any definitive bullish or bearish signals at the moment. This neutrality in the RSI amidst the bearish MACD indicators and potential support level breakdowns indicates a complex and uncertain market scenario for Ripple against Bitcoin.
Investors and traders should monitor these developments closely, as they could significantly impact Ripple’s price dynamics in the BTC trading pair.
Read More: Top 11 Crypto Communities To Join in 2023
Disclaimer
In line with the Trust Project guidelines, this price analysis article is for informational purposes only and should not be considered financial or investment advice. BeInCrypto is committed to accurate, unbiased reporting, but market conditions are subject to change without notice. Always conduct your own research and consult with a professional before making any financial decisions. Please note that our Terms and Conditions, Privacy Policy, and Disclaimers have been updated.

