


The Tezos (XTZ) price has increased by 130 percent since the beginning of November. The upward move has been showing signs of weakness and a corrective movement is expected.
On December 11, several altcoins posted double-digit losses, lead by Matic Network (MATIC), which decreased by 70 percent. XTZ initially acted in the same way but has since recouped most of the lost value.
Full-time trader @coldbloodshill outlined the XTZ price and stated that he had the same expectations for this coin as what he did for MATIC — meaning that he expects another price decrease.
Nice $XTZ exit pump.
Shorting it with the same expectations as $MATIC. pic.twitter.com/8X8bHb1Fha
— Cold Blooded Shiller (@ColdBloodShill) December 11, 2019
Will XTZ dump in a similar way to MATIC? Continue reading below in order to find out.
Long-Term
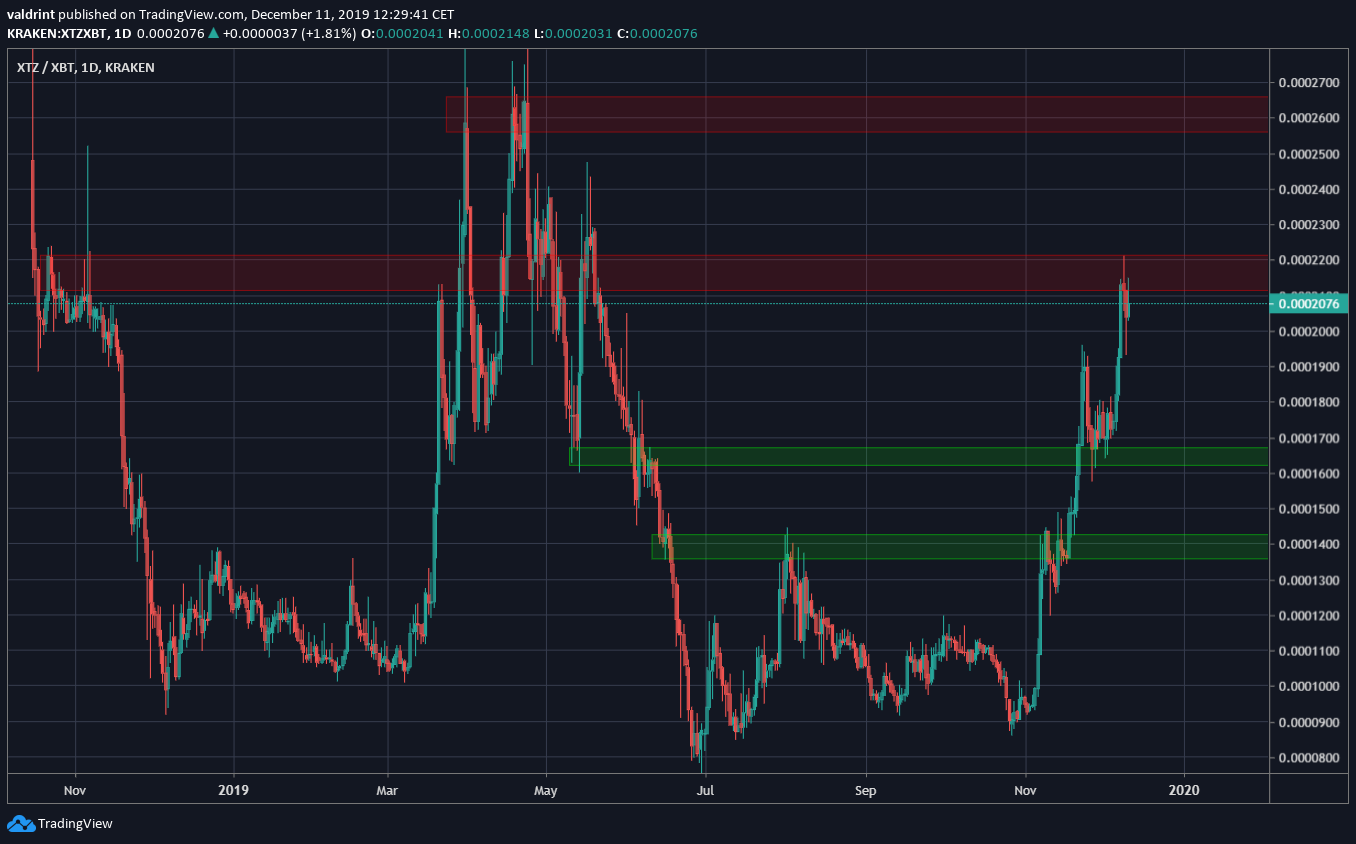
At the beginning of November, the XTZ price began an upward move from a low of 900 satoshis. It broke through the 1400 and 1650 satoshi resistance areas without much trouble before returning to validate the latter as support.
It has continued its upward movement in December and reached the 2200 satoshi resistance area before retracing slightly. The next resistance area is found at 2600 satoshis.
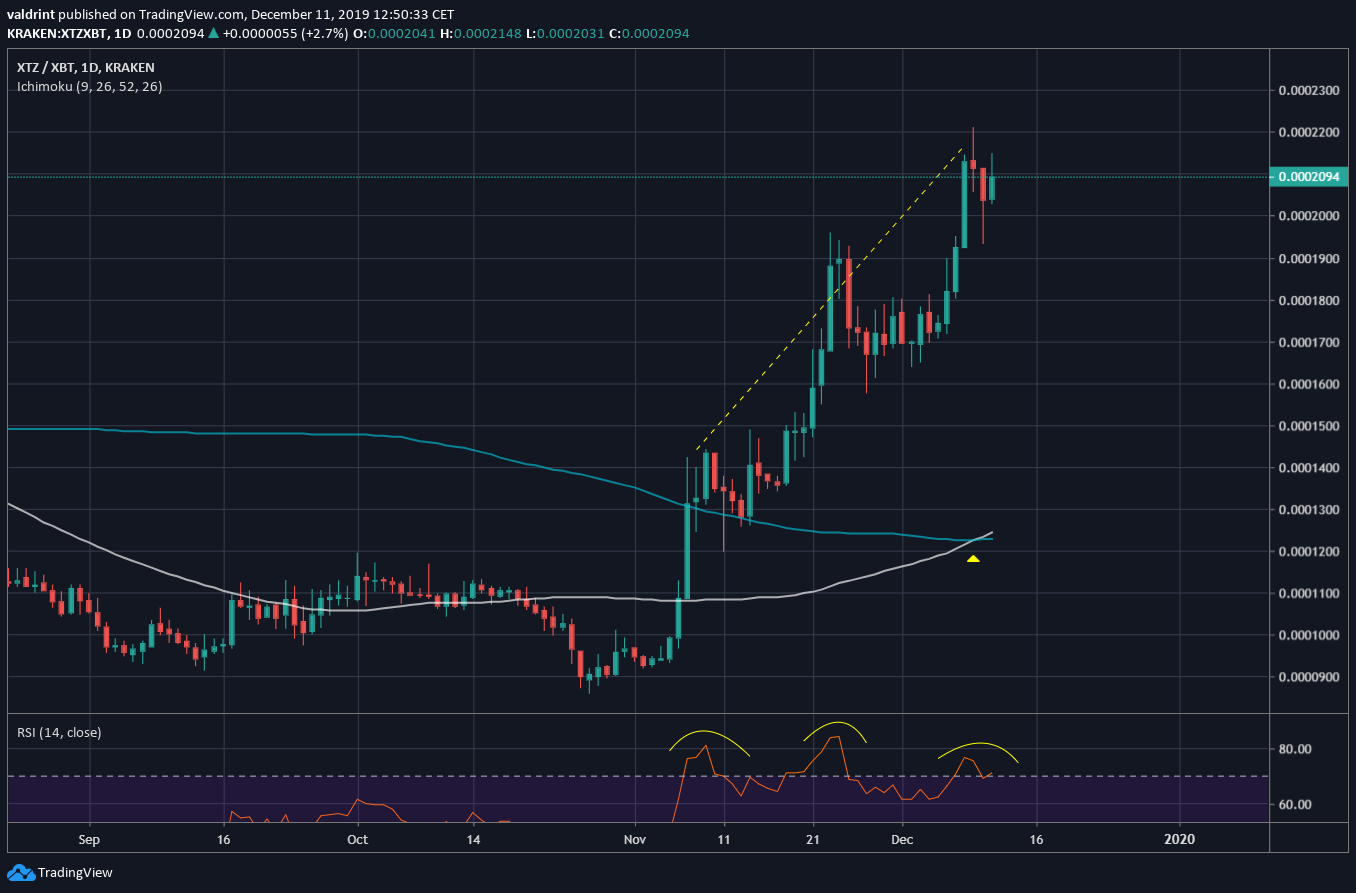
The 100- and 200-day moving averages (MA) have made a bullish cross. This is often a sign that an uptrend has begun and the first time it has transpired with XTZ.
However, the RSI has generated a bearish divergence. Furthermore, it has created a head and shoulders pattern, which suggests that it will soon initiate a strong downward move.
Therefore, while XTZ is definitely in an uptrend, it has increased significantly without retracing and has started to show weakness — signaling that a correction is near.
Future Tezos Movement
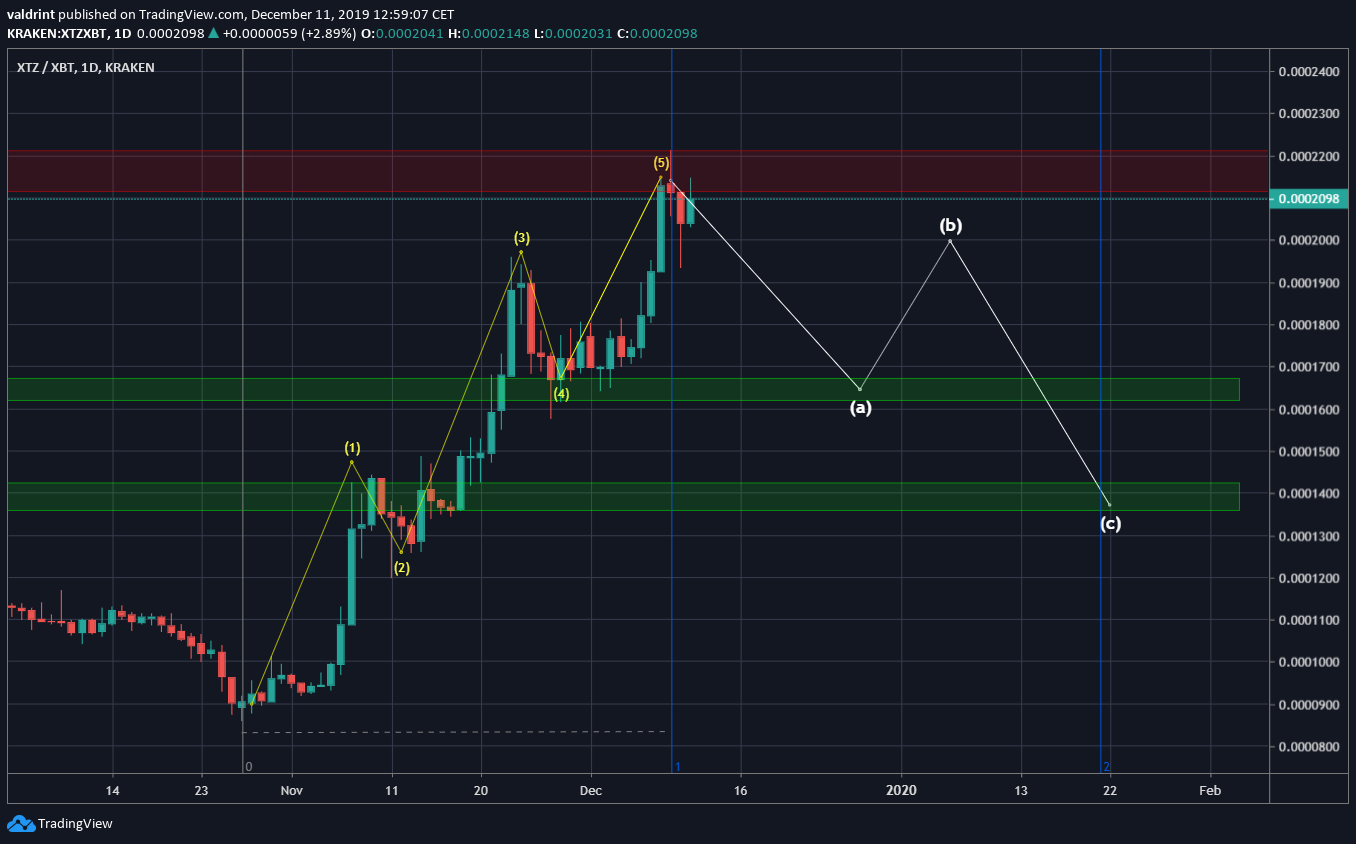
The XTZ price has likely finished a five-wave Elliot formation. What follows afterward is usually an A-B-C correction. If the correction takes the same amount of time as the upward move, we could see the price finishing it at the end of January 2020.
A customary movement would be for the A wave to finish near the support area at 1650 satoshis before the ensuing B wave retraces upward towards 2000 satoshis and the C wave finishes at 1400 satoshis.
Afterward, XTZ should resume its upward movement.
To conclude, the XTZ price has increased significantly since the beginning of November. However, the rally seems to have lost its strength and a corrective period is expected.
