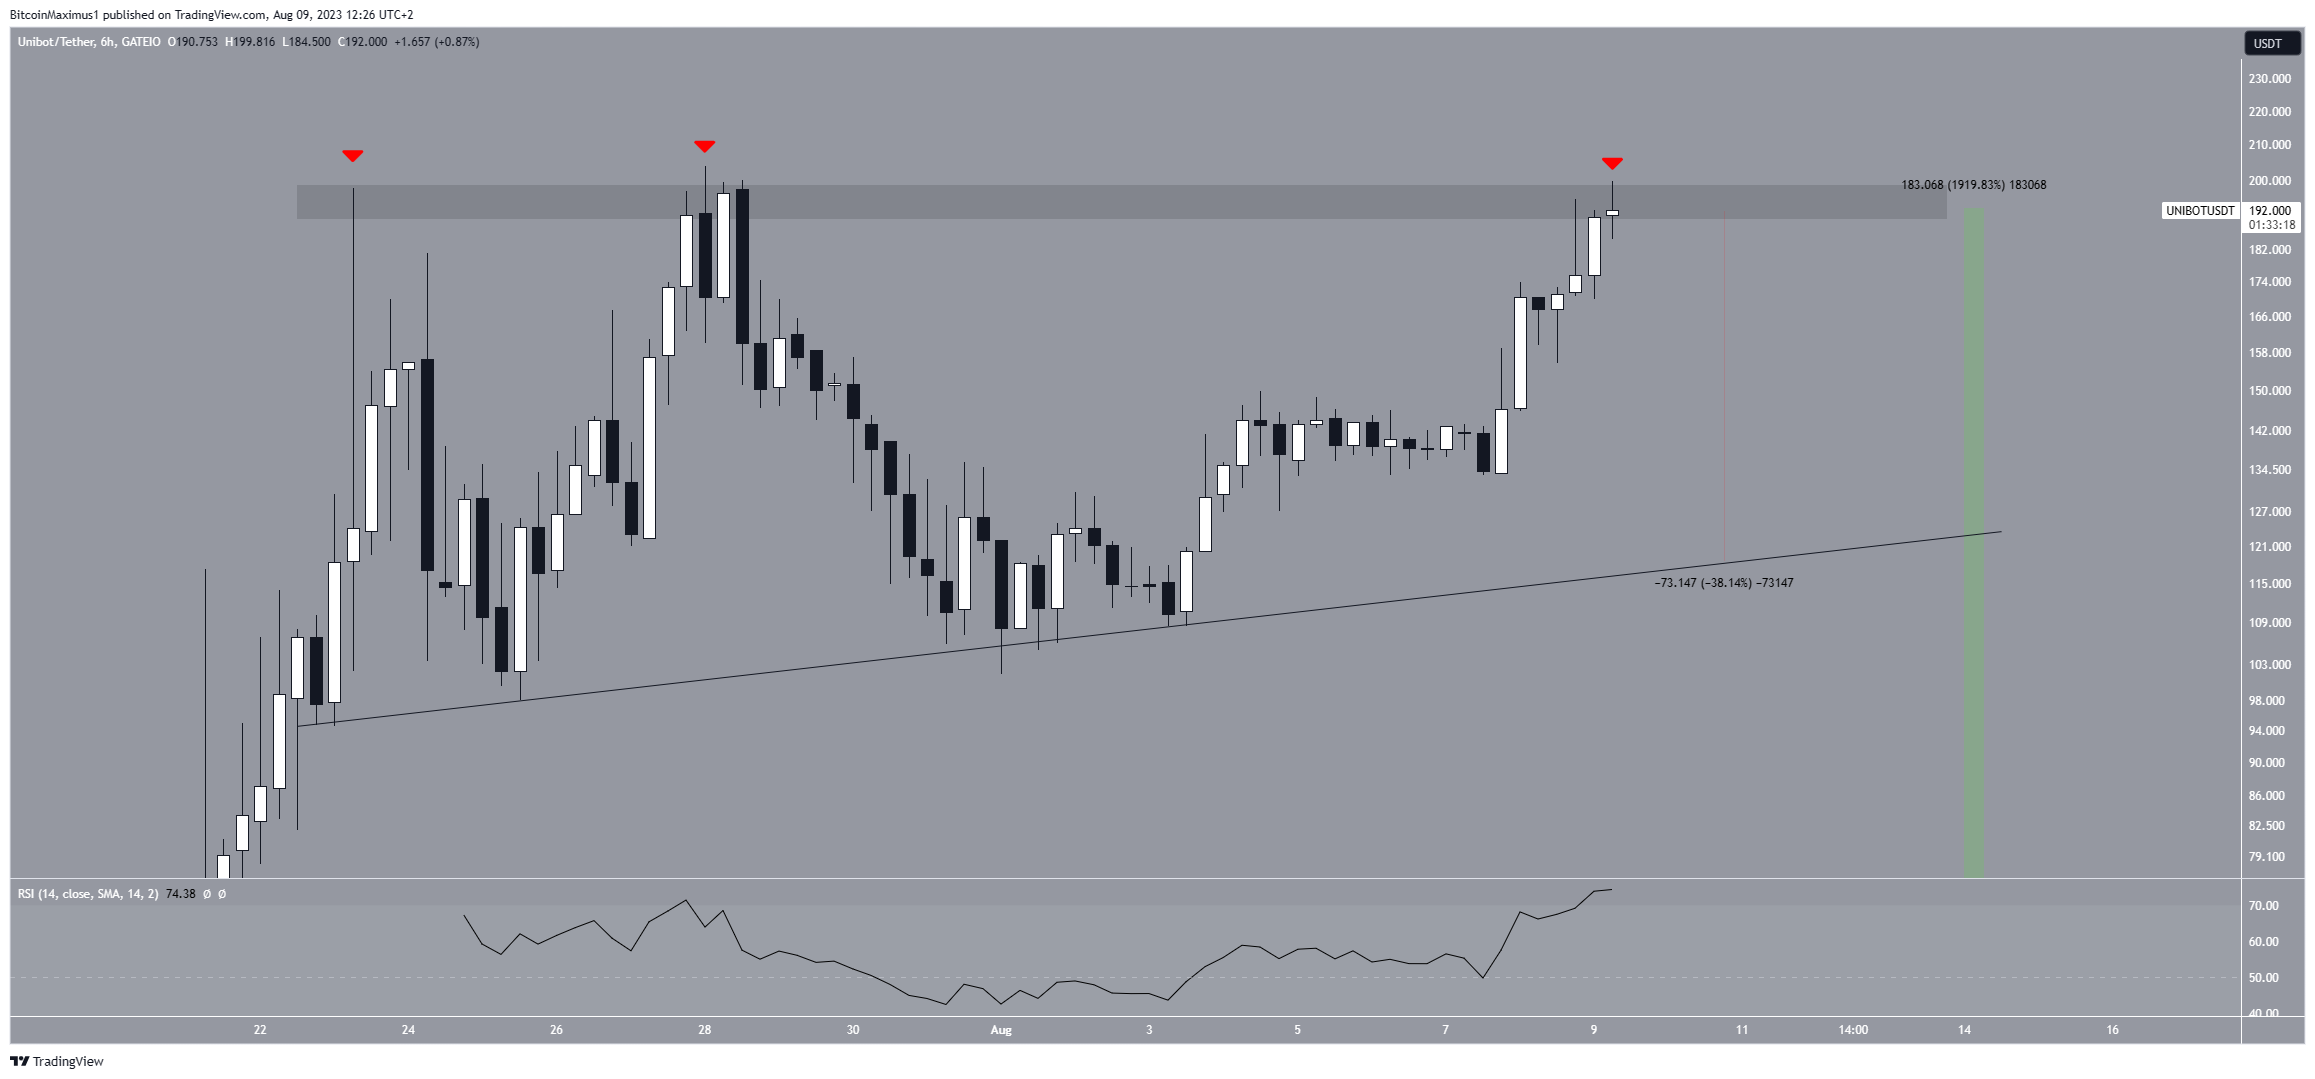
The UNIBOT price is making its third attempt at breaking out above the $200 resistance area. Doing so will likely lead to a new all-time high.
Since resistances weaken each time they are touched, an eventual breakout from this area is the most likely future price scenario.
Will UNIBOT Price Reach Yet Another New All-Time High?
The UNIBOT price has increased by slightly more than 1,900% since the day of its listing on July 21. The price reached a new all-time high of $203 during the increase on July 28.
However, the increase could not be sustained. The UNIBOT price has validated the $200 area as resistance by reaching it three times (red icons). It is currently making an attempt at breaking out above it.
The reaction to the $200 area has seemingly created a triple-top pattern. This is considered a bearish pattern that usually leads to downward movements. However, the price has also followed an ascending support line since July 23.
Combined with the $200 resistance creates an ascending triangle, considered a bullish pattern. So, there are contrasting patterns in different timeframes.
The line is currently at $120, a 38% drop measuring from the current price. So, a significant decrease could occur in case of a rejection.

The RSI supports continuing the increase and the possibility of a breakout. Market traders use the RSI as a momentum indicator to identify overbought or oversold conditions and to decide whether to accumulate or sell an asset.
Readings above 50 and an upward trend indicate that bulls still have an advantage, whereas readings below 50 suggest the opposite. The RSI is above 50 and increasing, both signs of a bullish trend.
UNIBOT Price Prediction: What Happens if it Breaks Out?
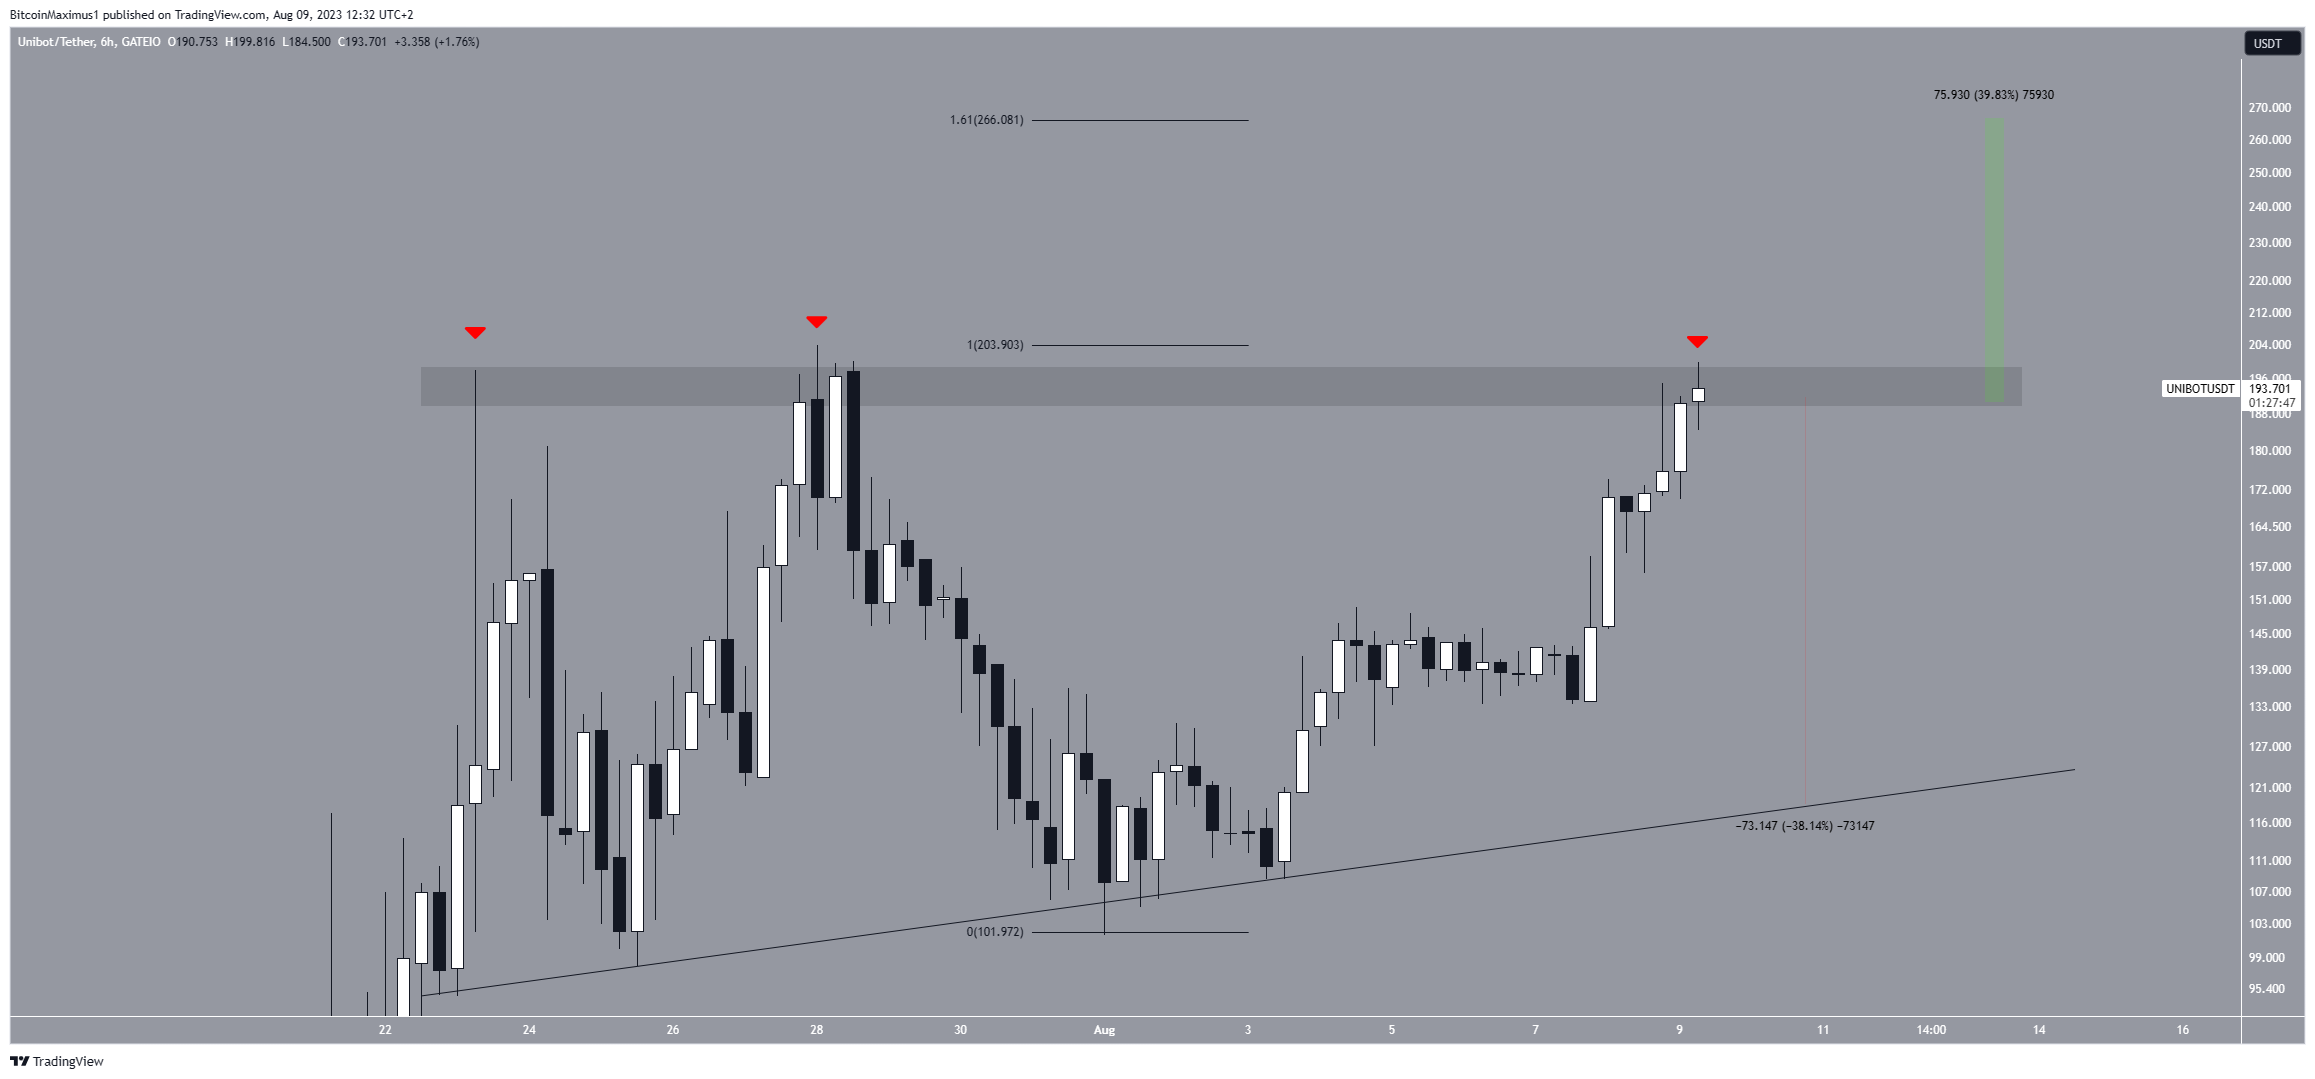
Since the UNIBOT price is close to an all-time high, external Fib retracements are required to determine potential targets for the future in case the price breaks out. The principle behind Fibonacci retracement levels suggests that after a considerable price movement in one direction, the price will retrace or return partially to a previous price level before continuing in its original direction.
These levels can also be utilized to identify the highest point of potential future upward movements.
So, if UNIBOT breaks out, the next resistance will be at $266, created by the 1.61 external Fib retracement. This would be a nearly 40% increase measuring from the current price.
A daily close above the $200 area will be required to confirm the breakout.

Therefore, the future UNIBOT trend will be determined by whether the price gets rejected from the $200 area or breaks out. In case of a rejection, a 38% drop to the ascending support line at $120 will be expected.
However, if UNIBOT breaks out, it can increase by 40% to the next resistance at $266.
Read More: 6 Best Copy Trading Platforms in 2023
For BeInCrypto’s latest crypto market analysis, click here
Trusted
Disclaimer
In line with the Trust Project guidelines, this price analysis article is for informational purposes only and should not be considered financial or investment advice. BeInCrypto is committed to accurate, unbiased reporting, but market conditions are subject to change without notice. Always conduct your own research and consult with a professional before making any financial decisions. Please note that our Terms and Conditions, Privacy Policy, and Disclaimers have been updated.


