


The TRON (TRX) price has fallen since its yearly high of $0.094 on July 22. The decrease validated the $0.090 horizontal area as resistance.
The reaction to the current ascending support line will likely determine if the future trend is bullish or bearish.
TRON Gets Rejected at Long-Term Resistance
The weekly timeframe technical analysis shows that the TRON price has increased following an ascending support line since November 2022. The line has been validated numerous times so far.
On July 22, the TRX price reached a new yearly high of $0.094. While this seemingly caused a breakout above the $0.090 resistance area, the price created a long upper wick (red icon) and then swiftly fell below the area.
Currently, the TRX price trades at the ascending support line at $0.074. A breakdown from the line could trigger a 14% drop to the next horizontal support at $0.065.
On the other hand, a strong bounce can cause the price to reach the $0.090 resistance area again, moving upwards by 20%.
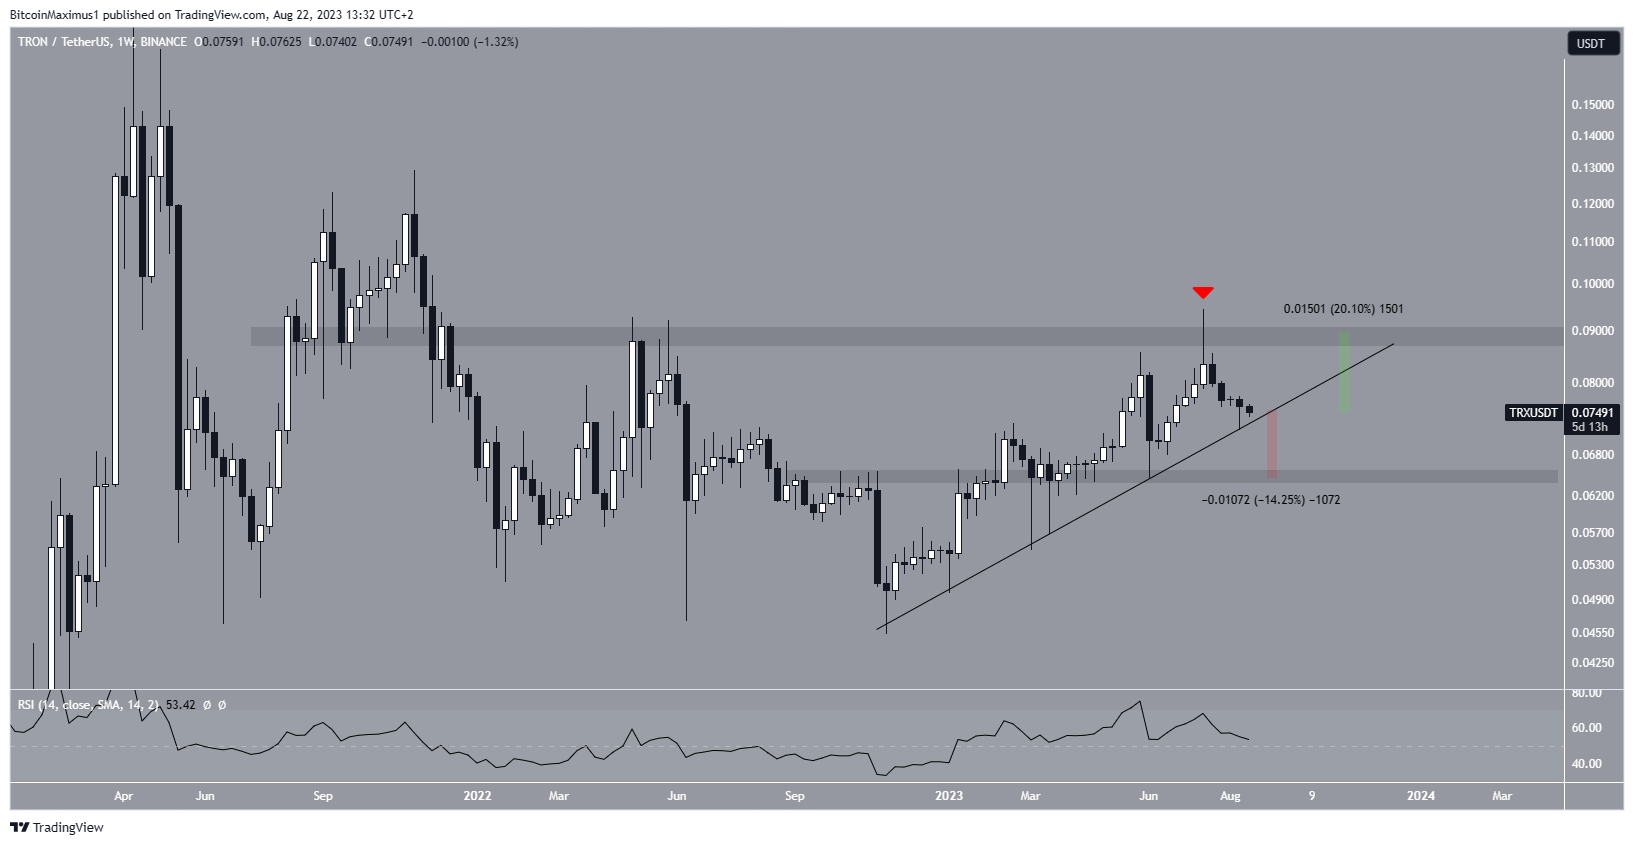
The weekly RSI is undetermined. When evaluating market conditions, traders use the RSI as a momentum indicator to determine if a market is overbought or oversold and to decide whether to accumulate or sell an asset.
If the RSI reading is above 50 and the trend is upward, bulls still have an advantage, but if the reading is below 50, the opposite is true. While the RSI is falling, it is still above 50. These mixed signs provide an undetermined trend.
TRX Price Prediction: Retracement Before Bounce?
The short-term six-hour timeframe also gives conflicting information.
The breach of an ascending support trendline that had been established since June 9 is a bearish sign. The breakdown occurred on July 30, coinciding with the fifth anniversary of the TRON Mainnet release.
Although this is deemed a bearish scenario, a substantial drop has already occurred since the breakdown. Moreover, the wave count suggests that the correction could be complete. Technical analysts employ the Elliott Wave theory as a means to identify recurring long-term price patterns and investor psychology, which helps them determine the direction of a trend
If the entire movement since the June 4 high is an A-B-C correction, then wave A:C had a 1:1 ratio, and the correction is already complete.
However, for this count to remain valid, the TRX price has to hold above the minor horizontal support area at $0.072, which also coincides with the previously outlined ascending support line.
The targets from the six-hour timeframe are the same as the daily one. Reaching the previous ascending support line will necessitate a 20% increase, aligning with the $0.090 resistance area.
However, in the event of a TRX price breakdown, analysts anticipate an expected 14% drop to $0.065.
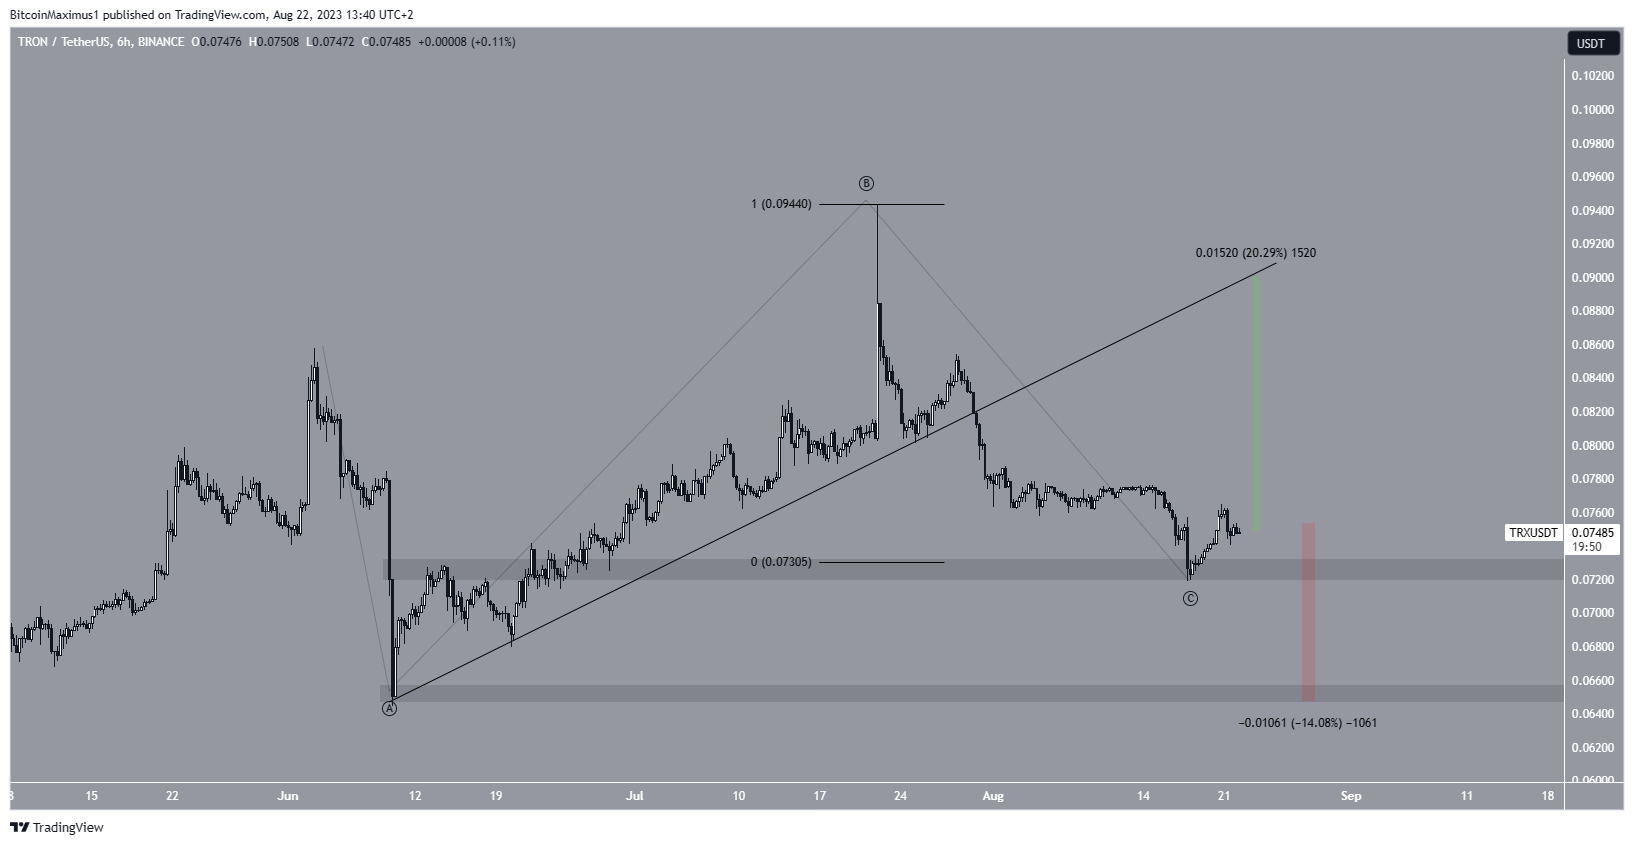
Therefore, the TRX price prediction will determine whether the price bounces or breaks down from the ascending support line. A bounce can cause a 20% increase, while a breakdown could cause a 14% drop.
For BeInCrypto’s latest crypto market analysis, click here


