The DOGE price significantly declined last week, invalidating a previous breakout from a long-term descending resistance line.
The invalidation of the breakout is a strong bearish sign that could lead to a further decline. So, it is imperative that the DOGE price holds above $0.060 for the possibility of a bounce to remain intact.
Dogecoin Price Invalidates Breakout After Sharp Fall
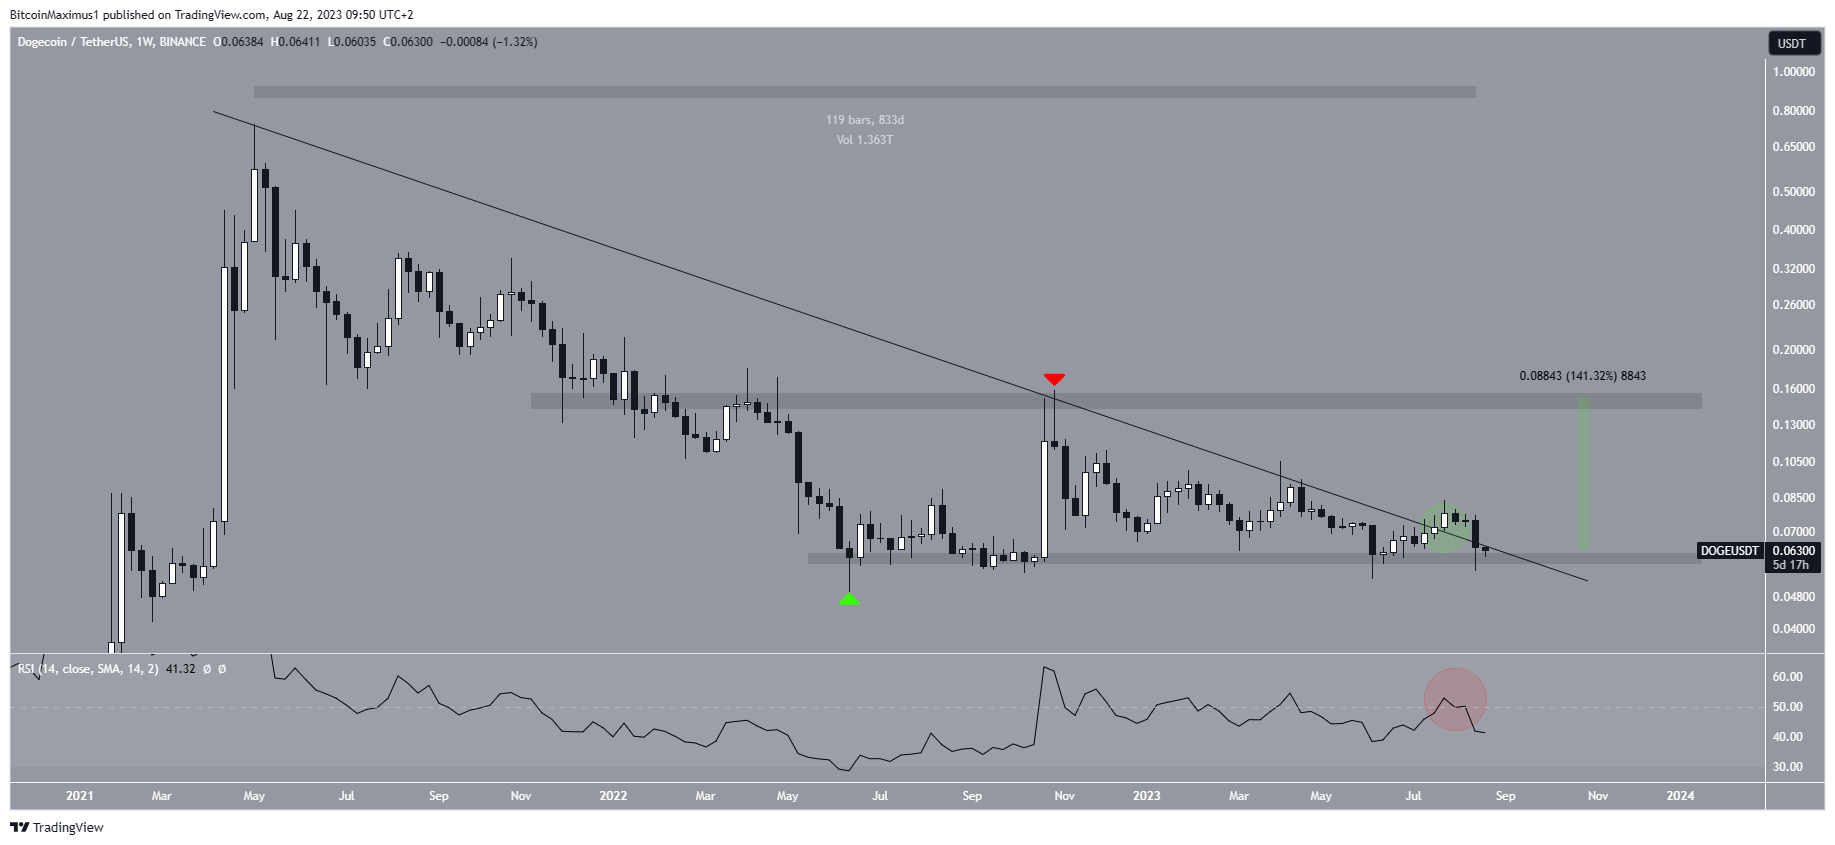
The weekly time frame technical analysis shows that the meme coin has fallen under a descending resistance line since May 2021, when it reached its all-time high price of $0.739. During the descent, DOGE fell to a low of $0.049 in June 2022 before bouncing (green icon). The bounce validated the $0.060 area as support.
After several unsuccessful attempts, the DOGE price seemingly broke out from the line in July 2023 (green circle). However, it could not sustain the breakout. Rather than initiating an upward movement, Dogecoin fell below the line last week and returned to the $0.060 support area.
Discounting the failed breakout, the resistance line has been in place for 833 days. Sad news hit yesterday after the iconic Dogecoin mascot “Balltze” passed away after a battle with Leukemia.
The next closest resistance area is at $0.150, an increase of 140% measuring from the current price. At the current price, 1,357,129 DOGE tokens will be required to become a millionaire if the price returns to its all-time high.

The weekly Relative Strength Index (RSI) gives a bearish reading. When evaluating market conditions, traders use the RSI as a momentum indicator to determine if a market is overbought or oversold and to decide whether to accumulate or sell an asset.
If the RSI reading is above 50 and the trend is upward, bulls still have an advantage, but if the reading is below 50, the opposite is true.
While the indicator briefly moved above 50 during the time of the breakout (red circle), it has fallen below the line now. This is a sign of a bearish trend and confirms that the breakout was illegitimate.
DOGE Price Prediction: Will Bullish Pattern Save Trend?
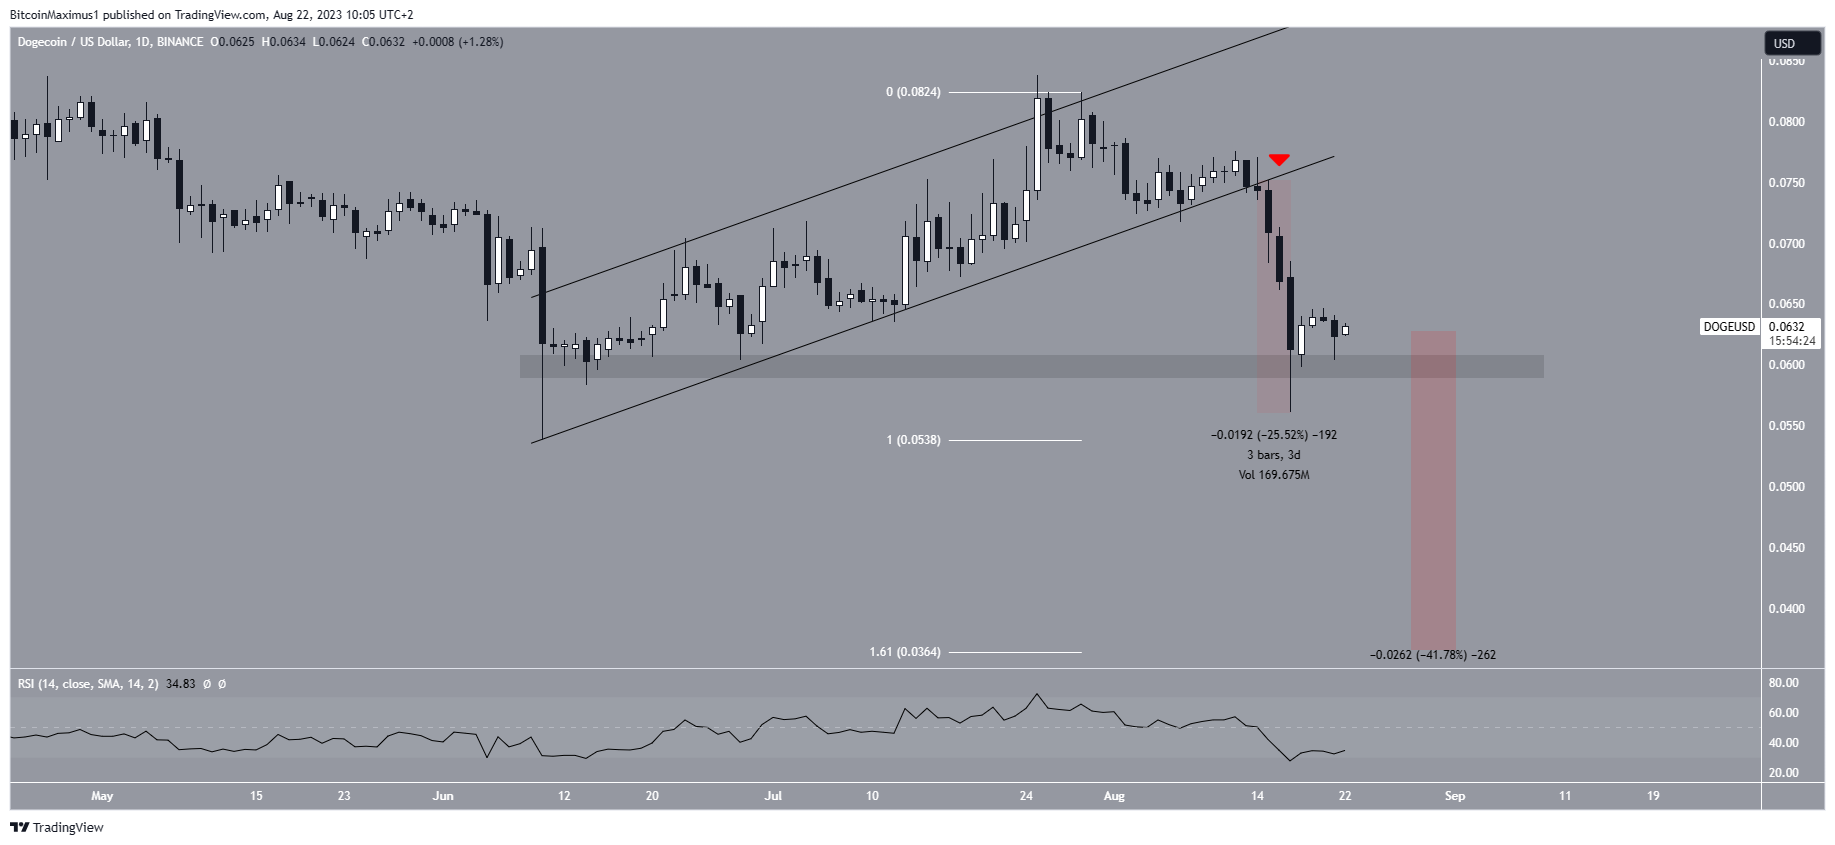
Similarly to the weekly timeframe, the daily one offers a bearish price prediction. This is mainly because DOGE broke down from an ascending parallel channel on August 15 (red icon).
The breakdown suggested that the previous increase was corrective, and a downward movement had begun. The drop was swift, and DOGE fell by 25% in only three days.
The DOGE price is currently trading above the $0.060 horizontal support area. It is possible that it created a double bottom pattern relative to the price in June. While this is considered a bullish pattern, no other bullish reversal signs exist.
While the RSI is increasing, it is still below 50, indicating an undetermined trend.

Therefore, the future DOGE price prediction will determine whether Dogecoin breaks down below $0.060 or breaks out from the resistance line. In case of a breakout, a 140% increase to the next resistance at $0.15 will be expected.
On the other hand, a breakdown could lead to a 42% drop to $0.036.
For BeInCrypto’s latest crypto market analysis, click here.
Disclaimer
In line with the Trust Project guidelines, this price analysis article is for informational purposes only and should not be considered financial or investment advice. BeInCrypto is committed to accurate, unbiased reporting, but market conditions are subject to change without notice. Always conduct your own research and consult with a professional before making any financial decisions. Please note that our Terms and Conditions, Privacy Policy, and Disclaimers have been updated.


