

TRON is a decentralized blockchain network focused on content distribution, gaming, identity management, and DeFi services. This TRX piece prediction will consider the blockchain’s fundamentals, tokenomics, key on-chain metrics, and technical analysis. What’s optimistic is that TRX, the native TRON token, exceeded our 2024 TRON price prediction level of $0.125 to form a high of $0.1772. Let us find out what it has to offer in 2025 and beyond.
KEY TAKEAWAYS
➤ TRON offers solid fundamentals. The blockchain supports DApps, smart contracts, and development activity ensuring content distribution seamless, creator-focussed, and decentralized.
➤ Regarding tokenomics, an aggressive coin-burning approach keeps the supply in line with the demand.
➤ TRX, the native crypto, exceeded our 2024 price prediction of $0.125 to form a high of $0.1772.
➤ Using a combination of technical and deep fundamental analysis, our 2025 TRX prediction puts the maximum price at $0.1914, with a 2030 maximum of $1.289. Minimum prices are $0.060 (2025) and $0.799 (2030), respectively.
- TRON (TRX’s) long-term price prediction until the year 2035
- TRON (TRX) price prediction 2023 (Successful)
- TRON (TRX) price prediction 2024 (Successful)
- TRON (TRX) price prediction 2025
- TRON (TRX) price prediction 2026
- TRON (TRX) price prediction 2027
- TRON (TRX) price prediction 2028
- TRON (TRX) price prediction 2029
- TRON (TRX) price prediction 2030
- TRON fundamental analysis
- TRON tokenomics
- Is the TRX price prediction model accurate?
- Frequently asked questions
TRON (TRX’s) long-term price prediction until the year 2035
Outlook: Bullish
Here is a table that captures the possible price prediction levels of TRX, projected highs and lows, all the way to 2035.
| Year | | Maximum price of TRX | | Minimum price of TRX |
| 2024 | $0.125 | $0.049 |
| 2025 | $0.1914 | $0.060 |
| 2026 | $0.185 | $0.05837 |
| 2027 | $0.30 | $0.23 |
| 2028 | $0.46 | $0.30 |
| 2029 | $0.686 | $0.42 |
| 2030 | $1.289 | $0.799 |
| 2031 | $1.54 | $1.20 |
| 2032 | $2.01 | $1.56 |
| 2033 | $2.71 | $2.11 |
| 2034 | $4.34 | $3.38 |
| 2035 | $5.64 | $3.49 |
Keep reading to learn how these levels were reached.
TRX short-term technical analysis
Even though several monthly and quarterly price analysis models were referred to, it is only appropriate to take a closer look at the short-term price expectations specific to TRX now that, in November 2024, the much-awaited bull run is finally here.
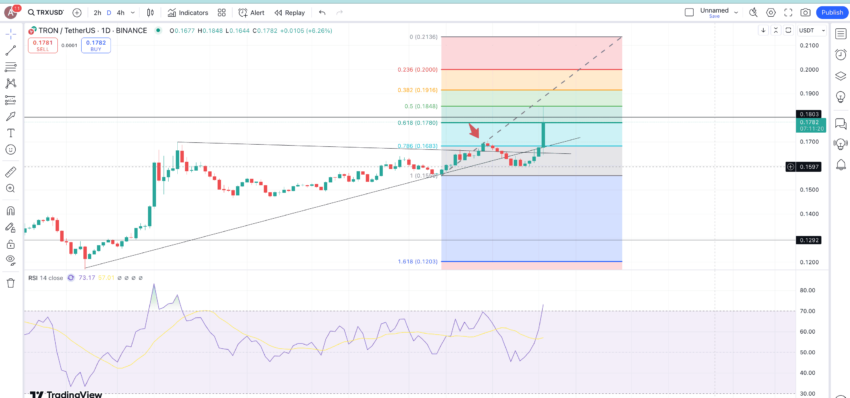
Per the chart above, TRX fooled many naysayers by presumably failing to capitalize on the ascending triangle’s bullishness. The Red arrow points at a false breakout, but TRX immediately retested the levels to finally break at $0.1655 and reach a high above $0.18.
If we consider the previous swing high and low while assuming the current high as the key resistance zone, it might seem that TRX has the legs to reach $0.2, provided the buying interest continues.
While things look promising in the short term, keep reading for a long-term analysis.
Long-term TRX price analysis
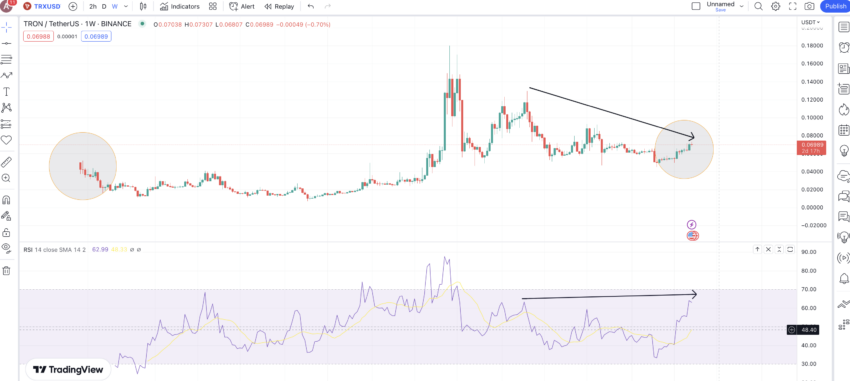
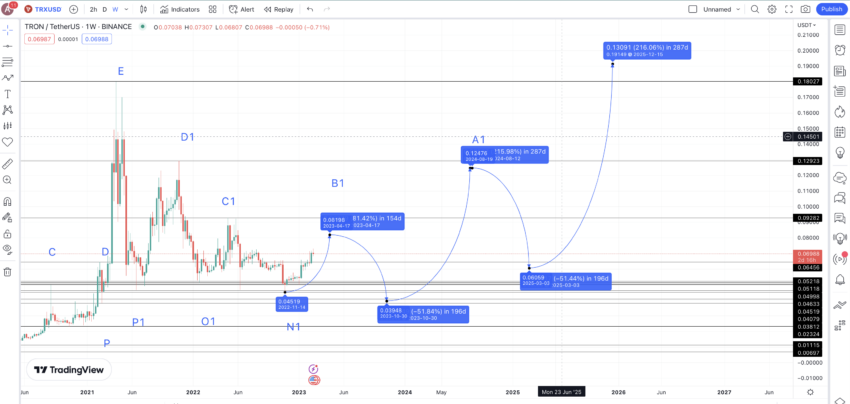
It is now time to use historical data to identify TRX’s key points of interest. For that, we relied on the weekly chart and located a few patterns.
Pattern identification
A clear pattern is visible on the weekly TRX-USDT chart. Notice how the left side of the chart is symmetrical with the right side. We start with highs, reach a peak, and then start seeing lower highs.
Notice that the chart’s extreme right has a slope similar to the extreme left, validating the supposed near-term conclusion of this pattern and the start of a new one. We have encircled the areas for your reference.
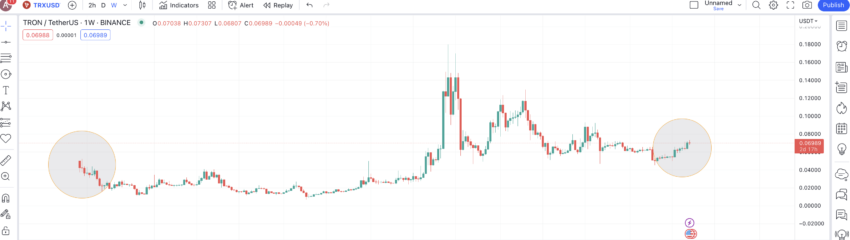
Also, notice that a bullish RSI divergence is in the works, showing that a new pattern might soon start, or TRX might chart a few new highs to have as many points on the right side of the chart as the left.
Let us locate all the crucial highs and lows on the chart to help us predict the next TRON price forecast levels.
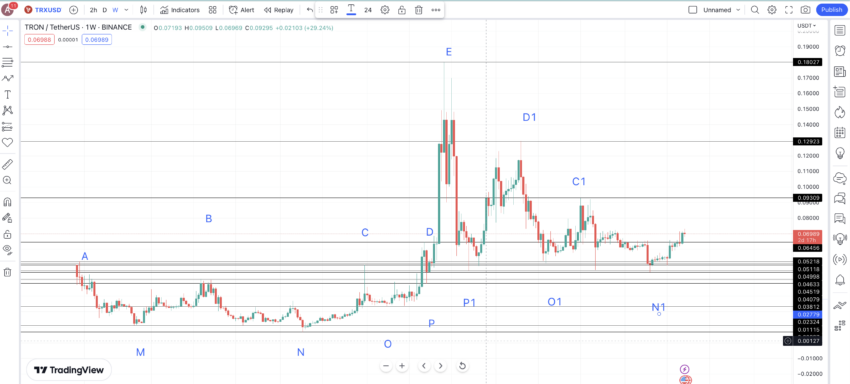
Price changes
Considering that the right side of the chart will continue progressing as B1, M1, and A1, we shall now locate the price changes across two paths: E to A and E to N1.
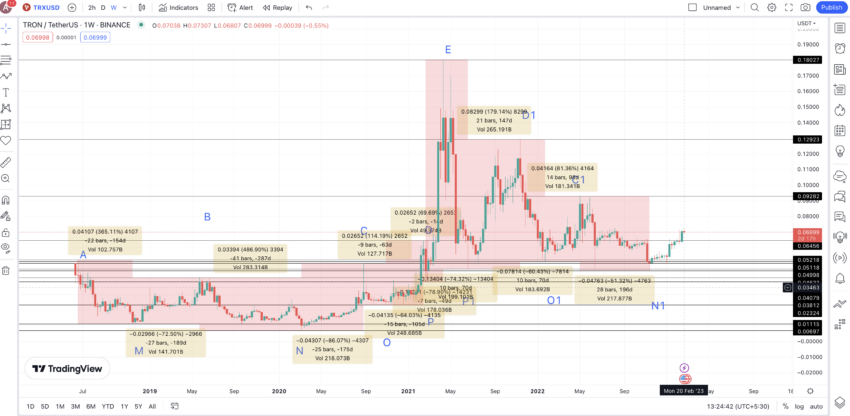
This will help us locate the next TRX price forecast levels.

Using the negative and non-negative column values, we can determine TRON’s average price percentage change between subsequent high-to-low and low-to-high movements.
It’s important to note that we won’t calculate the average distance for these movements, as the timeframe can vary due to a range of factors. These include broader crypto market sentiments, developments specific to TRON, and macroeconomic factors.
However, we can provide some reference points based on the data from the tables. The high-to-low distance range may span from 49 to 196 days, while the low-to-high range might be between 14 and 287 days. Regarding percentage change, the high-to-low movement can decrease by 69.65%, which may drop to a low of 51.32% during strong market conditions.
Conversely, the low-to-high movement can increase by 216.06%, potentially rising by 81.36% during weak market conditions. This analysis can now help us locate the TRON (TRX) price prediction levels.
TRON (TRX) price prediction 2023 (Successful)
TRX lived up to our 2023 price prediction and even exceeded it. Here is how our 2023 analysis read:
Our short-term technical analysis shows TRX has a chance at a quick consolidation. Therefore, from the last low N1, we can expect the price only to go as high as 81.36% — the lowest hike value from the tables above.
The timeframe can be anywhere between 14 days and 287 days — 150 days approximately. Hence, the next high could be at $0.08198 by April 2023.
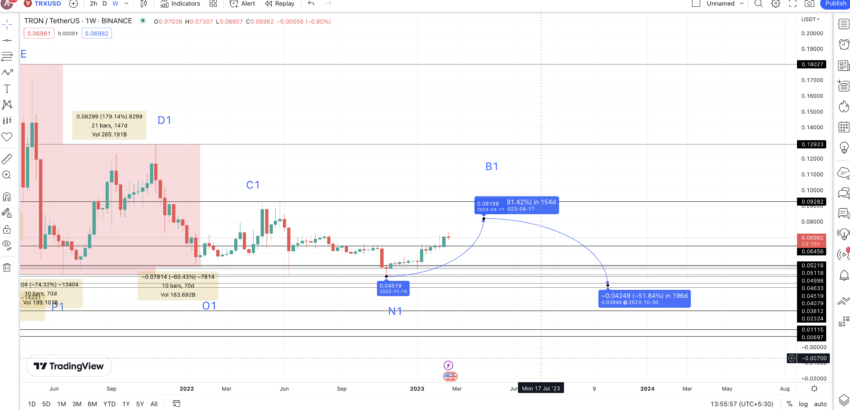
We can mark this level as B1. The next low, or M1, could respect the lowest drop percentage of 51.32%, as the positive weekly RSI divergence might stall the price of TRX to drop lower than a certain level. This puts the minimum price of TRX in 2023 at $0.0395.
TRON (TRX) price prediction 2024 (Successful)
As mentioned at the start of this piece, TRX has already exceeded our 2024 price prediction level. Here is what our analysis looked like.
The last low, or $0.0395, could be M1. From this level, we expect the price of TRX to move up 216.06% (previously calculated average), as by 2024, the broader crypto market is expected to show signs of bullishness.
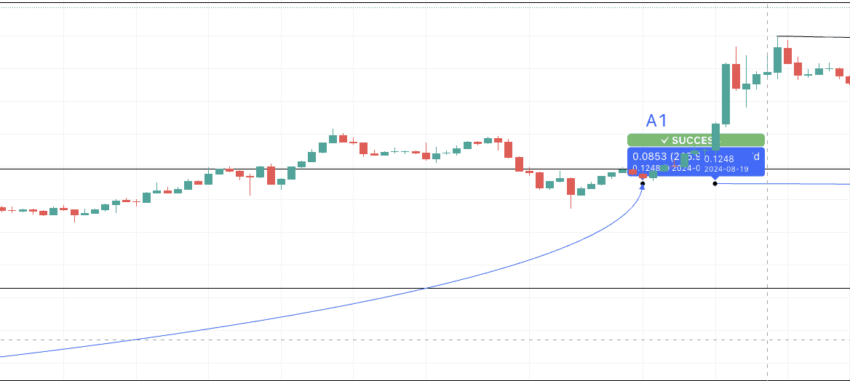
However, the move can take 287 days (max distance) to materialize. This puts the TRON (TRX) price prediction for 2024 at $0.125. We can mark this A1.
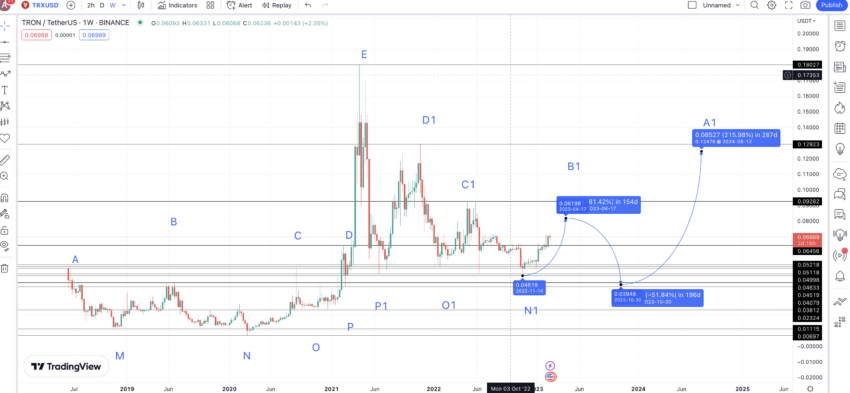
Here is a quick snapshot of how we successfully predicted A1, the possible high for 2024.
TRON (TRX) price prediction 2025
Outlook: Bullish
Even though our 2024 prediction level or A1 has been breached, we shall still keep it as the reference point for 2025, considering its adherence to the long-term pattern.
Notice that by now, the pattern will be complete. Also, A1’s existence above B1 would also put the price of TRX in an uptrend. Hence, the next low, from A1, could again drop 51.32% instead of the average of 69.65%.
Therefore, TRX’s next low could be $0.060. This point could be X and mark the start of a new “high-peak-high” pattern. Also, note that following the 196-day timeframe could push this low to 2025. Hence, we could expect the low in 2024 to surface before the A1 high comes to fruition.
The high in 2025, or A2, could surface exactly in 287 days and at the peak of 216.06%. This puts the TRX price prediction level for 2025 at $0.1914.
However, this level could be reached in 2024 itself, provided TRX holds true to its short-term price pattern. We expect the prices to stabilize at close to $0.19 to $2, even in 2025, which hints at a correction in the mid-term.
Projected ROI from the current level: 11%
TRON (TRX) price prediction 2026
Outlook: Neutral
The TRX price prediction for 2026 forecasts a maximum price of $0.185 and a minimum price of $0.05837, starting from the current level of $0.17. This slight adjustment reflects a natural market correction following the 2025 peak, as outlined in the TRX price prediction for 2026.
Another way of looking at the $0.185 mark is the standard extrapolation from the low of 2025.
Also, from the high A2, the next low could finally respect the average drop of 69.65% as a new pattern might see some more selling and a deeper correction. Therefore, the 2026 low could surface at $0.05837. This low is projected, keeping anticlimactic crypto market conditions in mind.
From this low, buyers might again try to push the prices of TRX higher, making the peak growth of 216.06% possible. Therefore, the next high or B2, preferably by 2026 (using 150 days), could therefore surface at $0.185.
The projected ROI for 2026 is approximately 11%, considering the 2025 high of $0.1914. Throughout 2026, TRX is expected to stabilize around the $0.17 level, with potential minor fluctuations as the market adjusts. The RSI will remain a crucial indicator; a bullish RSI divergence could signal the initiation of an upward trend, while a bearish RSI divergence might indicate consolidation phases.
Projected ROI from current level: Approximately 11%
TRON (TRX) price prediction 2027
Outlook: Moderately Bullish
Looking ahead to 2027, the TRX price prediction forecasts a significant increase, with TRON reaching a maximum price of $0.30 and a minimum price of $0.23, based on the current level of $0.17. This projection aligns with the TRX price prediction for 2027. It reflects a substantial upward movement driven by enhanced developments within the TRON ecosystem, including increased adoption of decentralized applications and strategic partnerships.
The projected ROI for 2027 is approximately 30%, considering the growth from the 2026 maximum of $0.185 to $0.30.
2027 focus: The RSI will continue to be a key indicator. A sustained bullish RSI trend may support the upward movement towards $0.30, while occasional bearish divergences could lead to necessary market corrections. Moving averages, such as the 50-week and 200-week MA, are expected to provide support levels, validating the bullish outlook. Additionally, ascending triangle or bullish flag chart patterns may form, reinforcing the positive trend.
Projected ROI from current Level: 76.47%
TRON (TRX) price prediction 2028
Outlook: Strongly Bullish
The TRX price prediction for 2028 projects a substantial rise, with TRON reaching a maximum price of $0.46 and maintaining a minimum price of $0.30, based on the current level of $0.17. This strong bullish forecast aligns with the TRX price prediction for 2028 and reflects significant growth driven by TRON’s continued advancements in blockchain technology, increased participation in DeFi projects, and ecosystem expansion. The projected ROI for 2028 is approximately 170.59%, considering the increase from the 2027 maximum of $0.30 to $0.46.
Key pointer:
Throughout 2028, the RSI is expected to remain in a bullish zone, indicating sustained buying pressure. However, periods of overbought conditions may lead to short-term corrections, which are essential for maintaining market stability. Chart patterns such as ascending flags or pennants are likely to form, signaling ongoing upward momentum.
Additionally, support levels around $0.30 will be critical in preventing significant downturns, ensuring that TRX remains on a steady path toward the projected maximum price.
Projected ROI from current level: 170.59%
TRON (TRX) price prediction 2029
Outlook: Highly bullish
In 2029, the TRX price prediction forecasts TRON achieving a maximum price of $0.686 and a minimum price of $0.42, based on the current level of $0.17. This highly bullish outlook will be driven by TRON’s sustained innovation, widespread adoption across various blockchain applications, and the overall expansion of the cryptocurrency market.
The projected ROI for 2029 is approximately 303.53%, considering the growth from the 2028 maximum of $0.46 to $0.686. The RSI is expected to exhibit persistent bullish signals, supporting continued upward momentum towards $0.686.
However, as TRX approaches this high, the RSI may enter overbought territory, indicating potential short-term corrections to consolidate gains and stabilize the price.
Chart patterns such as cup-and-handle formations are likely to emerge, reinforcing the expectation of sustained growth. Additionally, maintaining support levels around $0.42 will be crucial in safeguarding against significant price drops.
Projected ROI from current level: 303.53%
TRON (TRX) price prediction 2030
Outlook: Bullish
Two approaches can be used to reach the projected price level for TRX in 2030. First, we can use the same set of calculations that were used until 2029, which hint at a price level of $1.2. Or, we can extrapolate data right from 2026.
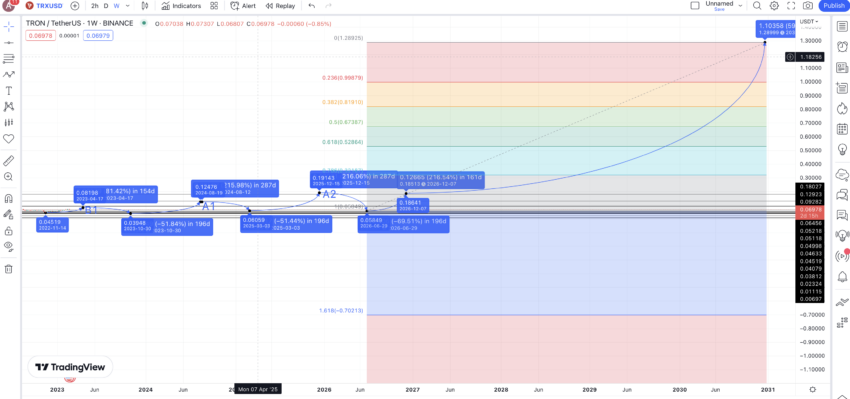
With a low and a high in sight in 2026, we can extrapolate the price of TRX until 2030. This puts the TRX price prediction for 2030 at $1.289, provided TRX manages to keep growing in terms of content creators and DeFi.
Projected ROI from the current level: 659.41%
TRON fundamental analysis
The Tron ecosystem is the brainchild of Justin Sun — one of the more active yet controversial names in the crypto space. Tron Foundation manages the Tron Network. Both entities were founded in 2017.
Did you know? TRON introduced the novel TRON Virtual Machine or TVM for the development of chain native smart contracts. TVM is compatible with EVM and supports DApp migration.
Here is what TRON looks like in terms of use cases and uniqueness:
- TRON — the blockchain — supports DApps, smart contracts, and development activity to make content distribution seamless, creator-focussed, and decentralized.
- The ecosystem can support multiple DeFi protocols and is currently only behind the DeFi OG Ethereum in regards to Total Value Locked.
- TRON boasts excellent scalability and supports close to 2,000 transactions per second.
- Its native crypto TRX, is meant for paying transaction fees, staking, and governance.
Note: TRON even launched its native stablecoin USDD in 2022. However, the interest in it has dampened after the Terra-UST crash.
“For Tron, everything is also in the early stages, our vision is to serve the 8 billion people around the world. in fact, on this point, we are not doing enough. I have always hoped to get more people to help us realize this vision. For this, we are willing to do anything.”
Justin Sun, Founder of Tron: X
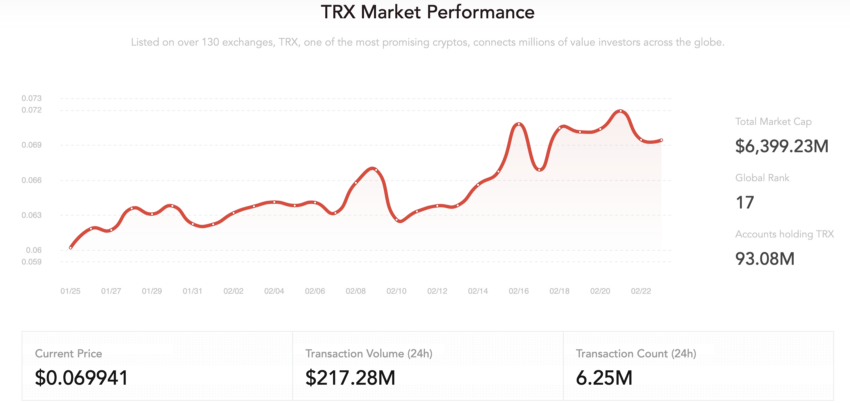
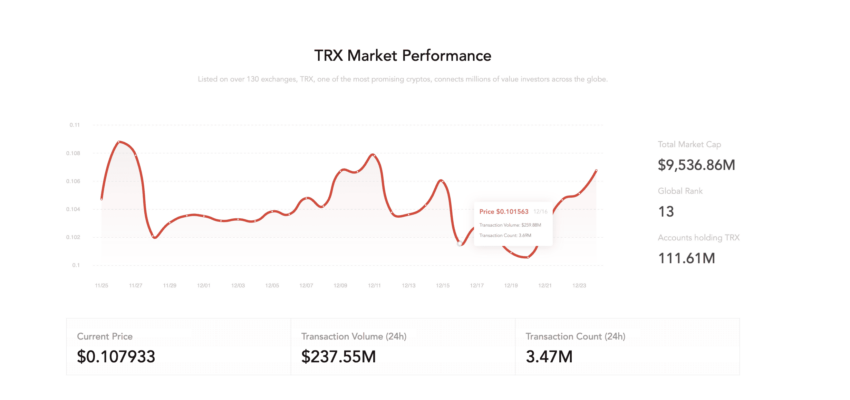
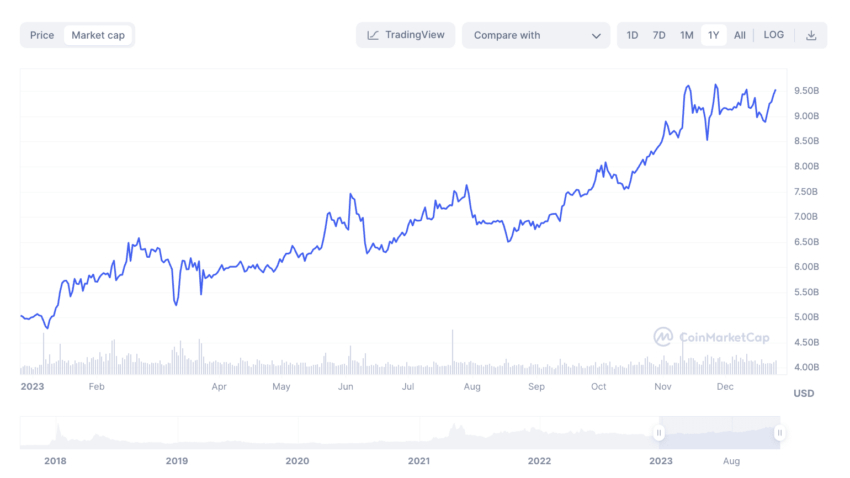
Overall, TRON focuses on decentralizing the web by being the new-gen Internet for users. Also, here is the overall market performance of TRX from Feb. 2023, which was listed on 130+ exchanges at that time.
It’s important to highlight that by Dec. 2023, TRON Network’s market performance indicators experienced significant uptick. This included a rise in market capitalization, an improvement in global ranking, and an increase in the number of transactions.
In 2024, the situation has changed in favor of the ecosystem.
Tron’s DeFi outlook
Data released by TronDAO revealed interesting figures in regard to TRON’s TVL. However, this was from early February 2023.
If we head over to DeFiLlama, we can see that the February TVL standing for TRON was $5.29 billion, up 3.17% month-on-month. JustLend — a lending protocol — held the most weightage among TRON’s 16 DeFi protocols.
In December 2023, Tron continued to hold the second rank when DeFi TVL by chains was concerned. Despite the DeFi space not being in the best stead for 2023, TRON managed to pack a DeFi TVL value of over $8 billion.
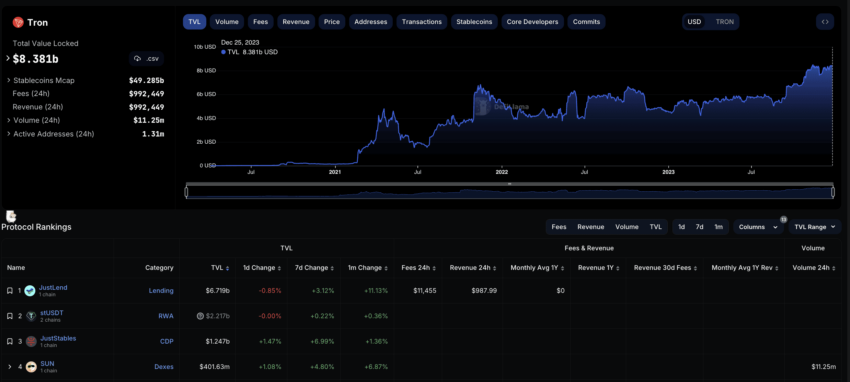
With just 34 protocols to date, TRON’s DeFi supremacy is spectacular. For anyone eyeing TRX as an investment option, continued DeFi growth is a key driver.
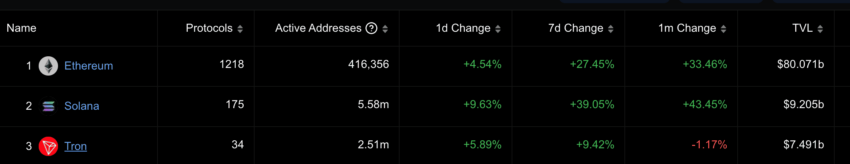
Update: In 2024, Tron dropped to third place in terms of DeFi TVL.
TRON tokenomics
Even though TRON began as a platform for content creators, it has evolved into something bigger. Still, the supply cap of 100 billion coins remains, and currently, almost 99% of that makes the circulating supply.
Some criticism was directed at the initial distribution, with almost 45% of the initial supply earmarked for the founders and the project itself. Only 55% went to investors.
Yet, TRON has been trying to quell these apprehensions by adopting an aggressive coin-burning approach to keep the supply in line with the demand.
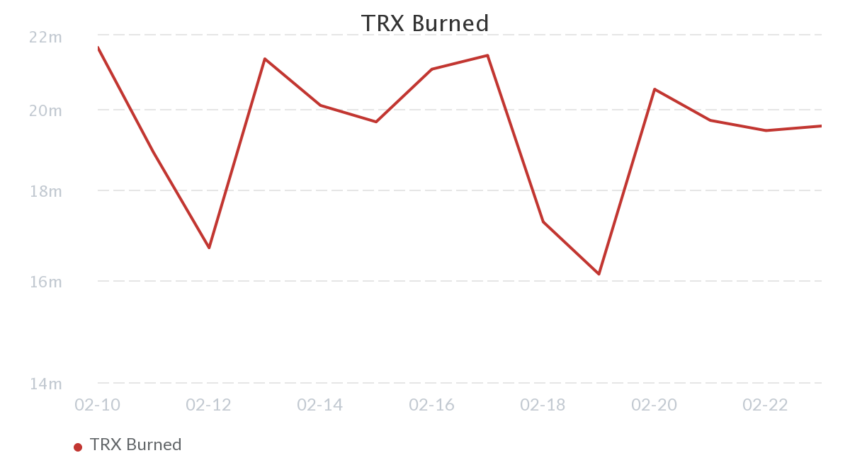
Here is a chart showing how rapidly the coin-burning activities increased over the past week or so in February 2023.
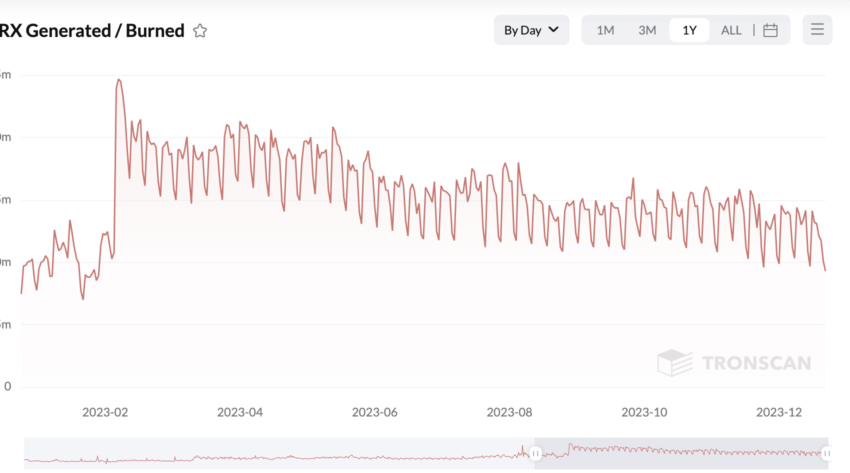
Here was the burning intensity recorded in December 2023.
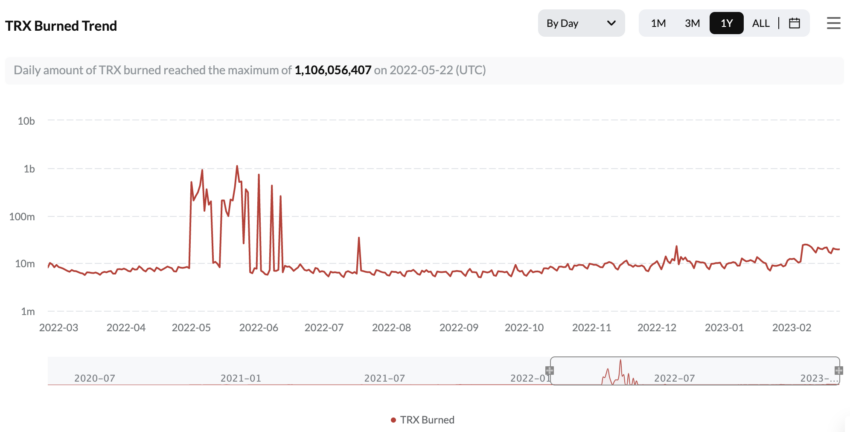
However, the yearly coin-burning trend shows that we are still far from the mid-2022 highs. If the burning activity increases, we might see some more price-specific robustness in the short term.
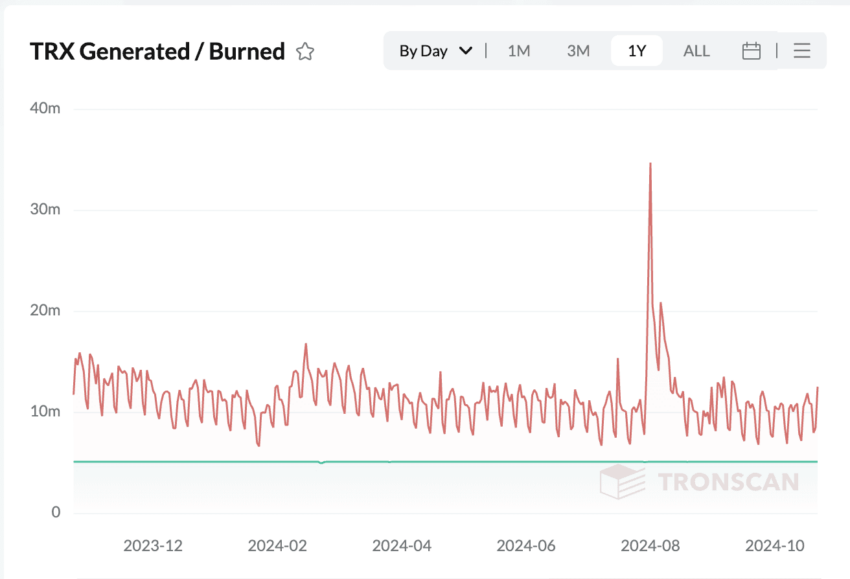
But if we focus on 2024, we can see a few 2022-like token-burning spikes in action, which can be good news for the price action.
Key TRON metrics
Let us start with the transaction trend. Notice how the overall transactions, smart contract-based transactions, and even TRX transfers peaked towards the end of December 2022. That is when the prices started showing strength.
Also, the chart below is from February 2023.
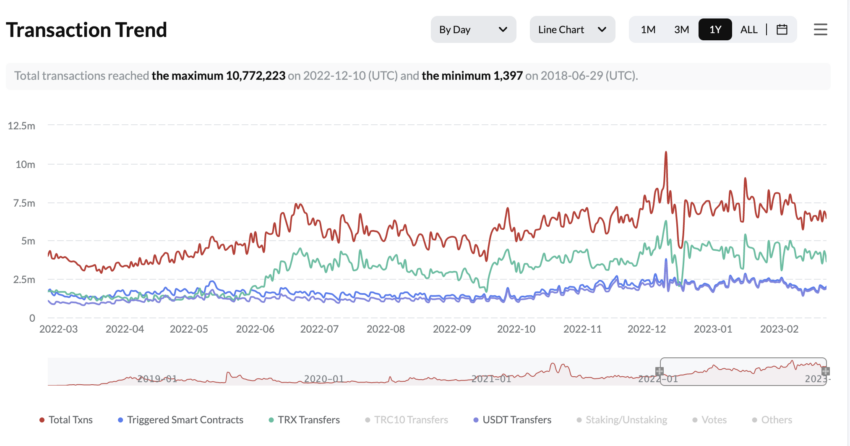
The transactions were down almost 30% from the December highs, leading to a short-term consolidation at TRON’s counter.
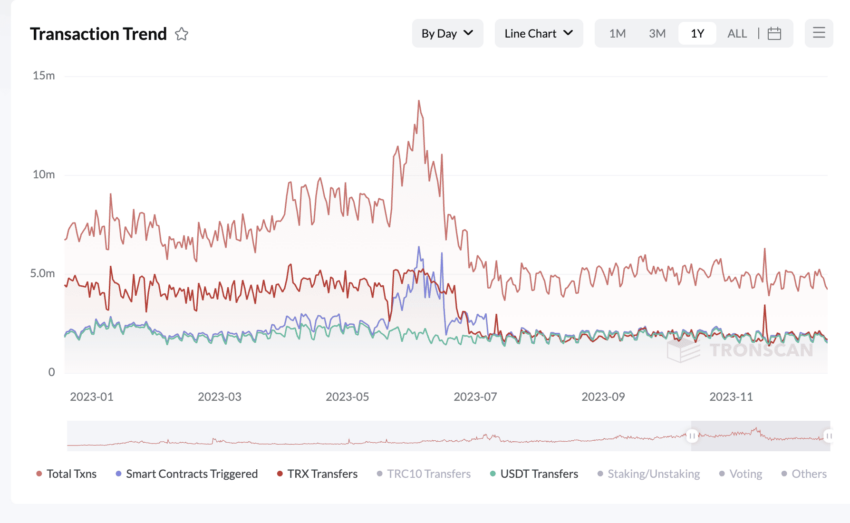
However, things changed by December 2023 as, despite the low set of transactions, TRX scaled new highs.
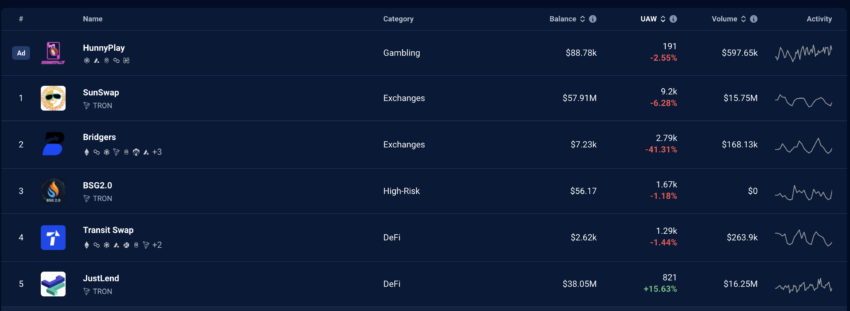
Let’s turn to the performance of TRON DApps and games over the past seven days (as of Feb. 25, 2023). The most prominent, such as SunSwap, Bridgers, and HunnyPlay, saw drops in the UAWs (Unique Active Wallets). However, the monthly UAW count for Bridgers and SunSwap was still positive, showing no imminent, worrying signs for the network.
This analysis paid dividends as, despite the market downturn, the prices remained steady, holding true to our TRX price prediction levels.
Standard token metrics
Our in-house evaluation metrics put TRX’s liquidity score at a decent 67.924 as of Feb. 24, 2023. This showed that TRX was very much tradeable across multiple exchanges. Now, let’s move to the old monthly chart showing the market cap and trading volume.
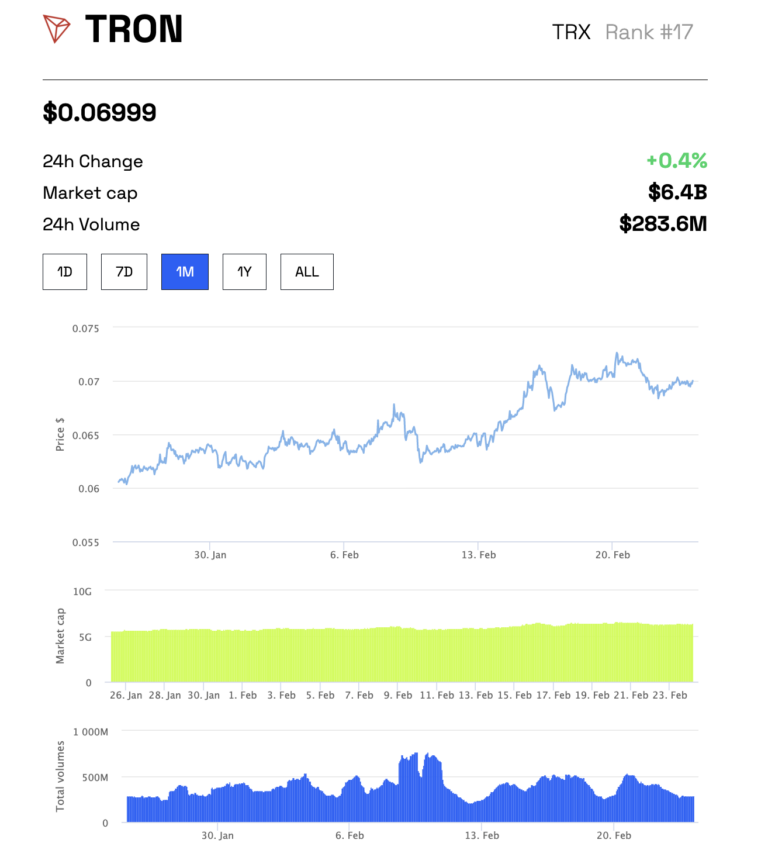
Even though the prices peaked, the trading volume was still significantly lower on February 24, 2023, than it was on Feb. 10, 2023. And a drop in trading volume might signify slowed-down trading activities.
If you compare the charts with the current market cap for Tron, things seem a lot better as of December 2023. The market cap was slowly peaking and assumed the $9.5 billion mark.
The metrics looked positive for the long-term TRON price forecast levels, which is one reason why our 2024 price prediction level for TRX was successful.
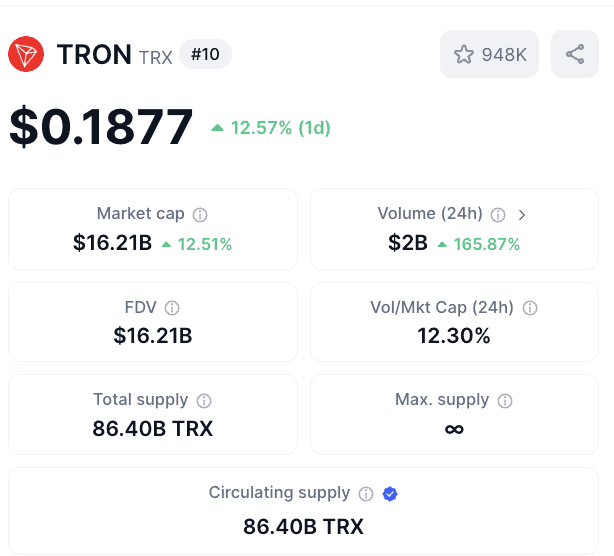
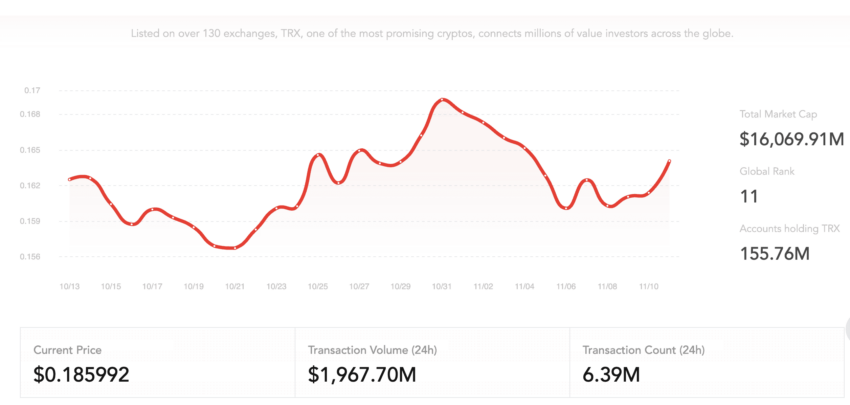
As of mid-November 2024, the market cap is over $16 billion, showing the pace with which TRX is moving up. This makes us bullish for the next year and even beyond.
Is the TRX price prediction model accurate?
Our TRX price prediction model considers all the important metrics. These include fundamentals, technical analysis, and key network-specific metrics. Throughout this piece, we have also focused on short-term and long-term price analysis of TRX. It also considers market downturns, making the model as accurate as possible in the context of a dynamic crypto market.
Disclaimer: The information provided in this TRX price prediction analysis is for informational purposes only and does not constitute financial advice. Cryptocurrency investments are highly speculative and come with significant risks, including market volatility and regulatory uncertainties. Always conduct your own research and consult with a qualified financial advisor before making any investment decisions.
Frequently asked questions
Will the TRX coin reach $1?
Who is behind Tron?
Is Tron a stablecoin?
What was Tron’s highest price?
Disclaimer
In line with the Trust Project guidelines, the educational content on this website is offered in good faith and for general information purposes only. BeInCrypto prioritizes providing high-quality information, taking the time to research and create informative content for readers. While partners may reward the company with commissions for placements in articles, these commissions do not influence the unbiased, honest, and helpful content creation process. Any action taken by the reader based on this information is strictly at their own risk. Please note that our Terms and Conditions, Privacy Policy, and Disclaimers have been updated.


