


The Dogecoin (DOGE) price moved above a long-term descending resistance trendline that had been in place since the all-time high.
Despite the breakdown, the price did not decrease significantly. On the contrary, it began an upward movement four days later.
Dogecoin Breaks Out From 900-Day Resistance
The weekly timeframe technical analysis shows that the DOGE price had decreased under a descending resistance trendline since its all-time high of $0.740 in May 2021. The decrease led to a low of $0.049 in June 2022.
Even though the price bounced afterward, it failed to break out from the trendline. Rather, it made three unsuccessful attempts (red icons), which created lower highs and long upper wicks.
This all changed last week when the DOGE price broke out from the 900-day resistance.
It reached a weekly close of $0.069, the first close above the trendline since the all-time high.
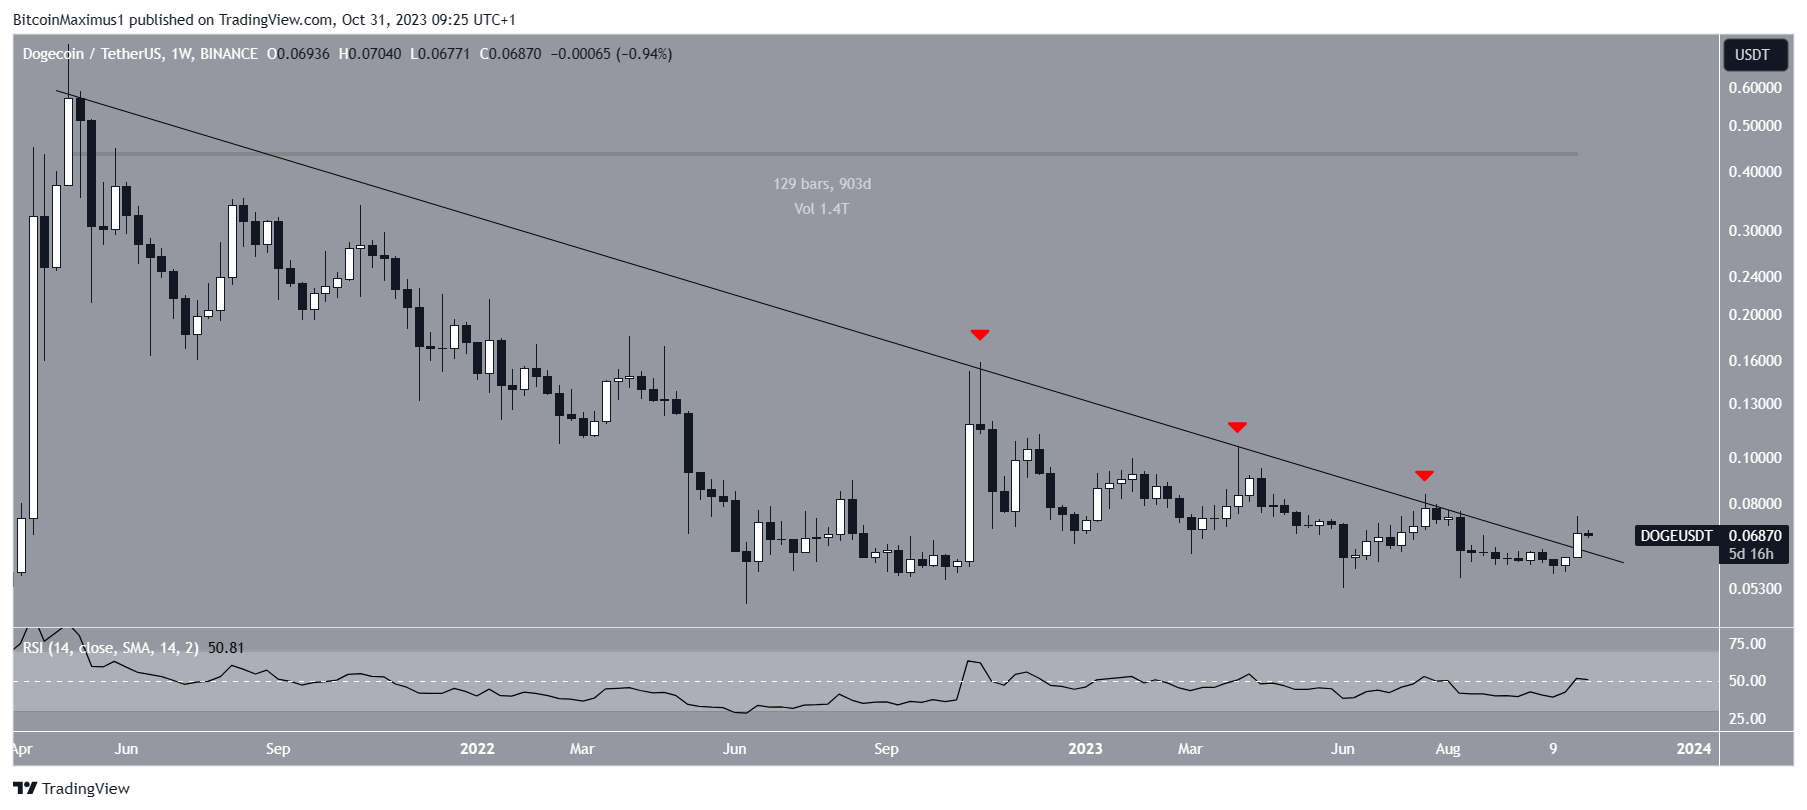
The weekly Relative Strength Index (RSI) is undetermined.
Market traders use the RSI as a momentum indicator to identify overbought or oversold conditions and to decide whether to accumulate or sell an asset.
Readings above 50 and an upward trend indicate that bulls still have an advantage, whereas readings below 50 suggest the opposite.
The RSI is currently at 50, a sign of an undetermined trend.
What Do the Analysts Say?
Cryptocurrency analysts on X are leaning bullish for Dogecoin’s future prospects.
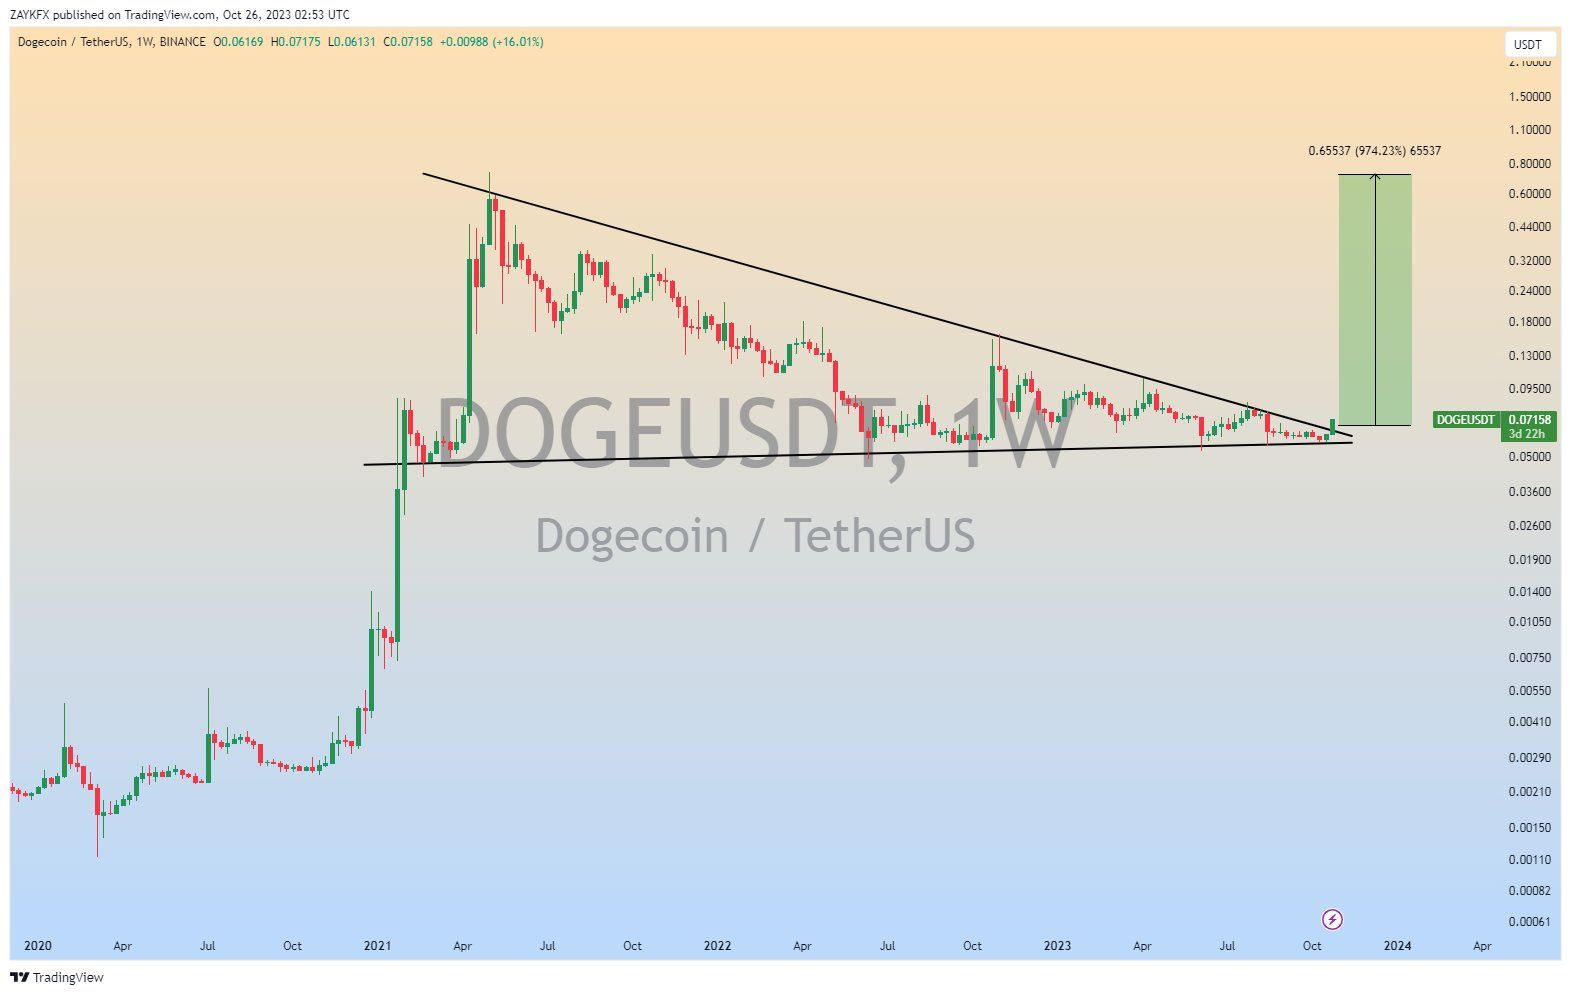
ZAYKChart has posted the same long-term descending resistance trendline. He believes that the DOGE price is ready for a massive bullish wave.
Rovercvc goes as far as to state that DOGE will outperform Bitcoin (BTC) since the DOGE/BTC chart is trading at a massive support.
However, rektcapital is not as sure about the bullish outlook. The reason for this is that he has drawn a less steep slope from which the DOGE price has not yet broken out.
Complicated Weekly Close for #dogecoin 1W Close occurred below the Channel Top resistance This means that the #doge breakout is postponed Previous 1W Closes like this -> downside However if DOGE can hold the highs and reclaim the Channel Top as support – there may still be a chance
DOGE Price Prediction: Is This the Start of a Reversal?
The daily timeframe technical analysis also provides a bullish outlook aligning with the DOGE price breakout from the 900-day resistance trendline. On October 20, the DOGE price also broke out from a shorter-term descending resistance trendline.
This not only catalyzed the ongoing increase but also caused a reclaim of the $0.060 horizontal support area, indicating the previous drop below it was only a deviation.
Check Out the Best Upcoming Airdrops in 2023
Similarly to the weekly timeframe, the daily RSI is bullish. The indicator is increasing and is above 50, both considered signs of a bullish trend.
However, it is worth mentioning that the DOGE price was rejected by the 0.618 Fib retracement resistance level (red icon). It has fallen since October 26.
The principle behind Fibonacci retracement levels suggests that after a considerable price movement in one direction, the price will retrace partially to a previous price level before continuing in its original direction.
The 0.618 Fib level most often determines if an upward movement is corrective or not. So, the DOGE price has to move above it to confirm the bullish trend reversal.
If it does, a 20% increase to the July high of $0.083 will be expected.
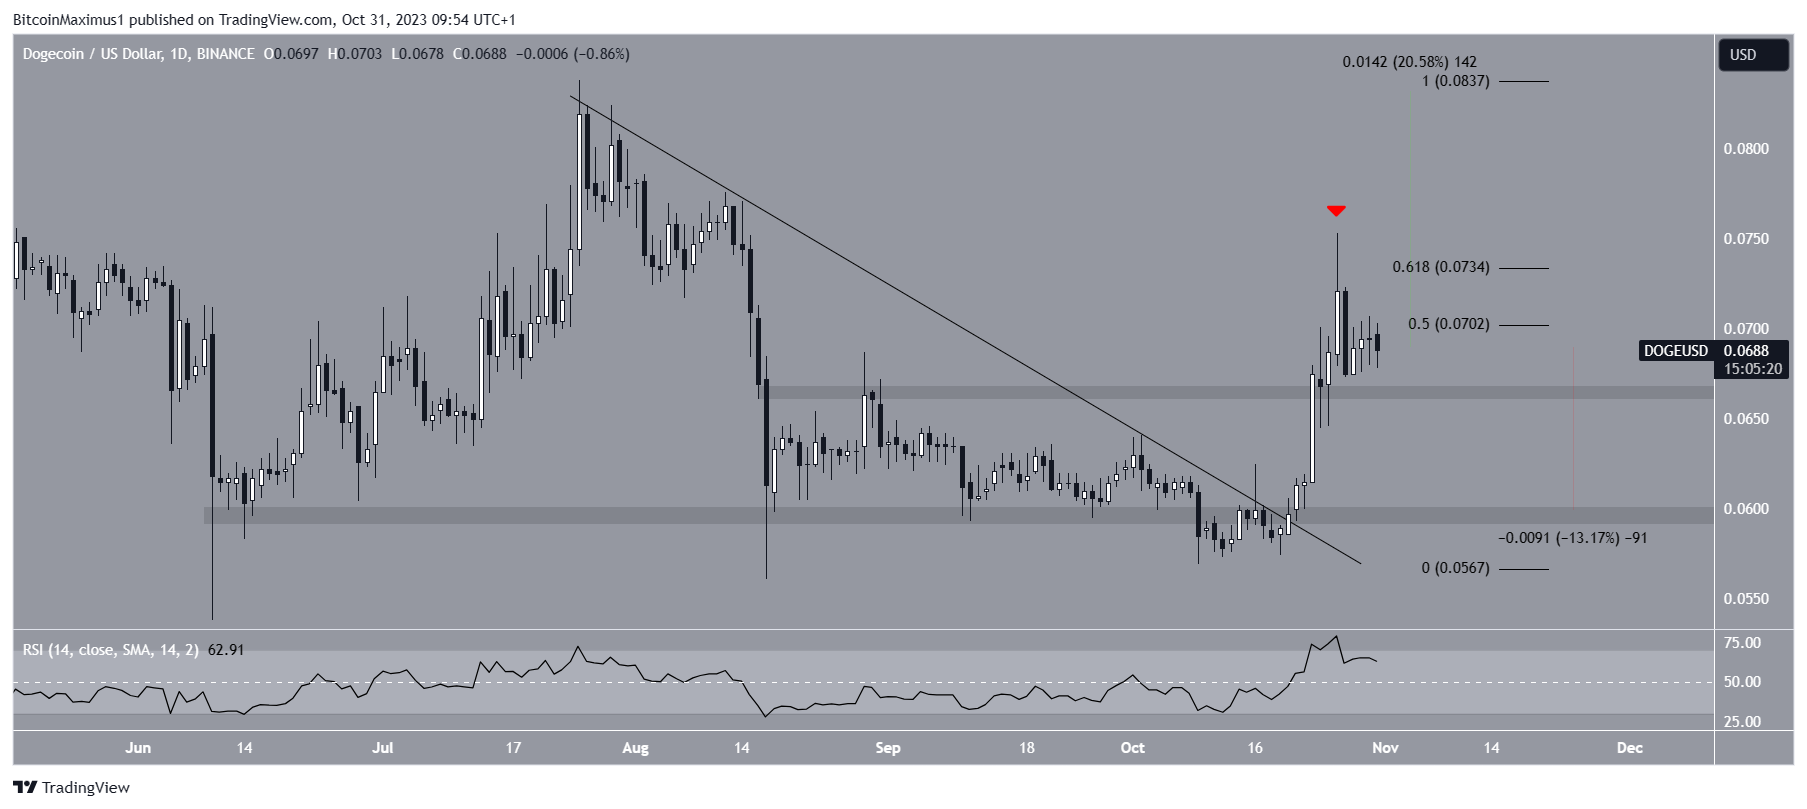
Despite this bullish DOGE price prediction, a close below the minor support at $0.066 can cause a 13% drop to the closest support at $0.060.


