


The price of DOGE is potentially on the verge of experiencing a decline. This will be confirmed with a breakdown from a descending triangle pattern that has evolved for a long time. This breakdown could lead to a substantial 50% reduction in price.
Yet, the daily timeframe offers more positive signals, hinting at the possibility of a turnaround in the prevailing bearish trend.
Will Dogecoin Break Down From Long-Term Pattern?
The weekly timeframe Dogecoin price analysis indicates that the price has consistently stayed slightly above the $0.059 support level since June 2022. This support level has been verified multiple times, underscoring its significance.
Notably, the most recent confirmations (green icons) displayed extended lower wicks, suggesting heightened buying activity.
However, despite these positive signals, DOGE has encountered pressure due to a descending resistance trendline that has been active since November 2022. When combined with the $0.059 support, it forms a descending triangle, typically interpreted as a bearish pattern.
During this timeframe, DOGE has marked several lower highs, signifying a decrease in its upward momentum. The DOGE price has nearly retraced to the $0.059 level, nullifying the gains from its recent rebound.
A potential breakdown encompassing the entire height of this pattern (white) could potentially drive DOGE’s price down by roughly 50%.
Confirmation of this breakdown would necessitate DOGE closing below the $0.059 horizontal support level. Conversely, returning to the descending resistance line would signify a 16% increase.
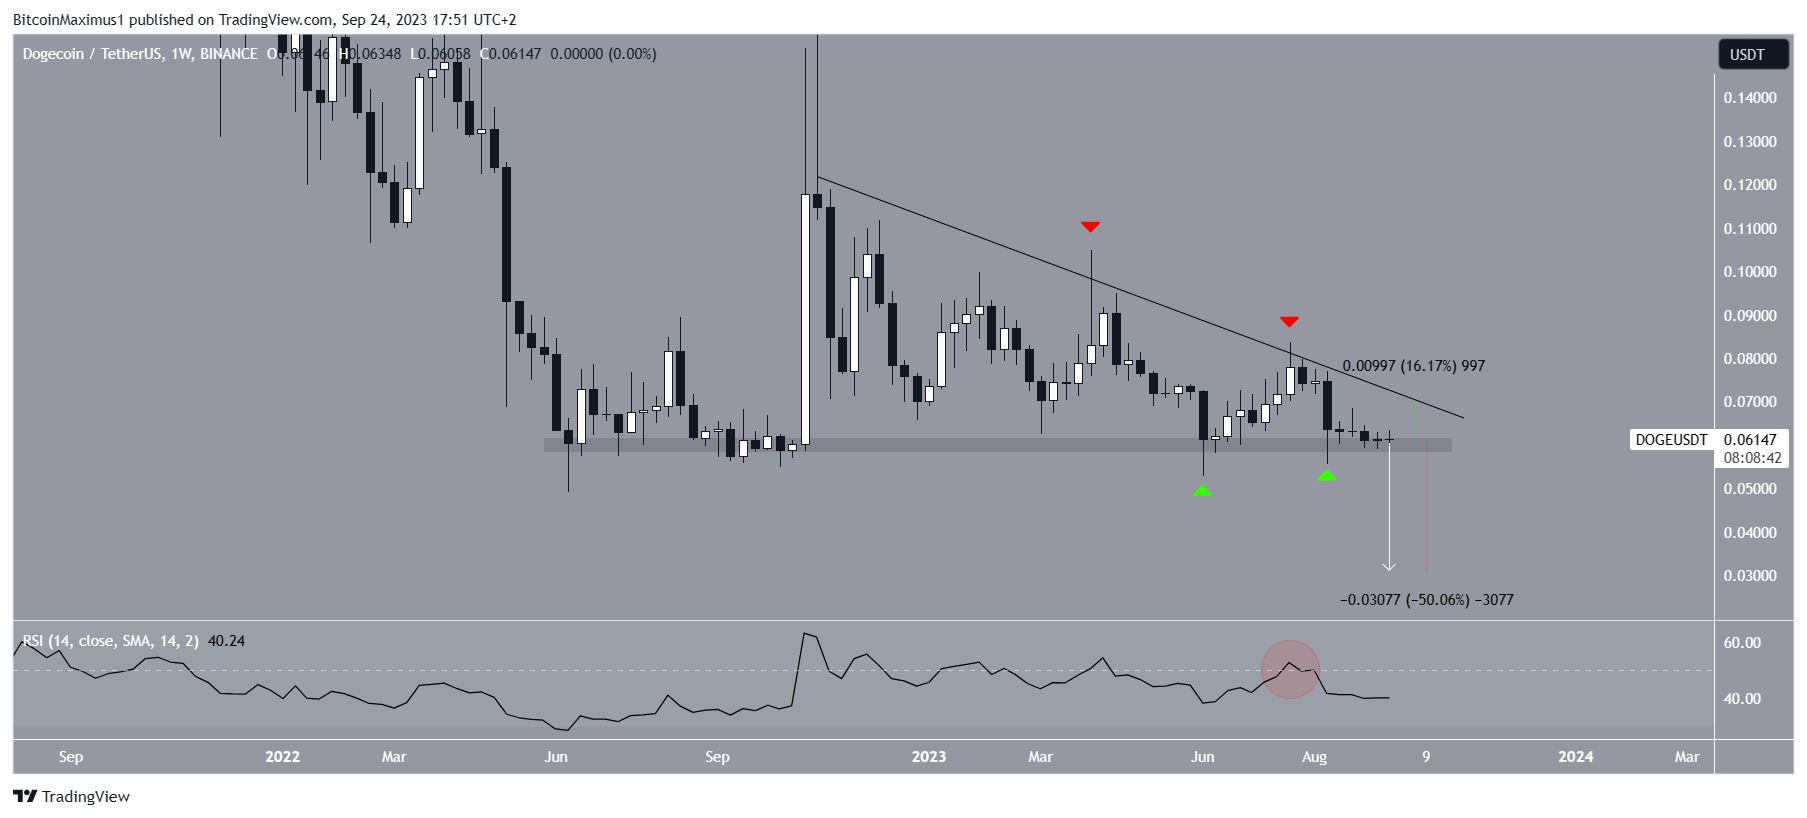
The weekly Relative Strength Index (RSI), which gauges momentum, corroborates the possibility of a breakdown.
Many traders rely on the RSI to evaluate whether an asset is in an overbought or oversold state, which assists them in making decisions about buying or selling. Currently, the RSI is below the 50 threshold (highlighted by a red circle) and is decreasing, indicating a bearish trend.
In recent news, FTX is preparing to liquidate various crypto assets. However, despite holding assets in Dogecoin, the insolvent exchange has no intentions of liquidating them.
DOGE Price Prediction: Can Bullish Pattern Spark Reversal?
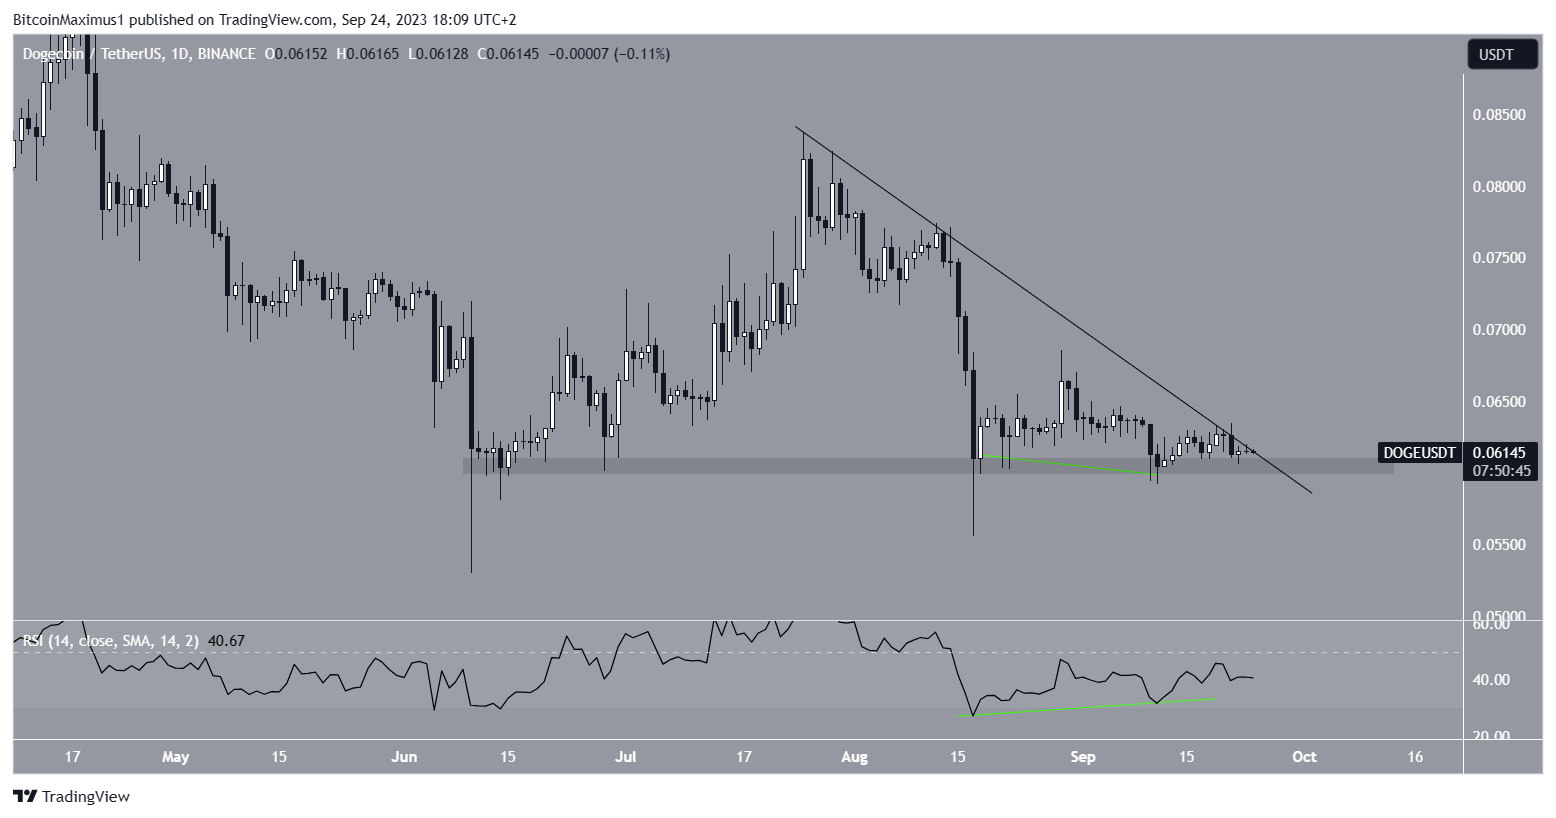
Unlike the weekly timeframe, which is decisively bearish, the daily timeframe Dogecoin price analysis shows signs of a potential bullish trend reversal. This is because of the creation of a double bottom, which is considered a bullish pattern.
Furthermore, the pattern has been combined with a bullish divergence in the RSI. A bullish divergence occurs when a momentum increase accompanies a price decrease. This often leads to bullish trend reversals.
Check Out the Best Upcoming Airdrops in 2023
If the Dogecoin price breaks out from a short-term descending resistance line, it will confirm the validity of the double bottom pattern. This will likely cause a 16% increase in the long term above the descending resistance line.
On the other hand, a breakdown from the minor support at $0.061 will mean that the pattern is invalid. This would likely cause a long-term breakdown and initiate a 50% drop.
To conclude, the DOGE price prediction will determine whether the price breaks below $0.059-$0.061 or breaks out from the short-term resistance line. A breakdown can cause a 50% drop, while a breakout could cause a 16% increase.


