


The Solana (SOL) price has increased at an accelerated rate since October, reaching a new yearly high of $86.80 today.
Will this increase continue until the end of the year, or will the SOL price reach a local top soon? Let’s find out.
Solana Uptick Accelerates
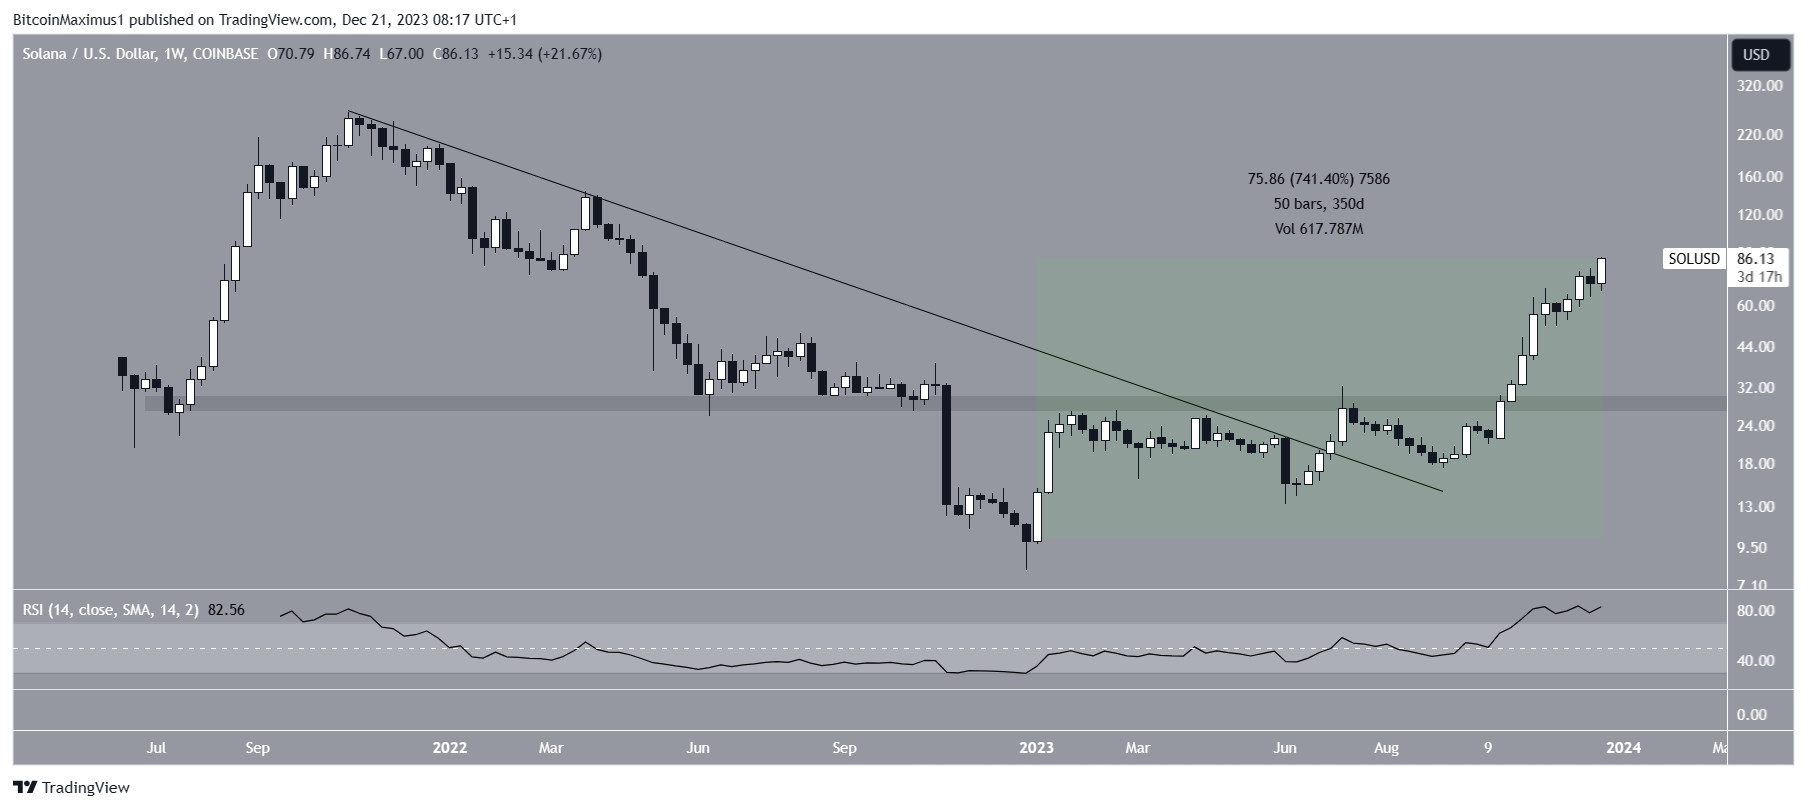
The Solana (SOL) price has increased exponentially this year after it fell to a long-term low of $9.68 on January 1. During the increase, SOL cleared long-term horizontal and diagonal resistance trend lines.
In July, the price moved above a descending resistance trend line that had been in place since the all-time high in November 2021.
Then, in October 2023, the price broke out from a horizontal area that intermittently acted as support and resistance for over two years. Since then, the price has created eight bullish candlesticks in ten weeks.
This Solana increase culminated with a new yearly high of $86.80 today. This amounts to a 750% increase since the start of the year.
The RSI is a momentum indicator traders use to evaluate whether a market is overbought or oversold and whether to accumulate or sell an asset.
Readings above 50 and an upward trend suggest that bulls still have an advantage, while readings below 50 indicate the opposite.
The RSI is increasing and is above 50, both signs of a bullish trend.
SOL Price Prediction: Is $100 Within Reach?
Utilizing the Elliott Wave theory, technical analysts examine long-term price patterns and investor psychology that recur to determine the direction of a trend.
The most likely wave count suggests that the SOL price is nearing the top of wave three in a five-wave upward movement (white) that began in June. Wave three has extended and has 3.61 times the length of wave one.
Read More: Solana vs Ethereum
The daily RSI has generated bearish divergence (green), which occurs when a momentum decrease accompanies a price increase. It is a sign associated with bearish trend reversals. This supports the possibility that the top of wave three is near.
So, whether the SOL price gets rejected at $86 or breaks out will determine the future SOL trend.
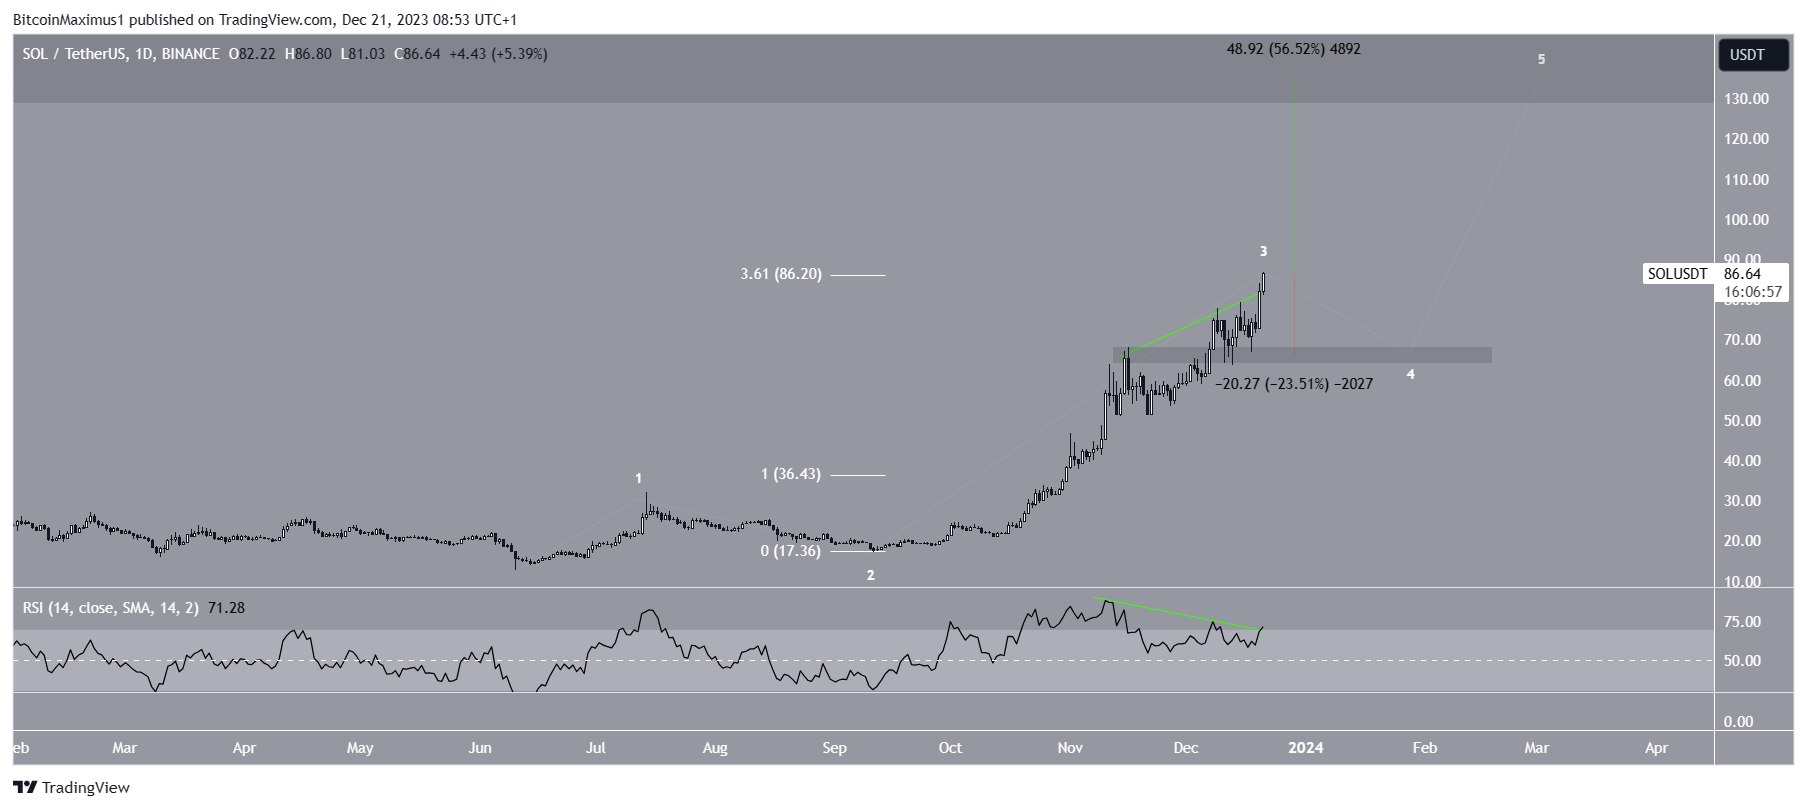
A successful breakout can lead to a 55% increase to the next long-term resistance at $135. On the other hand, a strong rejection will mean wave three has ended and can cause a 25% drop to the closest support at $70.
For BeInCrypto‘s latest crypto market analysis, click here.


