


Solana (SOL) is among the top-performing cryptocurrencies in the market. It has recorded a price increase of over 500% year-to-date, climbing from $9.9 to $68.4.
Despite these substantial gains, SOL could be poised for a brief correction before the uptrend resumes.
SOL Price Shows Signs of Exhaustion
The Tom DeMark Sequential Indicator, commonly called the TD Sequential, suggests that SOL may have reached a local peak. It has presented a green nine candlestick on Solana’s weekly chart, a bearish formation.
This sell signal aligns with the Relative Strength Index (RSI) hovering with the overbought territory. The RSI stands at 75 on Solana’s weekly chart, indicating a potential trend reversal or corrective price pullback.
If these bearish signs materialize, Solana could see a spike in profit-taking, triggering a correction that may last one to four weekly candlesticks.
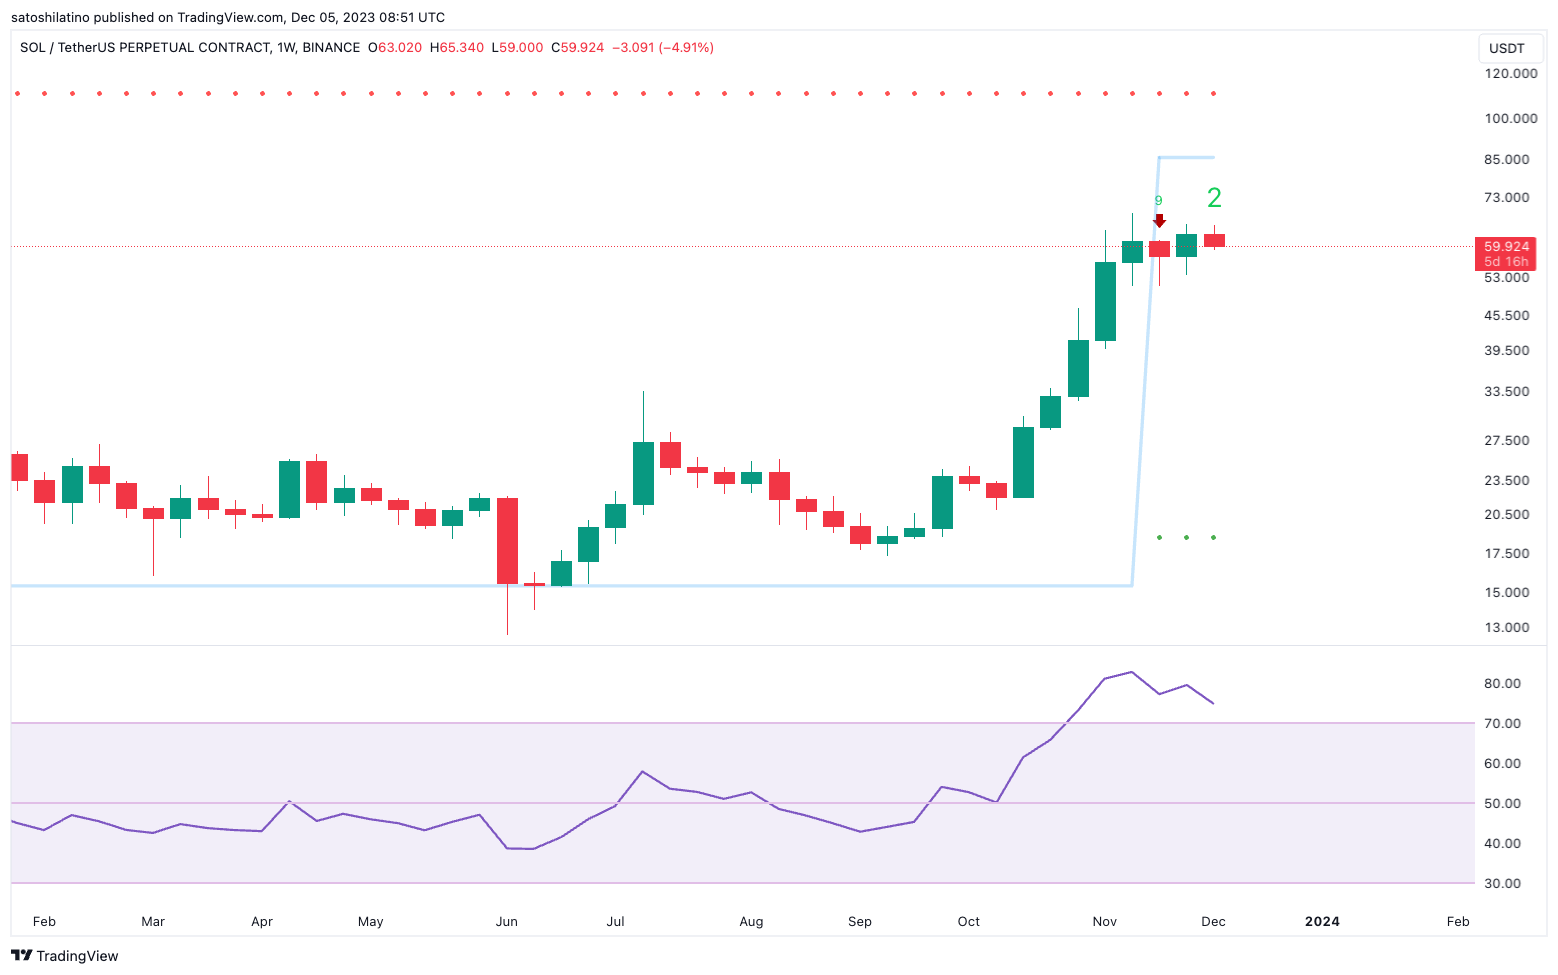
The TD Sequential is a technical analysis tool designed to identify potential buying and selling opportunities by predicting trend exhaustion points. It is based on a series of numbers and rules, focusing on two components: TD Setup and TD Countdown. The indicator’s main purpose is to detect trends that have become overextended and are likely to reverse.
Conversely, the RSI serves as a momentum indicator, comparing the magnitude of an asset’s gains on its upward price days to the magnitude of its losses on its downward price days.
Solana Price Prediction: A Downswing Before Higher Highs
One can identify potential support and resistance levels by employing the Fibonacci Retracement Indicator. This technical tool uses a series of numbers to help predict potential reversal points after a significant price movement. It does so by dividing the vertical distance between an asset’s high and low points by key Fibonacci ratios, which are 23.6%, 38.2%, 50%, 61.8%, and 78.6%.
The Fibonacci Retracement Indicator suggests an increase in selling pressure could push Solana down to the 78.6% retracement level at $47.6. A steeper correction to the 61.8% retracement level at $35.8 could occur if this support level fails.
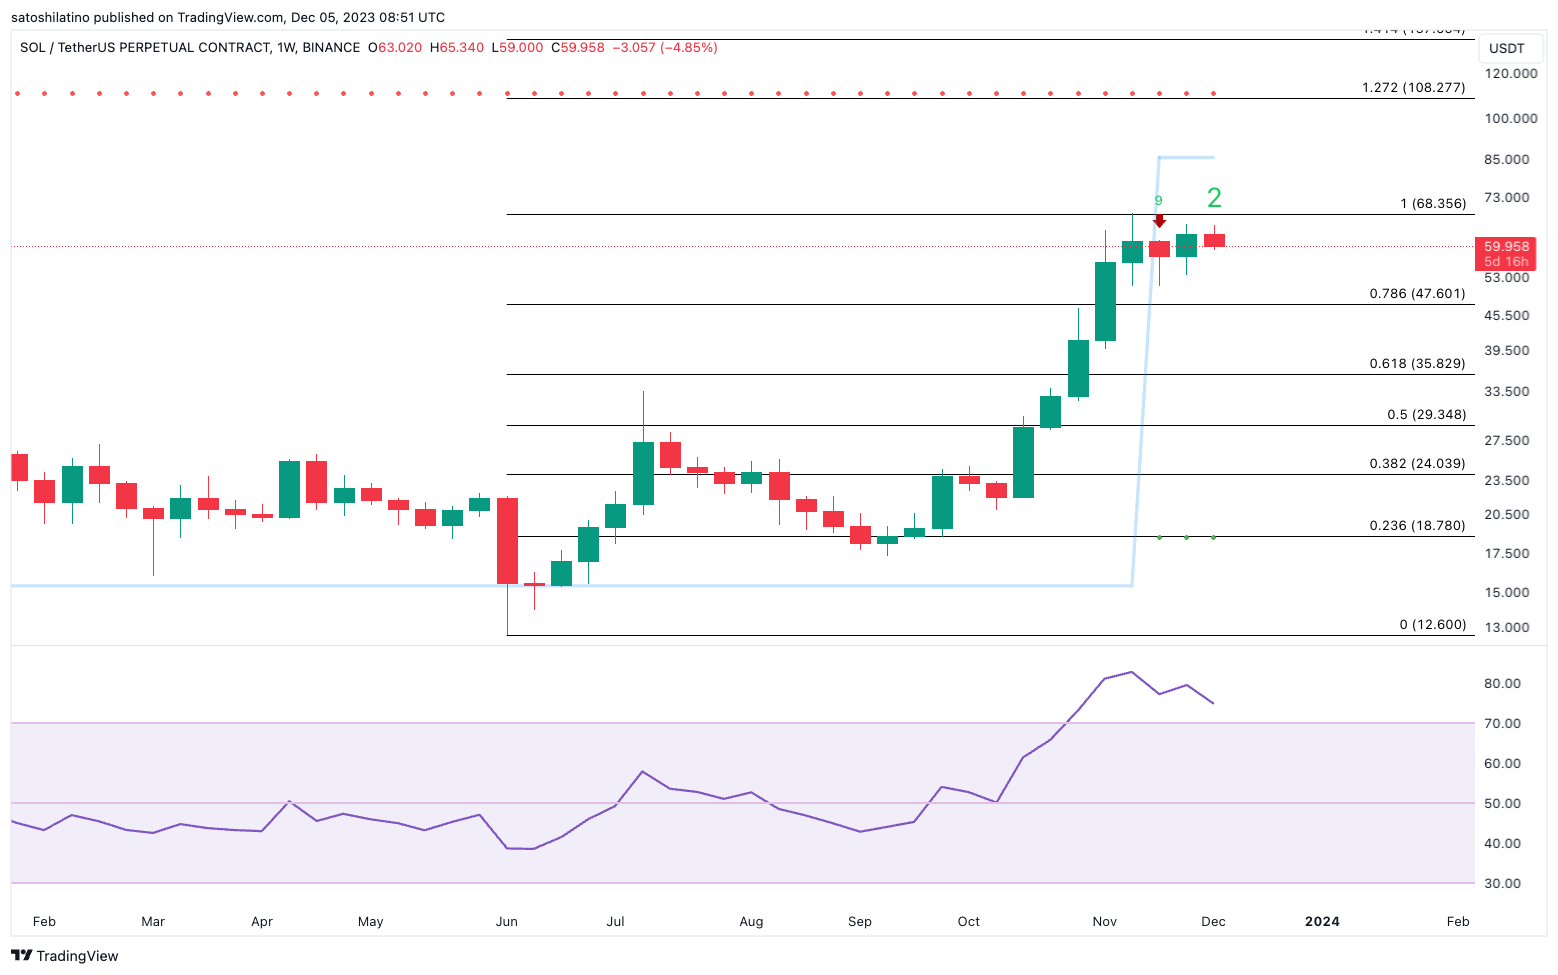
In conclusion, to negate this pessimistic view, SOL’s price must close above the recent high of $68.4 on a weekly candlestick. Achieving this could attract interest from sidelined investors, potentially driving Solana’s price to a new yearly high of $108.



