


The Solana (SOL) price broke down from an ascending support trend line that was in place for nearly 100 days.
SOL also broke down from a short-term symmetrical triangle, falling below a Fibonacci support area.
Solana Breaks Down From Long-Term Support
The technical analysis from the daily time frame shows that SOL has increased alongside an ascending support trend line since October 16, 2023. The increase led to a high of $126 on December 25. This was a new yearly high.
However, the SOL price has fallen since. On January 19, 2024, it broke down from the ascending support trend line. At the time, the trend line had been in place for 96 days. Currently, SOL trades inside the 0.382 Fib retracement support level.

The daily RSI gives a bearish reading. When evaluating market conditions, traders use the RSI as a momentum indicator to determine whether a market is overbought or oversold and whether to accumulate or sell an asset.
If the RSI reading is above 50 and the trend is upward, bulls still have an advantage, but if the reading is below 50, the opposite is true. The indicator is below 50 and falling (red icon), both signs of a bearish trend.
What do Analysts Say?
Cryptocurrency traders and analysts on X have a predominantly negative view of the future SOL trend.
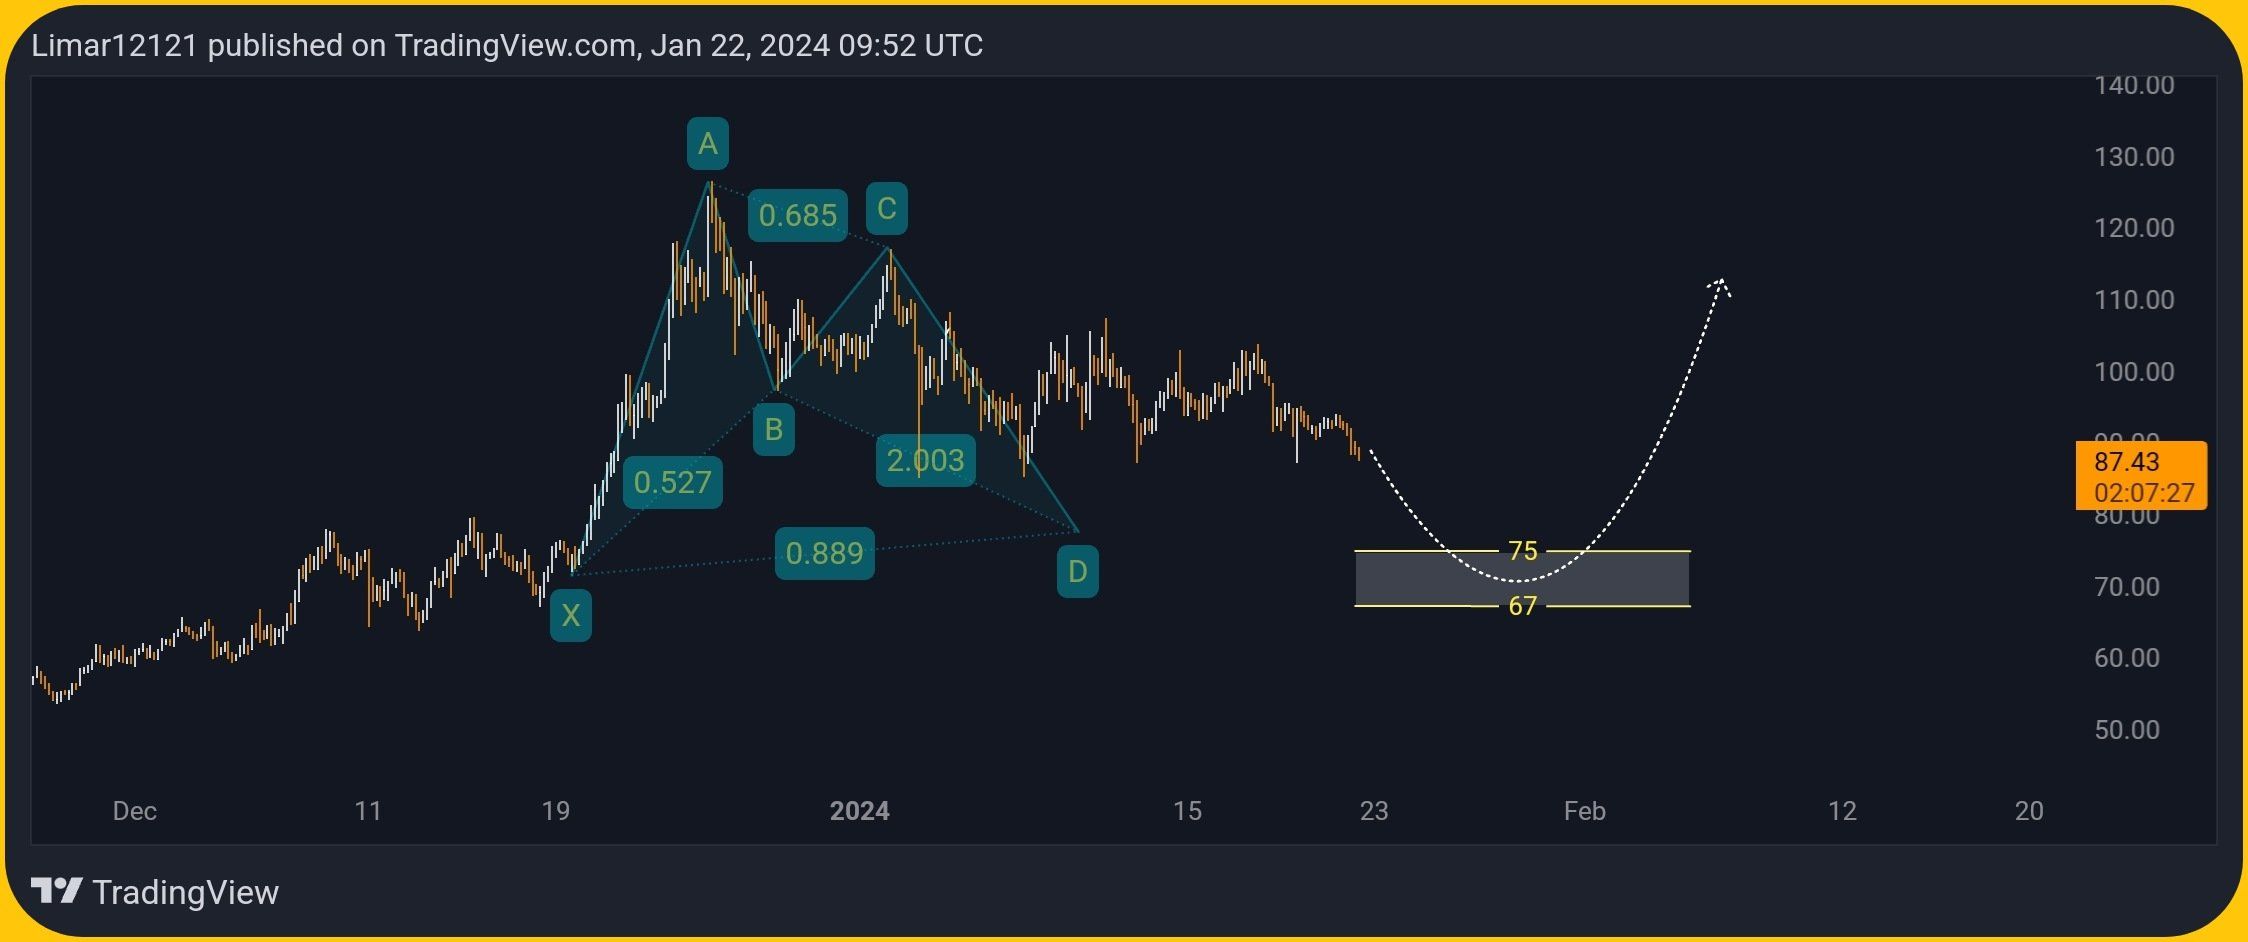
Lmn12121 is bearish, suggesting that the SOL price will fall to $70.
The Lord of Entry noted the breakdown from the ascending support trend line, tweeting:
$SOL Daily – #SOLUSDT looking a bit bearish here with the loss of trend from October, candle closes below this current support and the 77 region starts looking like a thing
Finally, BluntzCapital noted a fractal with the Bitcoin (BTC) price in 2018. He suggested that while SOL is likely to fall to $70, this will mark a long-term bottom.
Read More: Top 6 Solana Projects With Massive Potential
SOL Price Prediction: When Will the Correction End?
Similarly to the daily time frame, the six-hour one gives a bearish reading. This is because of the price action, RSI, and Elliott Wave count.
Technical analysts employ the Elliott Wave theory to identify recurring long-term price patterns and investor psychology, which helps them determine the direction of a trend.
Read More: What Is Solana (SOL)?
The most likely count suggests that SOL is in the C wave of an A-B-C corrective structure. The B-wave took the shape of a triangle, common in such corrective waves.
The price action shows that SOL broke out from the symmetrical triangle, confirming the correction. Additionally, the RSI is below 50 and falling, both signs if a bearish trend.
If the decrease continues, SOL can fall another 20% to a confluence of supports between $70-$72. A horizontal support area creates the support, the 0.618 Fib retracement support level, and the triangle’s height projected to the breakdown level.
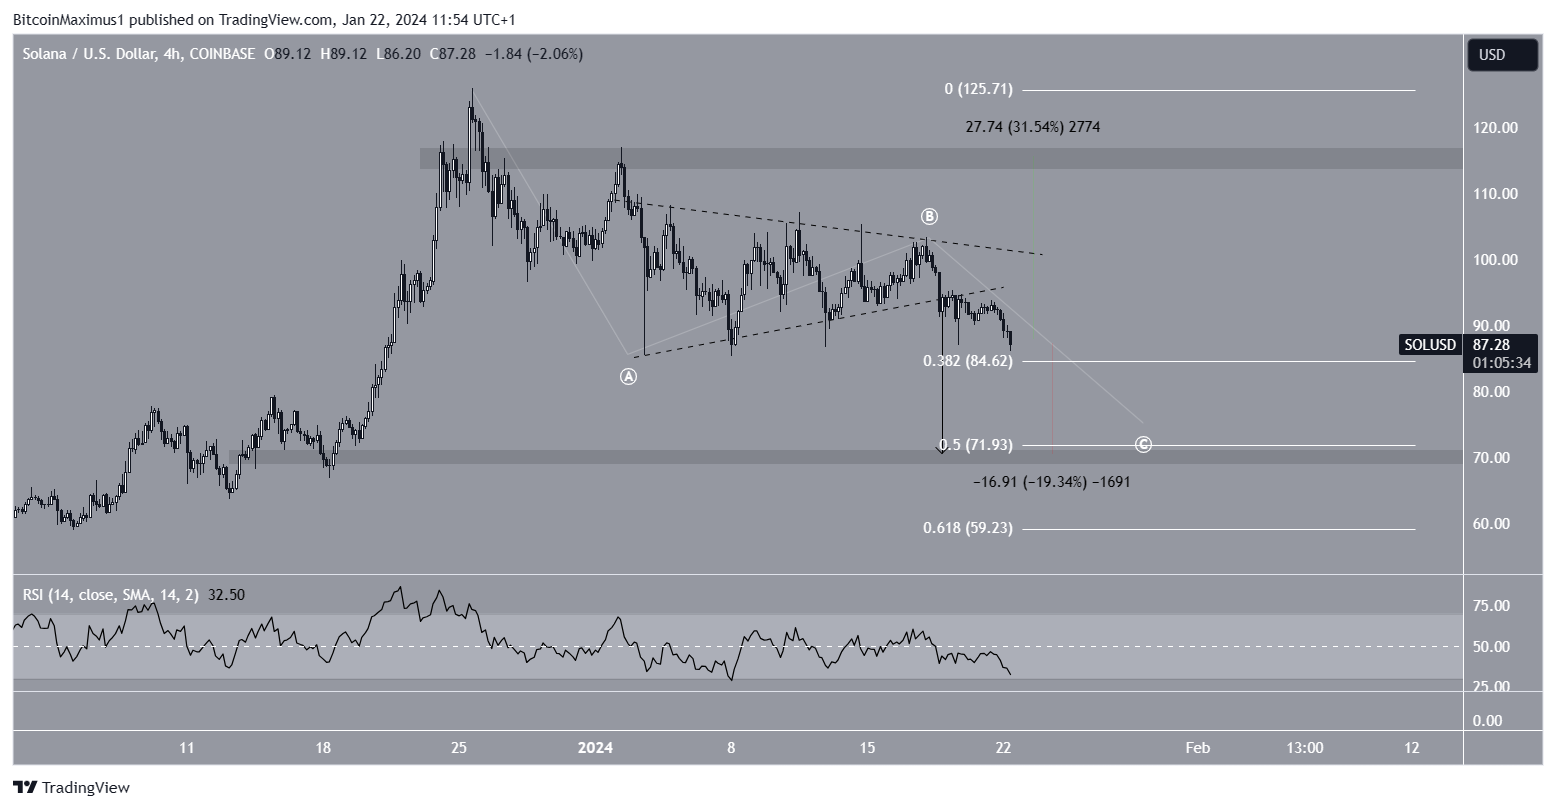
Despite this bearish Solana price prediction, reclaiming the triangle’s support trend line will mean the correction is over. Then, SOL can increase 30% to the next resistance at $115.
For BeInCrypto’s latest crypto market analysis, click here.


