


The Solana price has decreased since its high of $126 on December 25, 2023. It created successive bearish weekly candlesticks for the first time since October.
Will the SOL price continue falling this week, or has the bottom been reached? Let’s find out!
Solana Starts 2024 on a Bearish Note
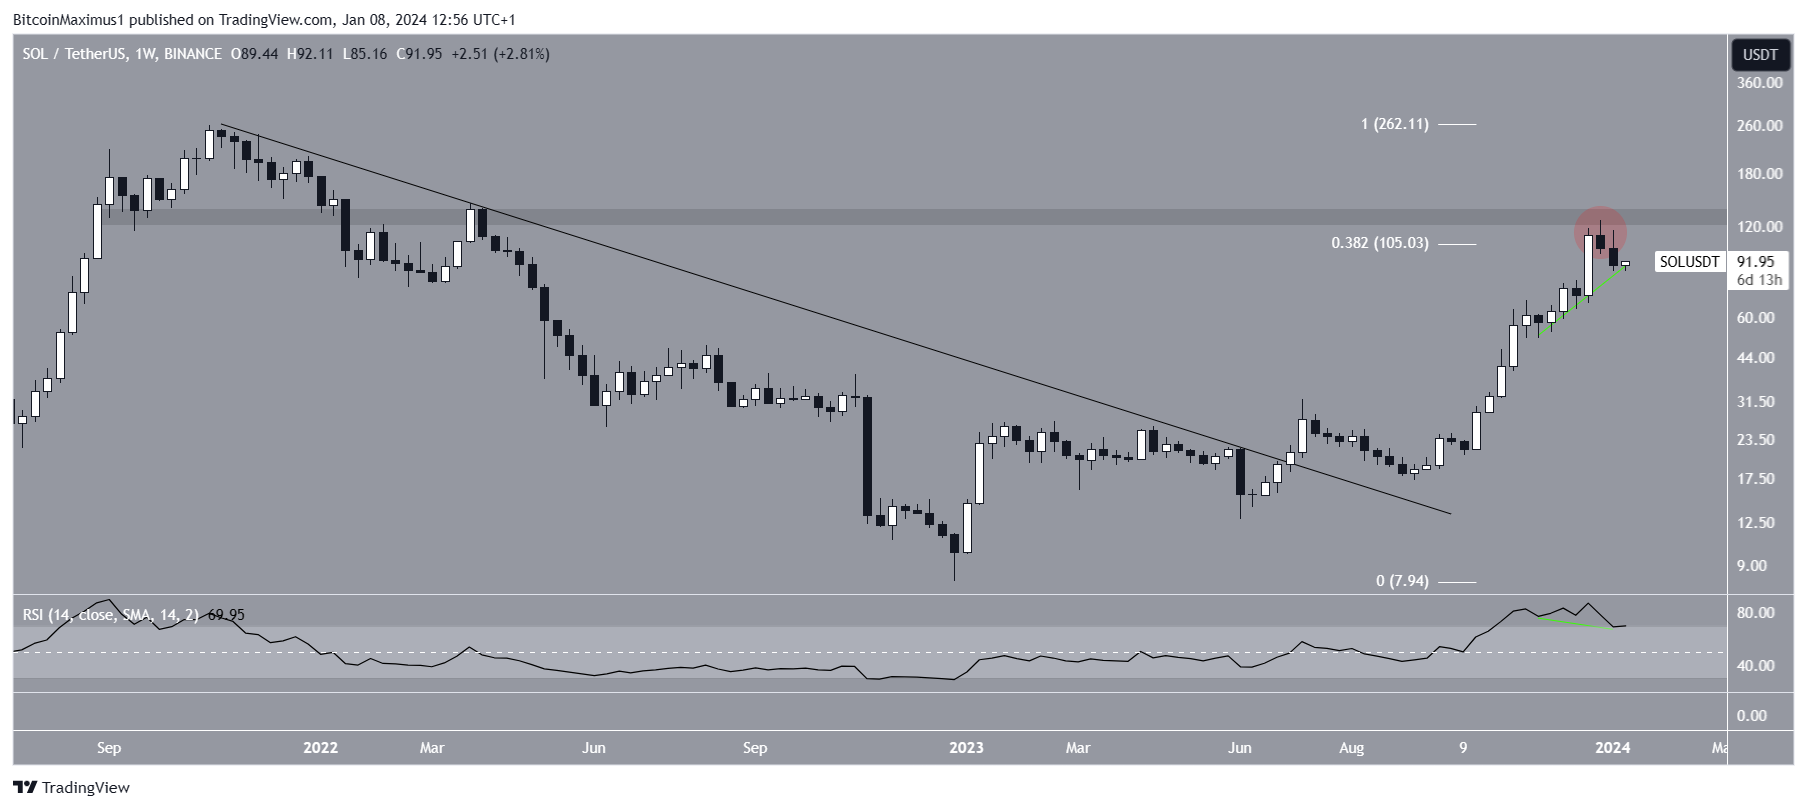
SOL’s price has risen since breaking through a descending resistance trend line in July 2023. In September, it confirmed the same trend line as a support, accelerating the upward trajectory. This climb peaked at $126 in December, marking the top of the upward movement that started in 2023.
Notably, this surge led to a breakout above the 0.382 Fib retracement resistance level, encompassing the entire downward movement from the all-time high. However, the price failed to break out from a long-term horizontal resistance area.
Additionally, a recent downturn has caused SOL’s price to dip below the Fib level, classifying the prior breakout as a deviation (red circle).
Finally, it is worth mentioning that SOL created successive bearish weekly candlesticks for the first time since October 2023. The Solana price also reached a weekly close below $100.
The Relative Strength Index (RSI) is a key momentum indicator traders use to assess market conditions. Typically, an RSI above 50 and an upward trend signal a bullish advantage, while readings below 50 indicate the opposite.
The RSI gives mixed readings. While the indicator is falling and is in overbought territory, it has generated a hidden bullish divergence (green).
SOL Price Prediction: Is the Bottom Close?
Solana appears to be undergoing a corrective wave on the daily time frame of technical analysis.
Employing Elliott Wave theory, which analyzes long-term price patterns and investor psychology to discern trend directions, the prevailing wave count suggests that SOL is currently in the fourth wave of a five-wave upward movement (white).
This interpretation is reinforced by the daily RSI, which exhibited a bearish divergence in conjunction with the $126 high (green). Notably, in the recent market movement, the price reached and rebounded from the 0.382 Fib retracement support level at $86 (green icon).
Altcoin Sherpa, a cryptocurrency trader, observed this rebound but suggested that the price could fall to the 0.5 Fib retracement support level at $72. However, several other analysts believe the Solana price will continue falling well below $100.
Read More: What Is Solana (SOL)?
Typically, wave fours often take the form of a symmetrical triangle. Therefore, it is plausible that the bottom of the corrective phase has been reached, and the SOL price could consolidate within the triangle before experiencing a breakout.
If this scenario unfolds, a potential target for the culmination of the SOL upward movement is projected at $180, a 90% increase from the current price.
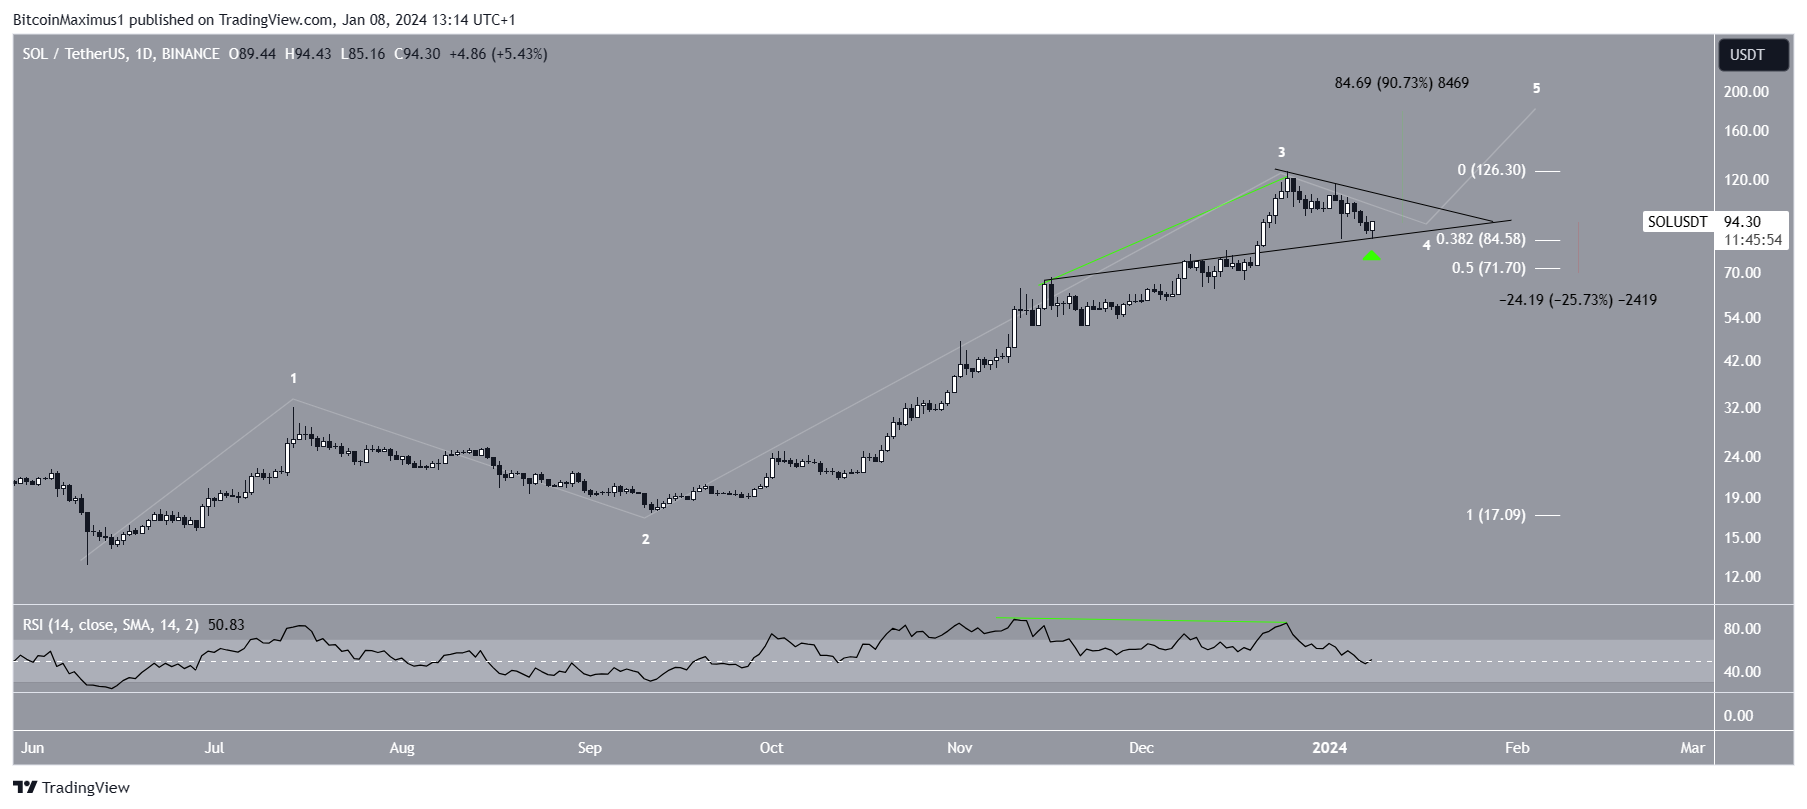
Despite this bullish SOL price prediction, the bullish outlook will be invalidated if the price breaks down from the triangle. Then, a 25% decrease to the 0.5 Fib retracement support level at $72 could occur.
For BeInCrypto’s latest crypto market analysis, click here.
Read More: Solana vs Ethereum



