The Rocket Pool (RPL) price bounced on August 9, validating the $25 horizontal area as resistance. Despite the bounce, it failed to break out from a crucial diagonal resistance.
The reaction to this resistance line will determine if the future price trend is bullish or bearish.
Rocket Pool Bounce Insufficient to Clear Resistance
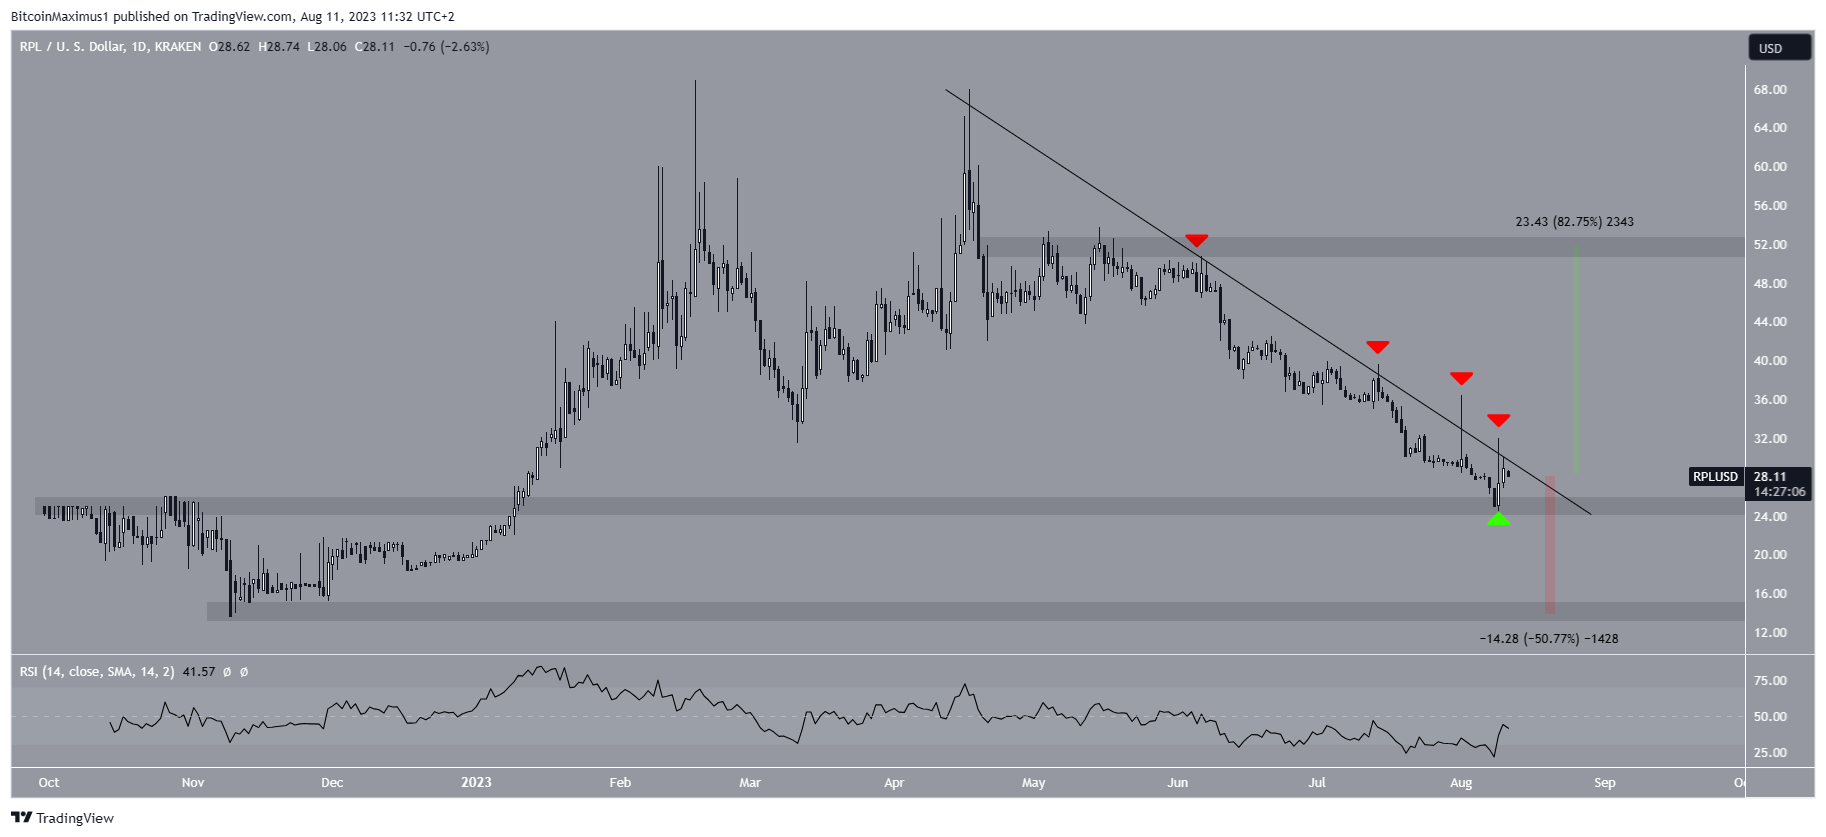
The RPL price has fallen under a descending resistance line since April 17. The resistance line has been validated numerous times so far (red icons). The line was touched as recently as today.
While following this line, RPL fell to a low of $24.46. The ensuing bounce (green icon) supported the $25 area. The $25 area is crucial since it had previously provided resistance. After the breakout, the area is expected to provide support.
The bounce coincided with news that Coinbase Ventures has invested in the Rocket Pool platform, purchasing RPL tokens from the team. The platform currently controls roughly 3% of the Ethereum staking market, with nearly 780,000 ETH staked.
If the price breaks out from the resistance line, it can increase by 80% and reach the next resistance at $52. On the other hand, rejection and breakdown below $25 can lead to a 50% drop to the next support at $14.

The daily RSI provides mixed readings. Traders utilize the RSI as a momentum indicator to assess whether a market is overbought or oversold and to determine whether to accumulate or sell an asset.
If the RSI reading is above 50 and the trend is upward, bulls still have an advantage, but if the reading is below 50, the opposite is true. The indicator is below 50 but increasing. Therefore, it fails to determine the future trend’s direction.
Want to learn how to make money in a bear market? Click here.
RPL Price Prediction: Breakout or Breakdown?
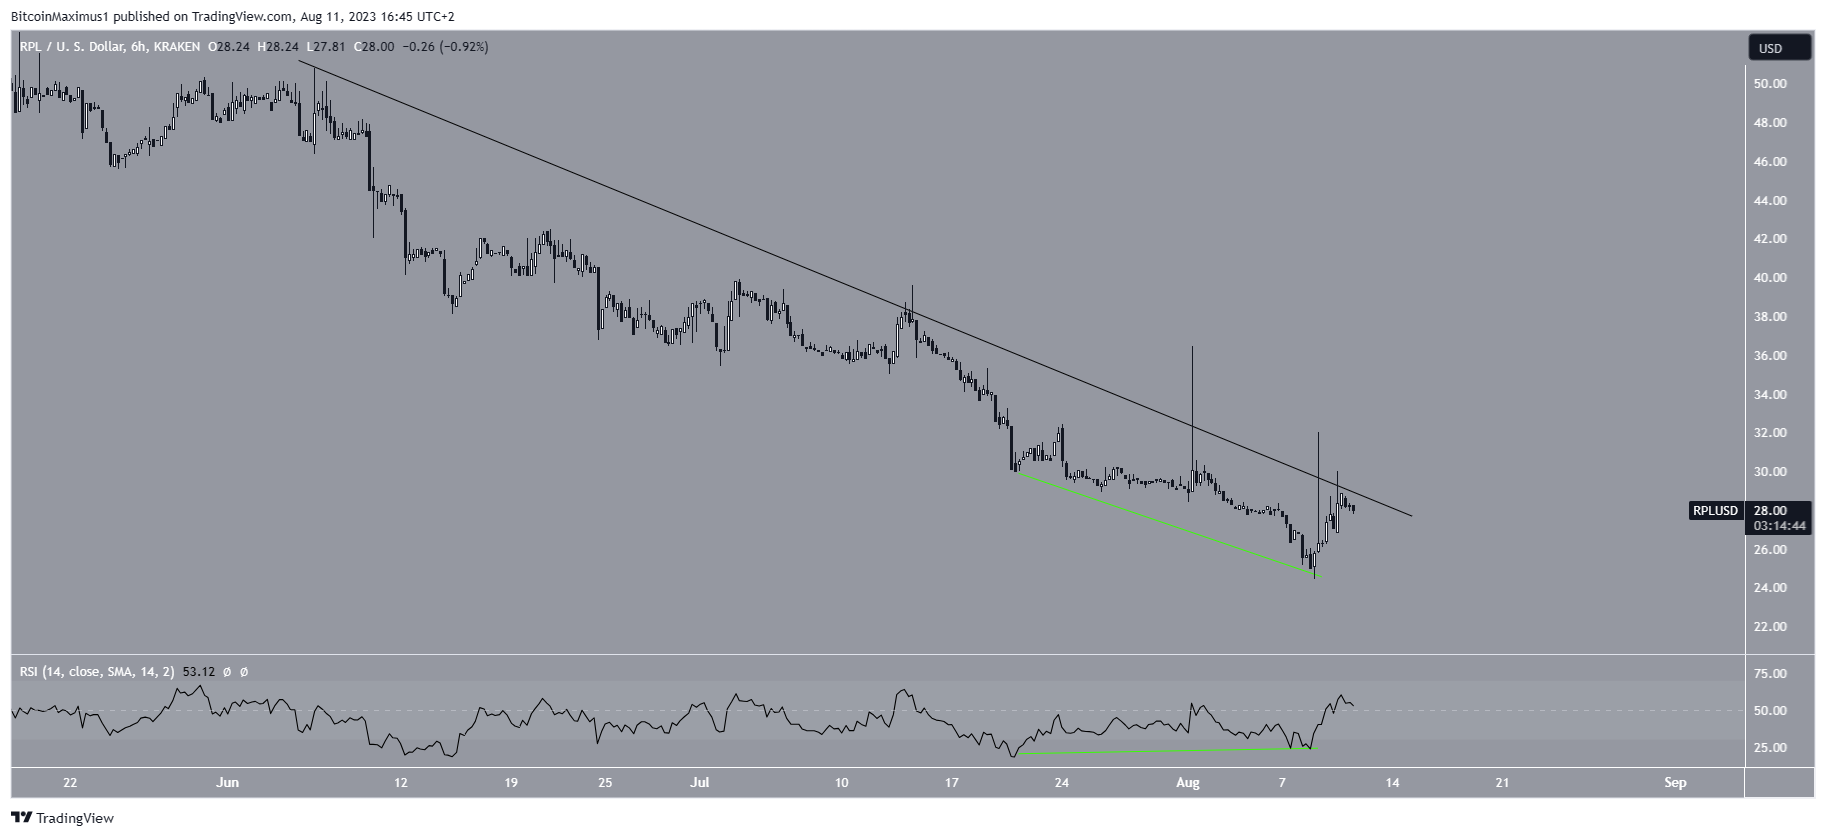
While the daily timeframe readings are inconclusive, the six-hour chart provides a more bullish outlook. The main reason for this comes from the RSI.
The indicator has generated a bullish divergence (green line) and just moved above 50. A bullish divergence occurs when a momentum increase accompanies a price decrease. It means the previous drop was illegitimate, and an upward movement usually follows. The fact that the RSI is now above 50 further supports this possibility.
A breakout from the line is required to confirm the divergence and potentially catalyze an increase to $52.

Despite this bullish RPL price prediction, a close below the $25 area will mean that the trend is bearish and can lead to a 50% drop.
For BeInCrypto’s latest crypto market analysis, click here.
Disclaimer
In line with the Trust Project guidelines, this price analysis article is for informational purposes only and should not be considered financial or investment advice. BeInCrypto is committed to accurate, unbiased reporting, but market conditions are subject to change without notice. Always conduct your own research and consult with a professional before making any financial decisions. Please note that our Terms and Conditions, Privacy Policy, and Disclaimers have been updated.

