
The Oasis Network (ROSE) price has increased rapidly since October and reached a new yearly high today.
The price is approaching a pivotal horizontal resistance area in place since 2022. Will ROSE break out?
ROSE Reaches 470-Day High
The ROSE price has increased since September. It created a higher low in October (green icon) and accelerated its rate of increase afterward.
Since then, six of the seven weekly candlesticks have been bullish. This week, the ROSE price reached a high of $0.088, an increase of more than 130% since the September low, a new yearly high and the highest price in 470 days.
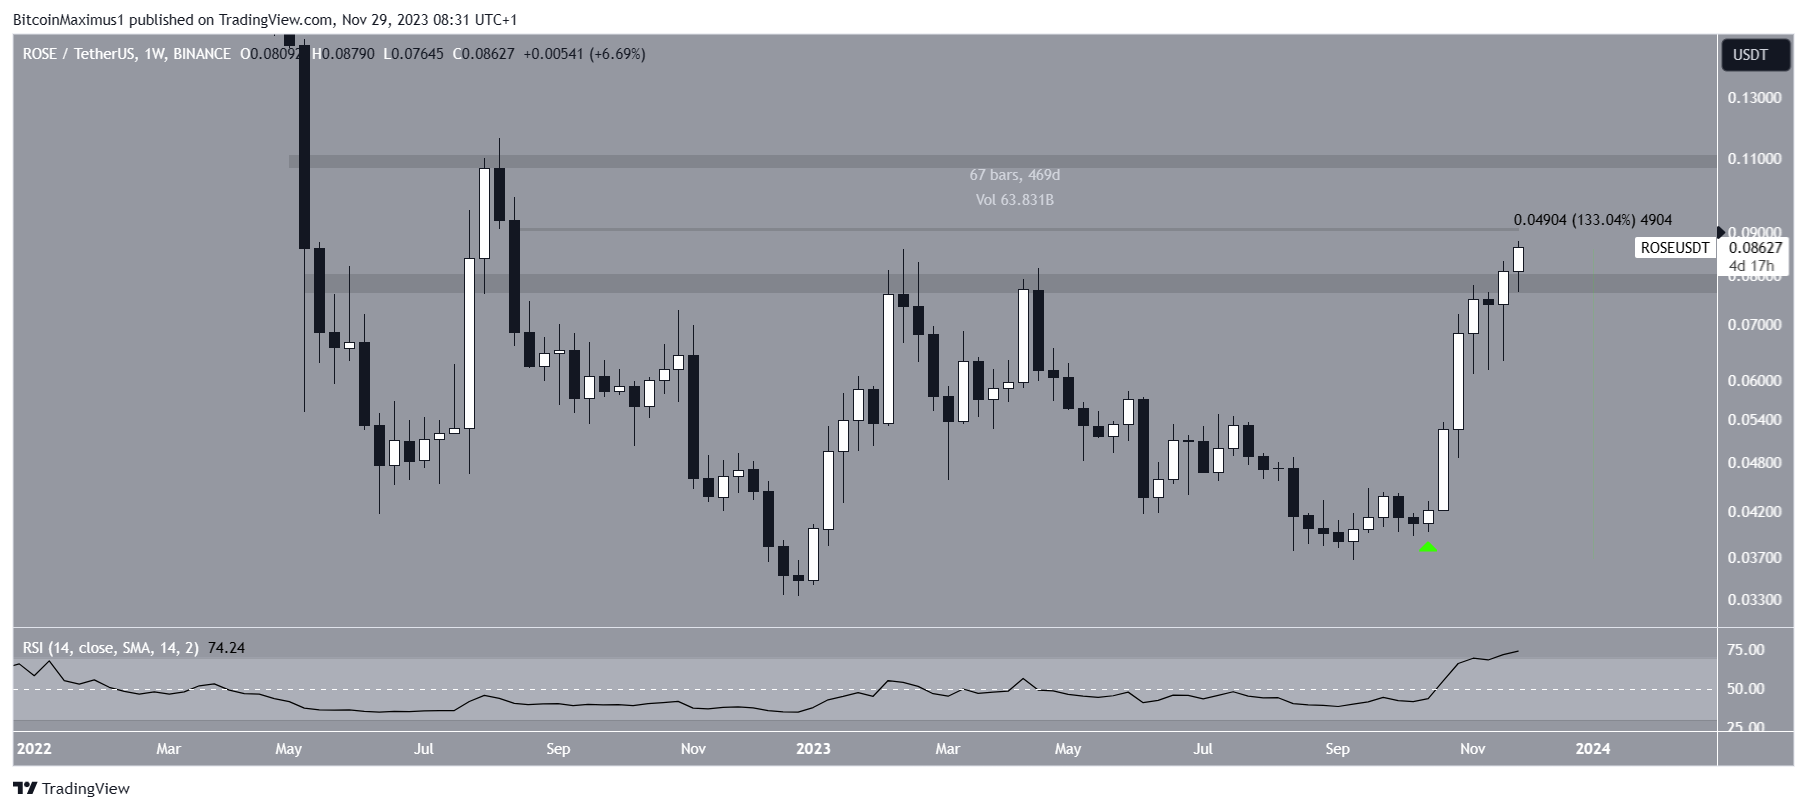
Market traders use the Relative Strength Index (RSI) as a momentum indicator to identify overbought or oversold conditions and to decide whether to accumulate or sell an asset.
Readings above 50 and an upward trend indicate that bulls still have an advantage, whereas readings below 50 suggest the opposite.
The weekly RSI is increasing and is above 50. However, it is worth mentioning that the indicator is in overbought territory.
What do Analysts Say?
Cryptocurrency traders and analysts on X have a bullish view for the future trend.
Cryptoholicboy believes that the price is in the process of breaking out from a horizontal resistance are and will increase significantly in the short-term.
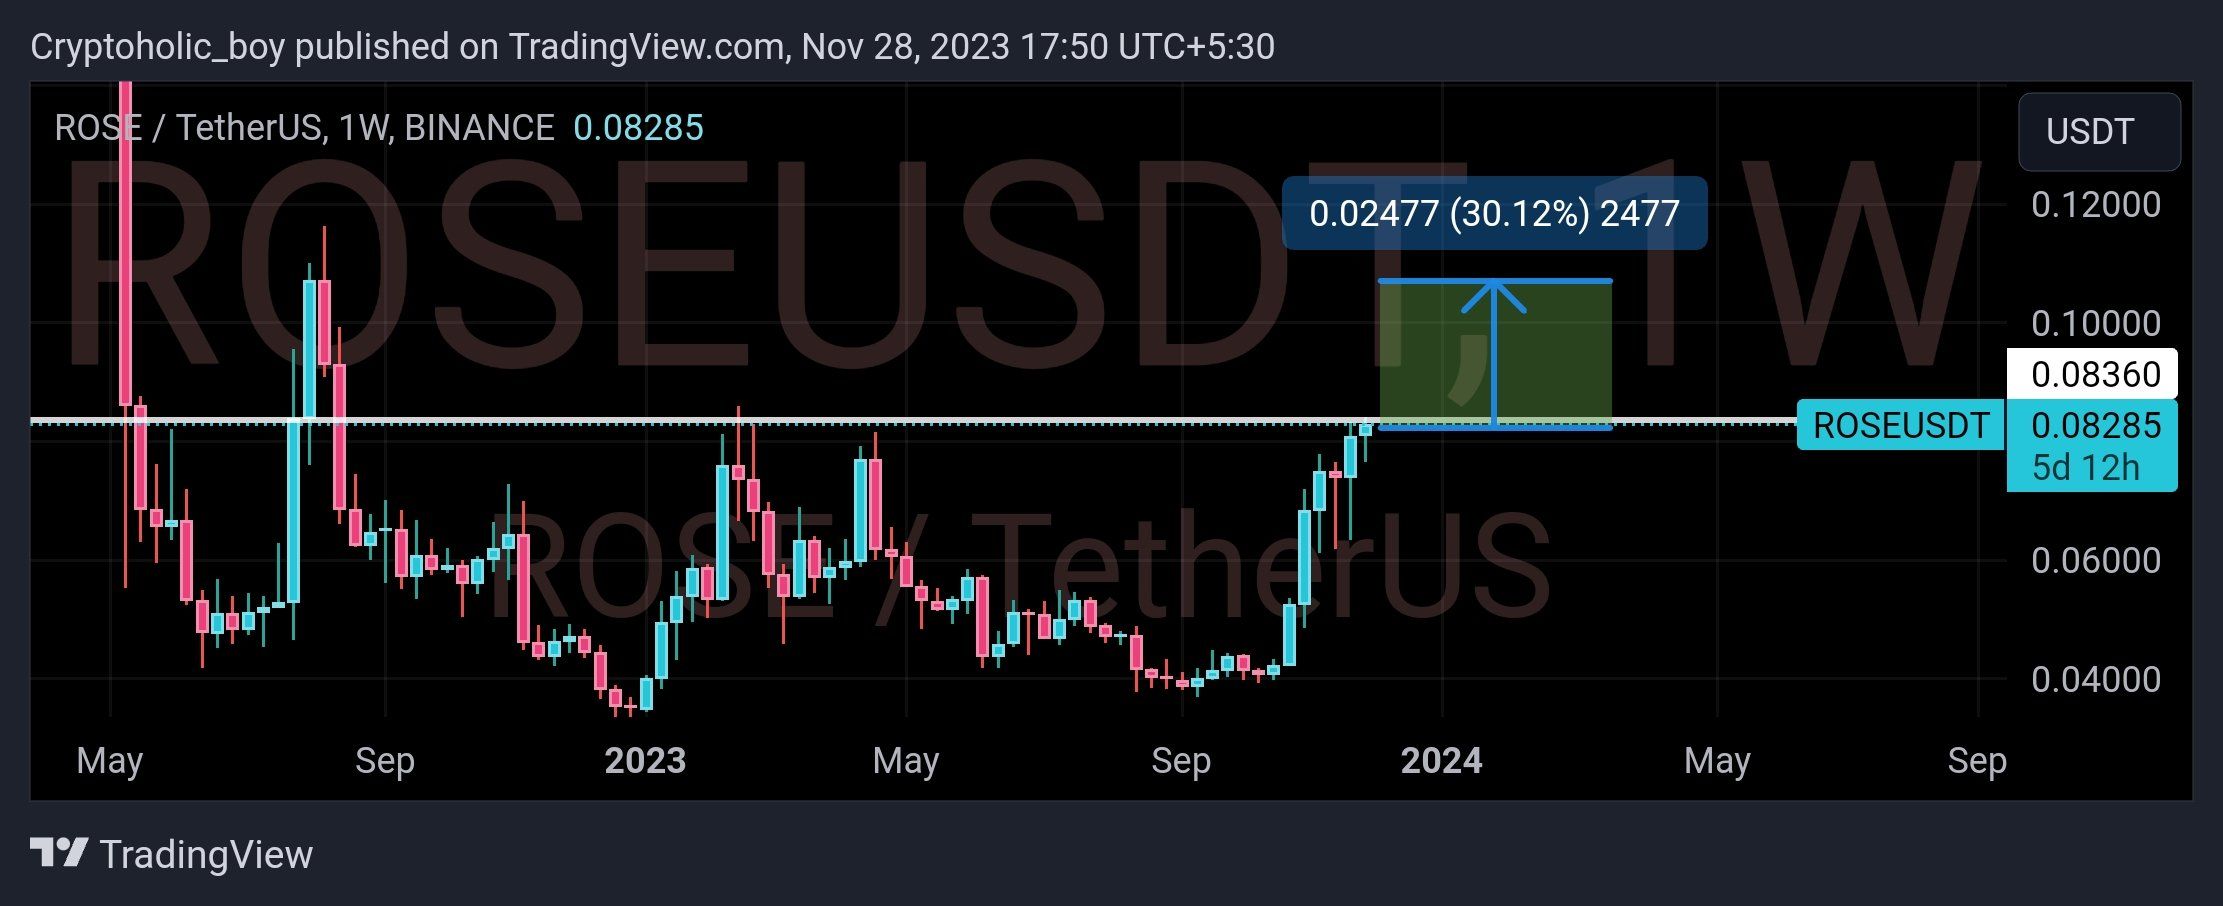
Quang Avenue is bullish for the same reason. He suggested that the breakout from a critical horizontal resistance area can trigger a significant upward movement.
Bitcoin Vanga is also bullish, but he used an ascending parallel channel to come to his conclusion. He stated that:
The climb continues within its ascending channel, with the price now hovering around $0.08532. The uptrend remains strong, suggesting further potential. Stay tuned for the next moves!
Read More: Best Crypto Sign-Up Bonuses in 2023
ROSE Price Prediction: Where to Next?
Similarly to the weekly timeframe, the daily one also provides a bullish outlook. The main reason for this is the RSI.
The indicator broke out from its bearish divergence trend line (green) and bounced at 50 (green icon). Both are considered signs of a bullish trend and support the continuing of the increase.
At the same time, the altcoin broke out from a descending resistance trend line.
If the upward movement continues, ROSE can increase by more than 20% and reach the next resistance at $0.11.
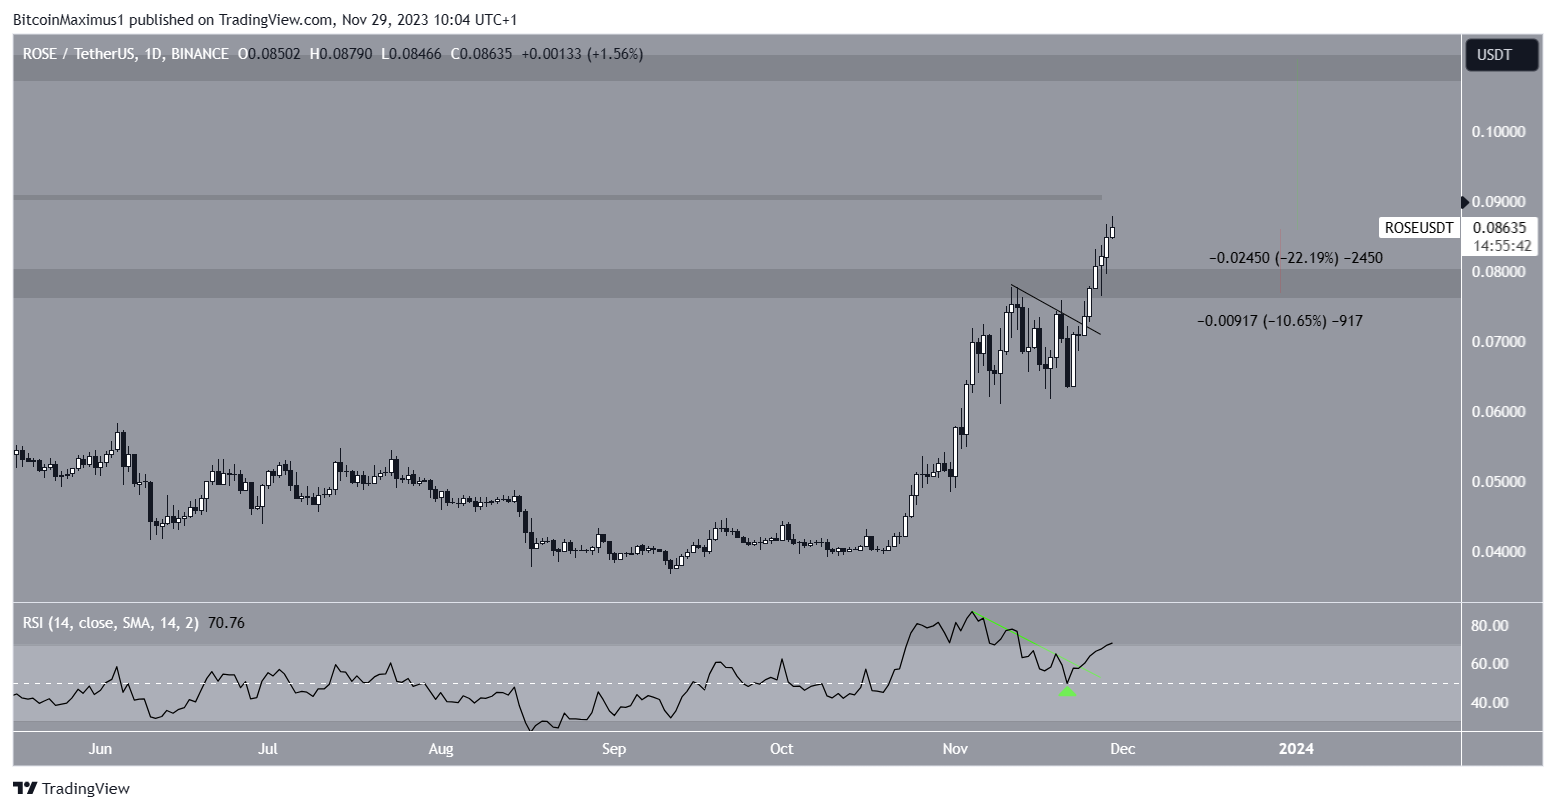
Despite this bullish ROSE price prediction, failure to sustain the increase can lead to a 10% drop that would validate the $0.078 area as resistance.
However, this would not invalidate the bullish trend. That would only occur if the ROSE price reached a weekly close below $0.078.
For BeInCrypto’s latest crypto market analysis, click here.
