


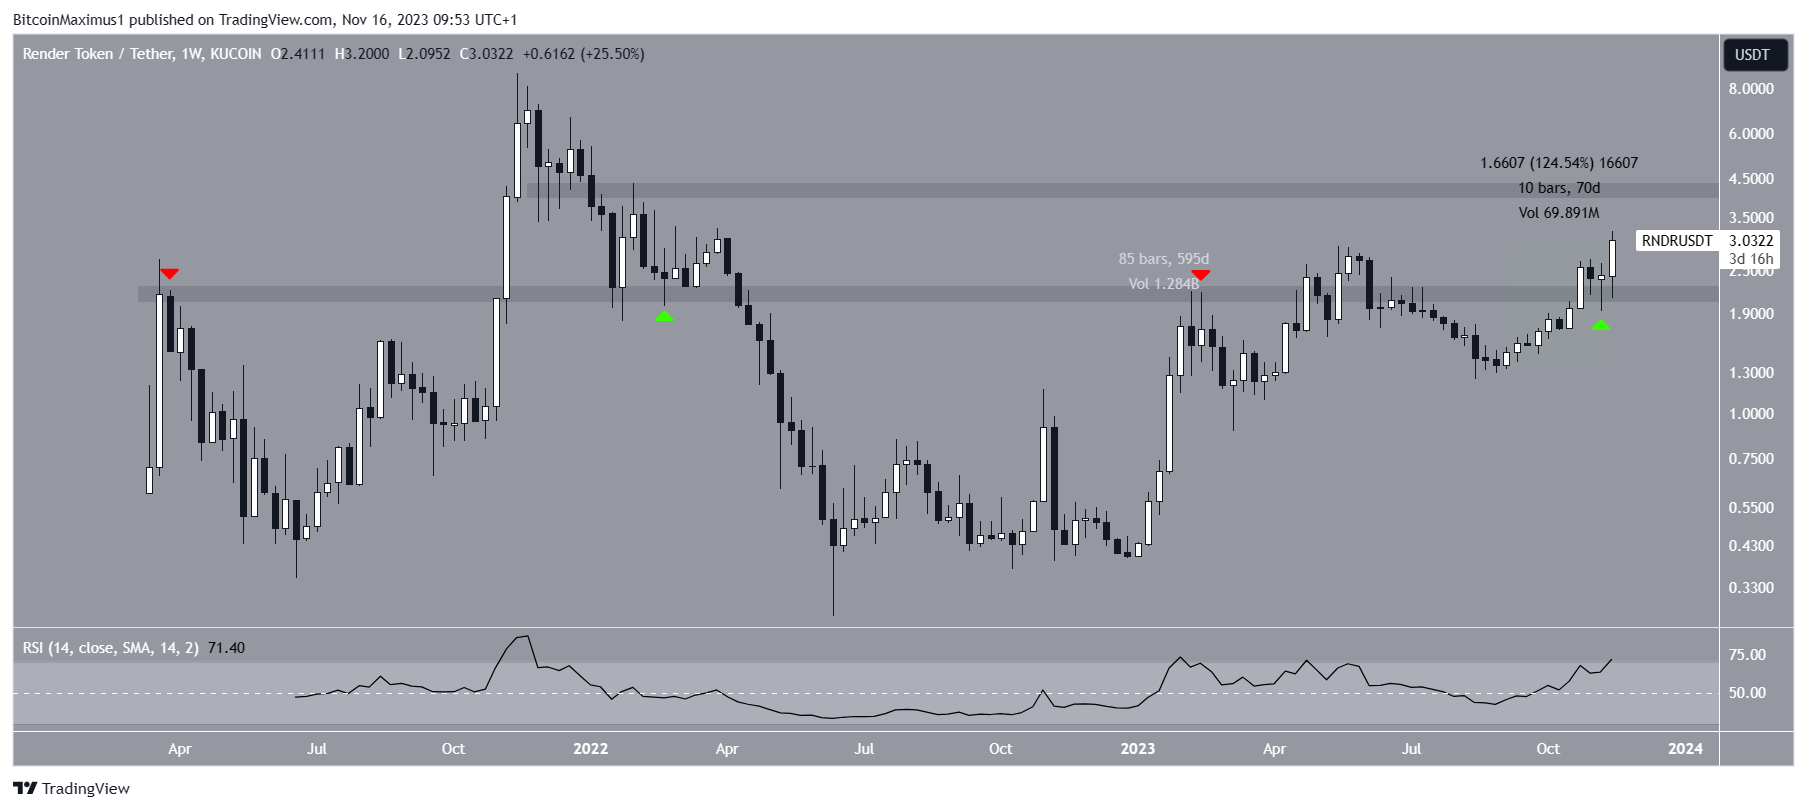
The RNDR price began a significant upward movement yesterday and reached a new yearly high of $3.20 on Thursday.
The upward movement also confirmed a breakout from the $2.20 horizontal area, which has caused price reactions since March 2021.
Render Price Moves Above $3
The RNDR price has increased swiftly since the start of September. In 70 days, RNDR increased by 125%.
At the beginning of October, the altcoin broke out from the $2.20 horizontal area. This crucial area has intermittently acted as both resistance and support (red and green icons) since March 2021.
After validating it as support next week (green icon), the RNDR price accelerated its rate of increase this week. The RNDR high of $3.20 is a new yearly high and the highest price in nearly 600 days.
Read More: 9 Best AI Crypto Trading Bots to Maximize Your Profits
The weekly RSI is increasing and is above 50, both positive signs. Additionally, the RSI has nearly crossed above 70, another sign that the rally is picking up steam.
Traders use the RSI as a momentum indicator to identify overbought or oversold conditions and to decide whether to accumulate or sell an asset.
Readings above 50 and an upward trend indicate that bulls still have an advantage, whereas readings below 50 suggest the opposite.
Technical analysts employ the Elliott Wave Theory to identify recurring long-term price patterns and investor psychology, which helps them determine the direction of a trend.
Cryptocurrency trader AltStreetBet used Elliott Wave Theory to suggest that the RNDR price will increase towards a new all-time high. He states that the price is likely in wave three of a five-wave upward movement.
Wealthwhizkid is also bullish on RNDR. However, his positive sentiment comes from fundamental analysis. He believes that emerging technology demand, integration with major tech ecosystems, and cost efficiency are the main reasons RNDR has a future.
More specifically, he said:
“Considering the GPU shortage in the world, Render Network’s unique value proposition in utilizing decentralized GPU power will probably make it huge.”
Read More: 9 Best Crypto Demo Accounts For Trading
RNDR Price Prediction: Can Price Reach New All-Time High?
The most likely Elliott Wave count suggests that the RNDR price is in the third wave of a five-wave upward movement (black) that began in June. The third wave is often the sharpest and largest of the bullish waves.
The first potential target for the third wave’s top is $5.45. The target is found by giving waves one and three a 1:1.61 length. The altcoin would have to increase by 89% and reach it. It would break out from the $4.20 horizontal resistance area if it does.
If wave three extends even further, the price can reach a high of $8, giving waves one and three a 1:2.61 ratio. This would be slightly below the all-time high of $8.80.
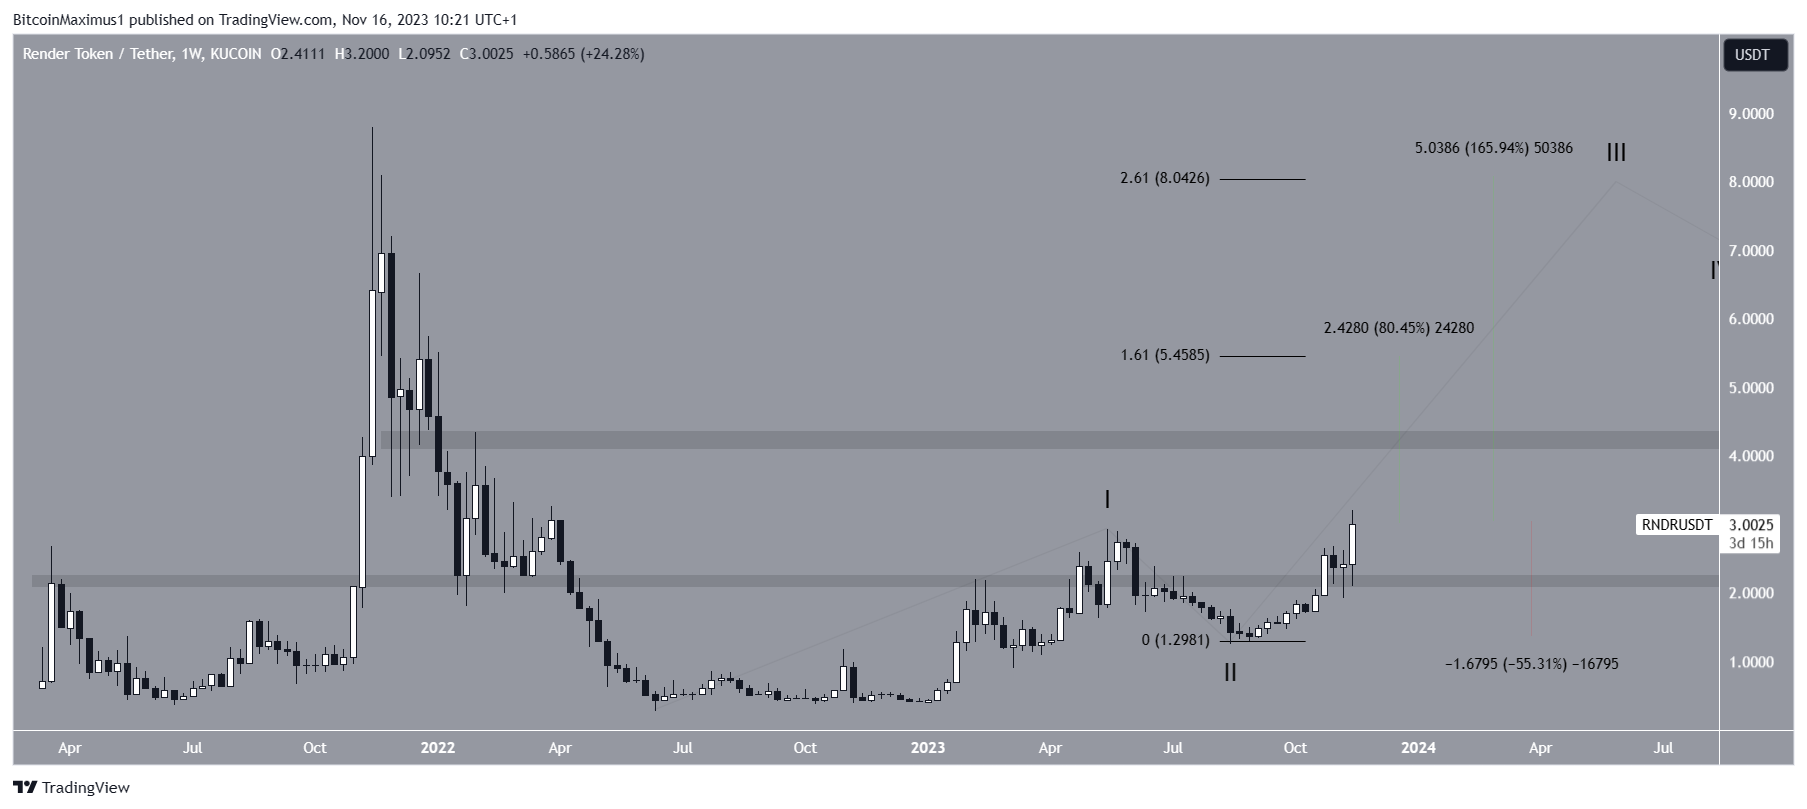
Despite this bullish RNDR price prediction, a close below the $2.20 horizontal area will put the upward movement at risk. The altcoin could fall by 55% to the $1.30 horizontal support area in that case.
For BeInCrypto’s latest crypto market analysis, click here.


