

The Polkadot (DOT) price has increased since completing a bullish pattern on June 12. It is currently trading just below a critical diagonal resistance level.
While long-term readings do not confirm the bullish trend reversal, short-term ones suggest that the DOT price has begun a new bullish trend that will continue for a significant time.
Polkadot Price Bounces After Long-Term Bullish Pattern
The price of Polkadot has experienced a decline below a descending resistance line starting from May 2022. This line has resulted in multiple rejections, including the most recent one on April 17, 2023 (red icon).
This further intensified the drop and led to a new low for the year in June, reaching $4.20.
Nevertheless, the DOT price recovered and formed a bullish engulfing candlestick two weeks later. This type of candlestick signifies a bullish trend as it negates the entire decrease of the previous period within a large, bullish candlestick.
Additionally, the price movement created a double bottom pattern (green icons) compared to the price in January, which is generally seen as bullish.
Currently, the DOT price is approaching the resistance line again, which stands at $5.70.
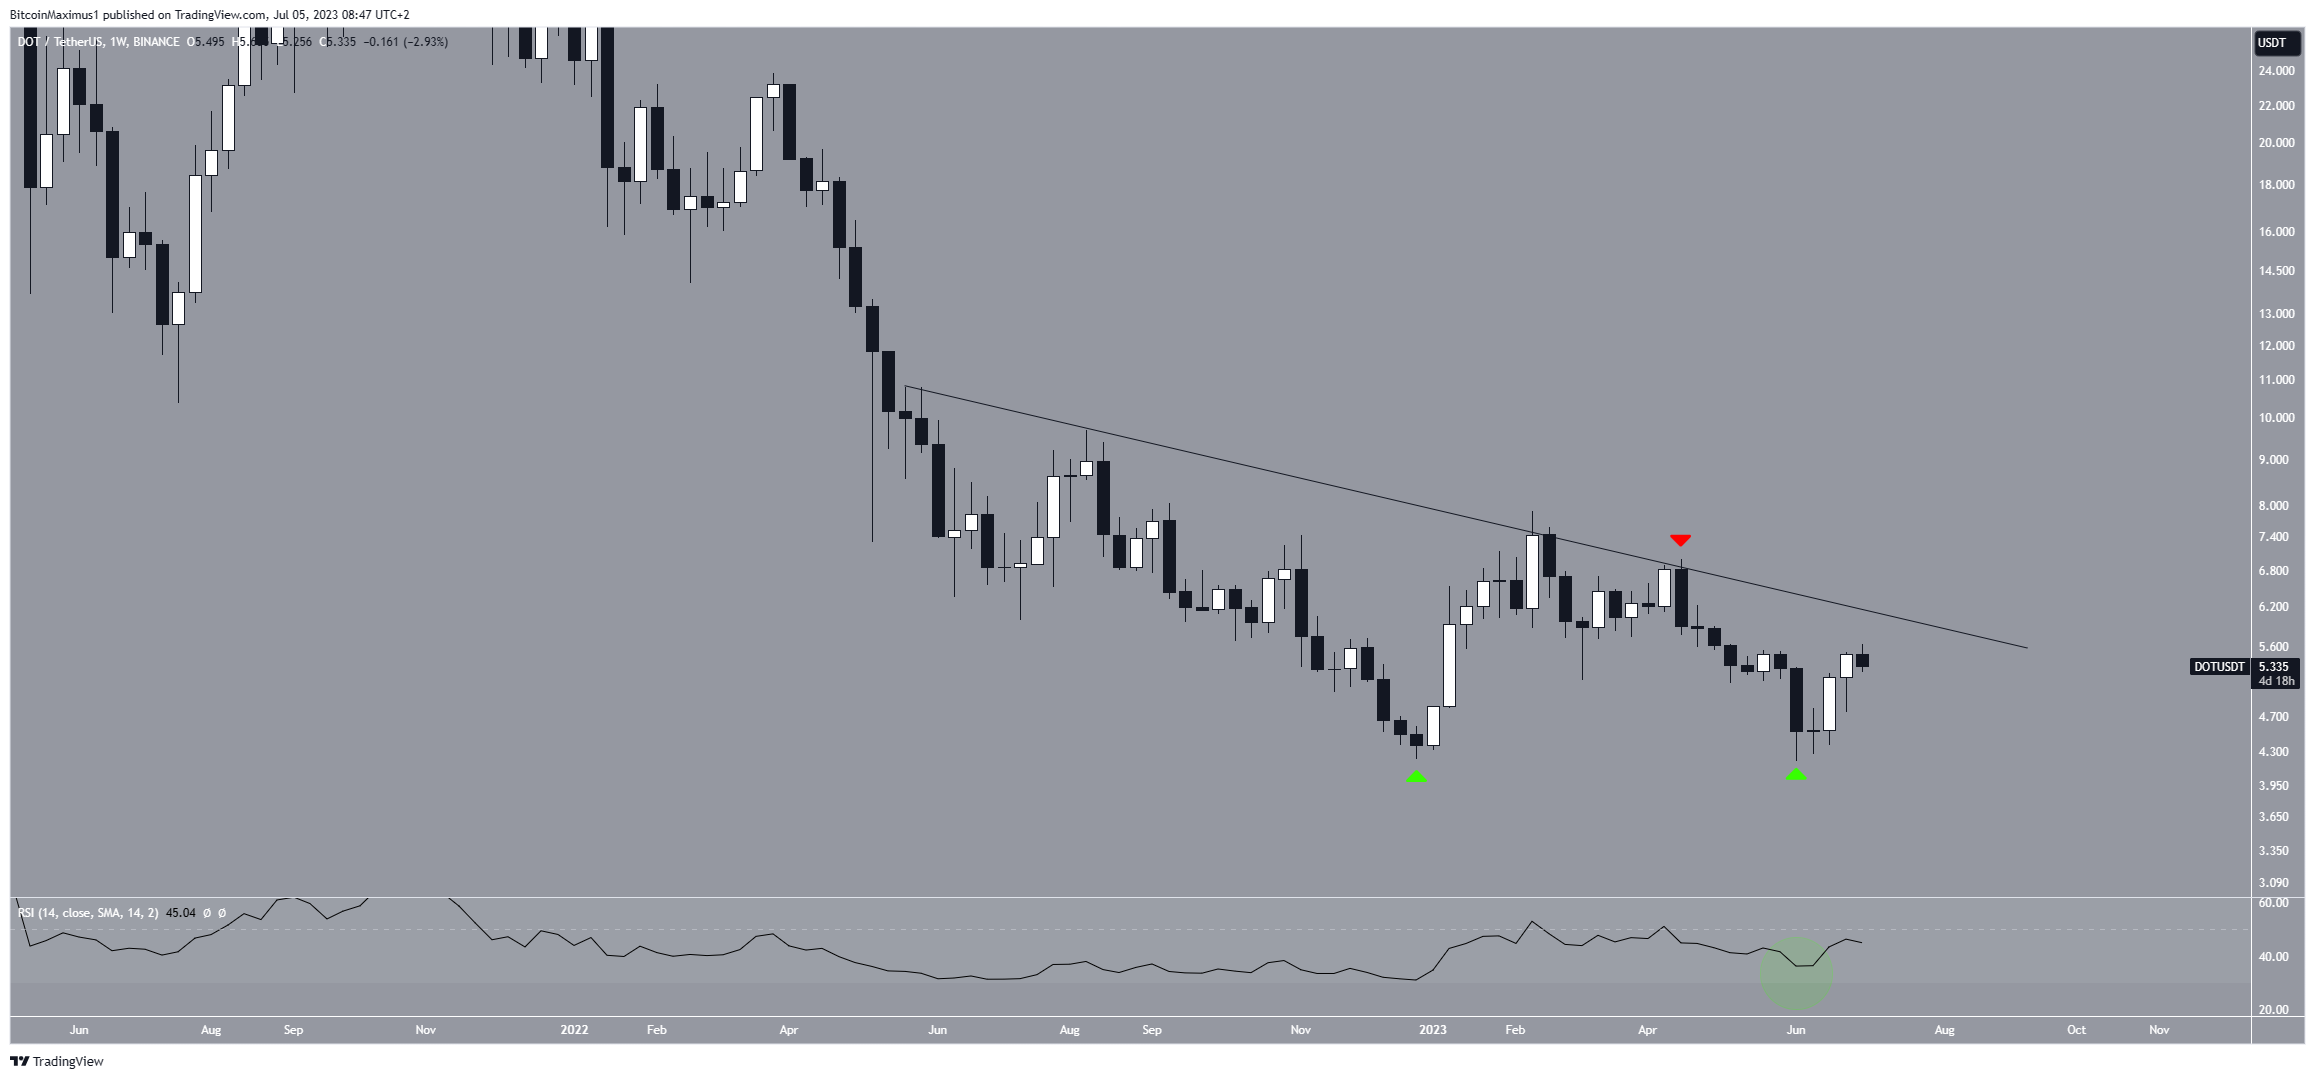
Analyzing the weekly RSI does not provide clear indications regarding the trend direction. Traders often utilize the RSI as a momentum indicator to assess whether a market is overbought or oversold, helping them decide whether to buy or sell an asset.
If the RSI reading is above 50 and the upward trend favors the bulls. Conversely, if the reading is below 50, it suggests the opposite.
Despite increasing the RSI, it is still below 50, indicating an uncertain trend. Furthermore, since the price did not close below its yearly lows, there is no bullish divergence despite the RSI showing a significantly higher low.
Read More: Best Upcoming Airdrops in 2023
DOT Price Prediction: Has the Bullish Reversal Begun?
The daily time frame technical analysis is more bullish than the weekly one. The reasons for this come from the price action, wave count, and indicator readings.
Firstly, the DOT price has reclaimed the $5.20 horizontal area. The area had previously acted as support before the price broke down at the beginning of June (red circle). Afterward, DOT was rejected by the area once but reclaimed it on the second try.
The price trades just below a short-term descending resistance line that has been in place since February. A breakout from it would confirm the bullish trend reversal and could lead to an increase to $6.50.
Furthermore, the wave count is bullish. Elliott Wave theory involves the analysis of recurring long-term price patterns and investor psychology to determine the direction of a trend. The wave count suggests that the DOT price has completed an A-B-C corrective structure (black). This supports the possibility that a low has been reached, aligning with the previously mentioned long-term double-bottom pattern.
Finally, the daily RSI is increasing and is above 50, a sign of a bullish trend.
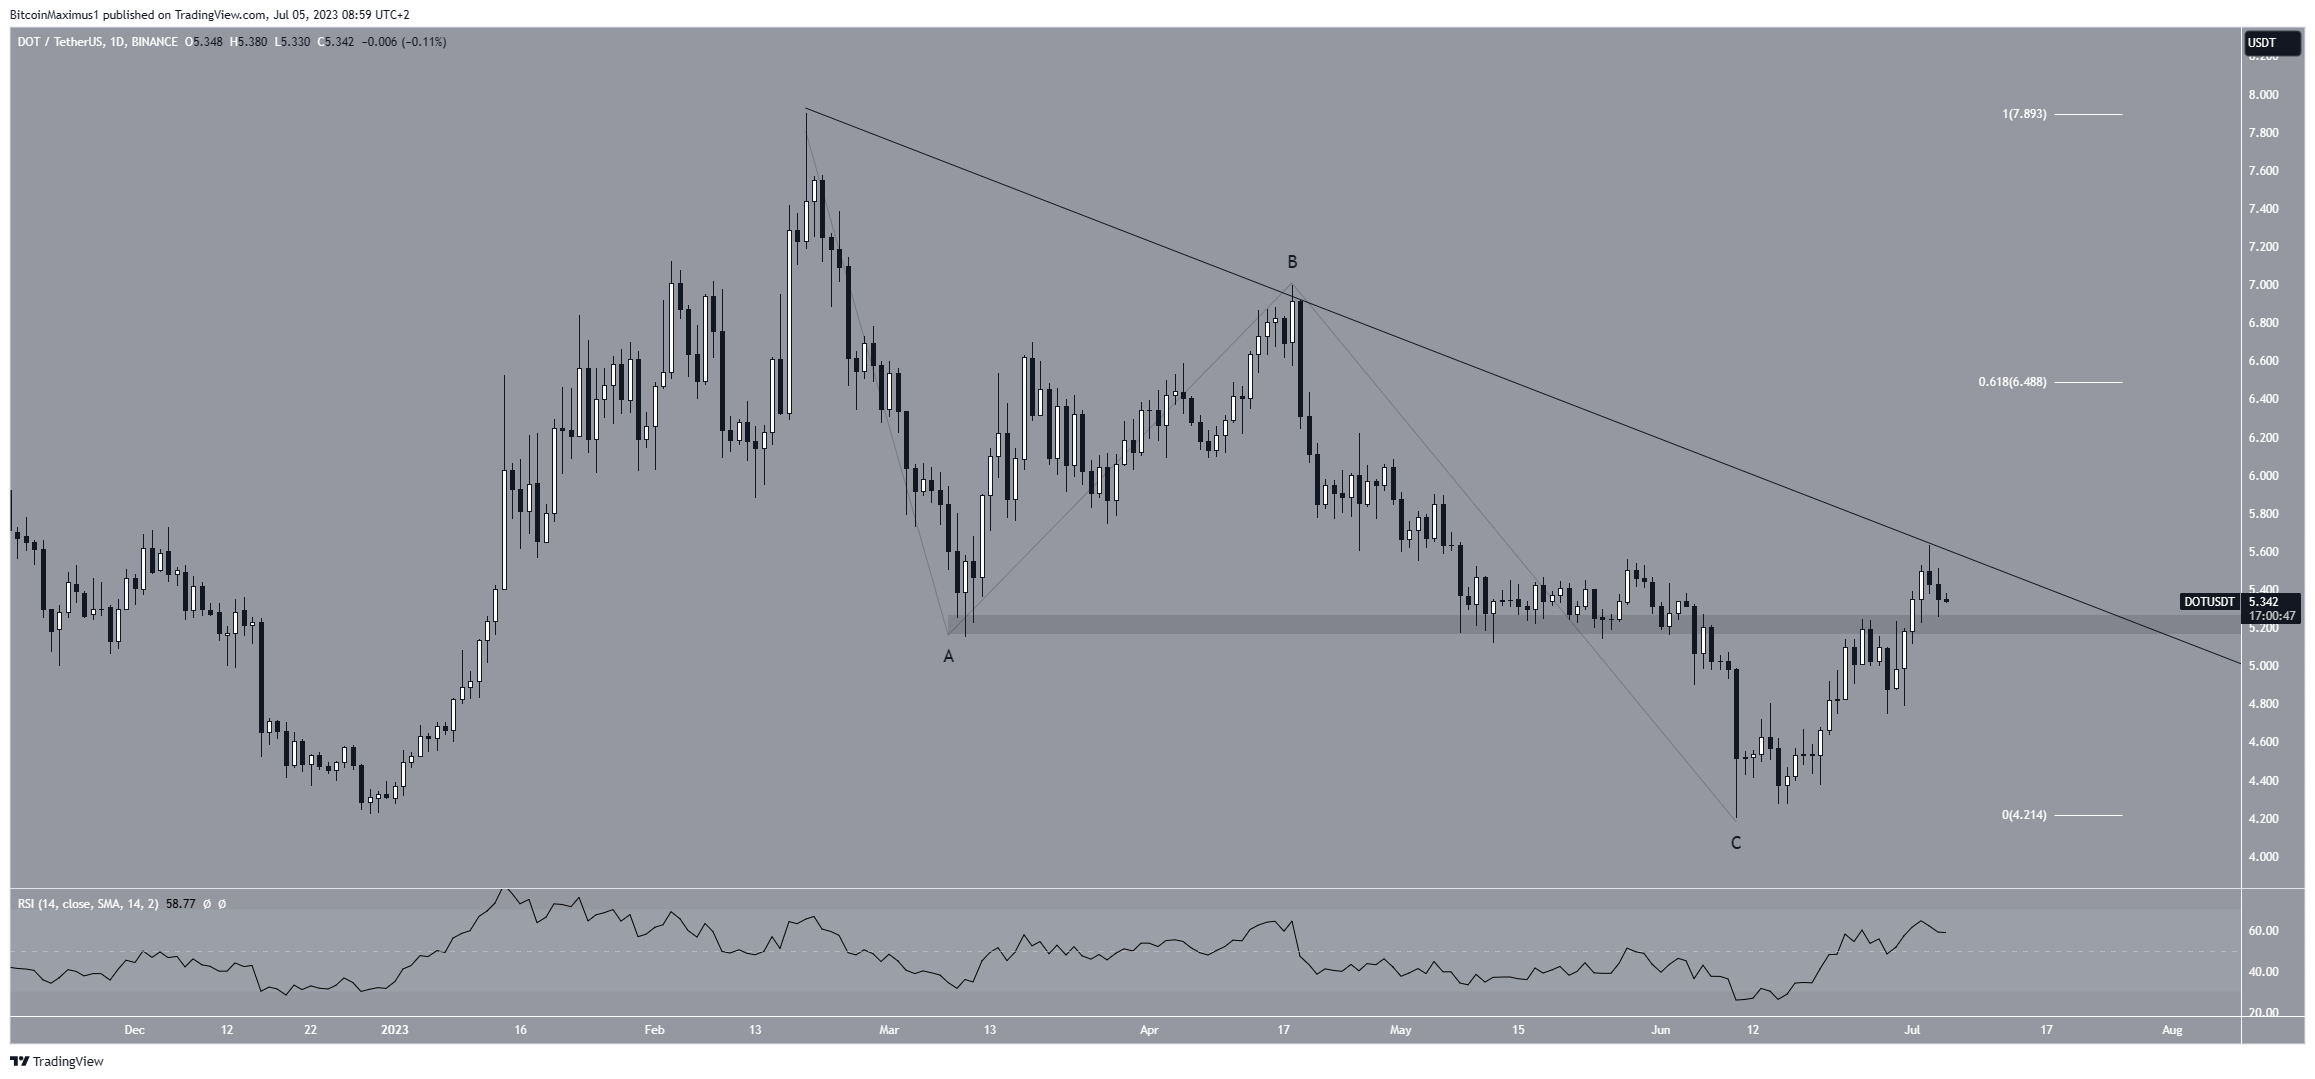
Despite this bullish DOT price prediction, a close below $5.20 will mean that the short-term trend is bearish.
While this will not invalidate the long-term bullishness, it would likely catalyze a drop to $4.60.
Read More: Best Crypto Sign-Up Bonuses in 2023
For BeInCrypto’s latest crypto market analysis, click here
Disclaimer
In line with the Trust Project guidelines, this price analysis article is for informational purposes only and should not be considered financial or investment advice. BeInCrypto is committed to accurate, unbiased reporting, but market conditions are subject to change without notice. Always conduct your own research and consult with a professional before making any financial decisions. Please note that our Terms and Conditions, Privacy Policy, and Disclaimers have been updated.
