


The Near Protocol (NEAR) price has increased swiftly since breaking out from a descending parallel channel in October.
The increase took the price above the $1.60 resistance area to a high of $2.15 today. Will the price reach a new yearly high?
NEAR Accelerates Increase After Breakout
The NEAR price had decreased inside a descending parallel channel since the start of the year. Both the resistance and support trend lines have been validated numerous times during the decrease.
After a rejection from the trend line on October 2 (red icon), NEAR culminated with a low of $0.98 on October 18.
However, the altcoin began a rapid upward movement afterward. So far, it has increased by 120% in 32 days, culminating with a high of $2.15 today. This is the highest price since April, 2023.
NEAR broke out from the $1.60 horizontal resistance area during the ascent and accelerated its increase even further.
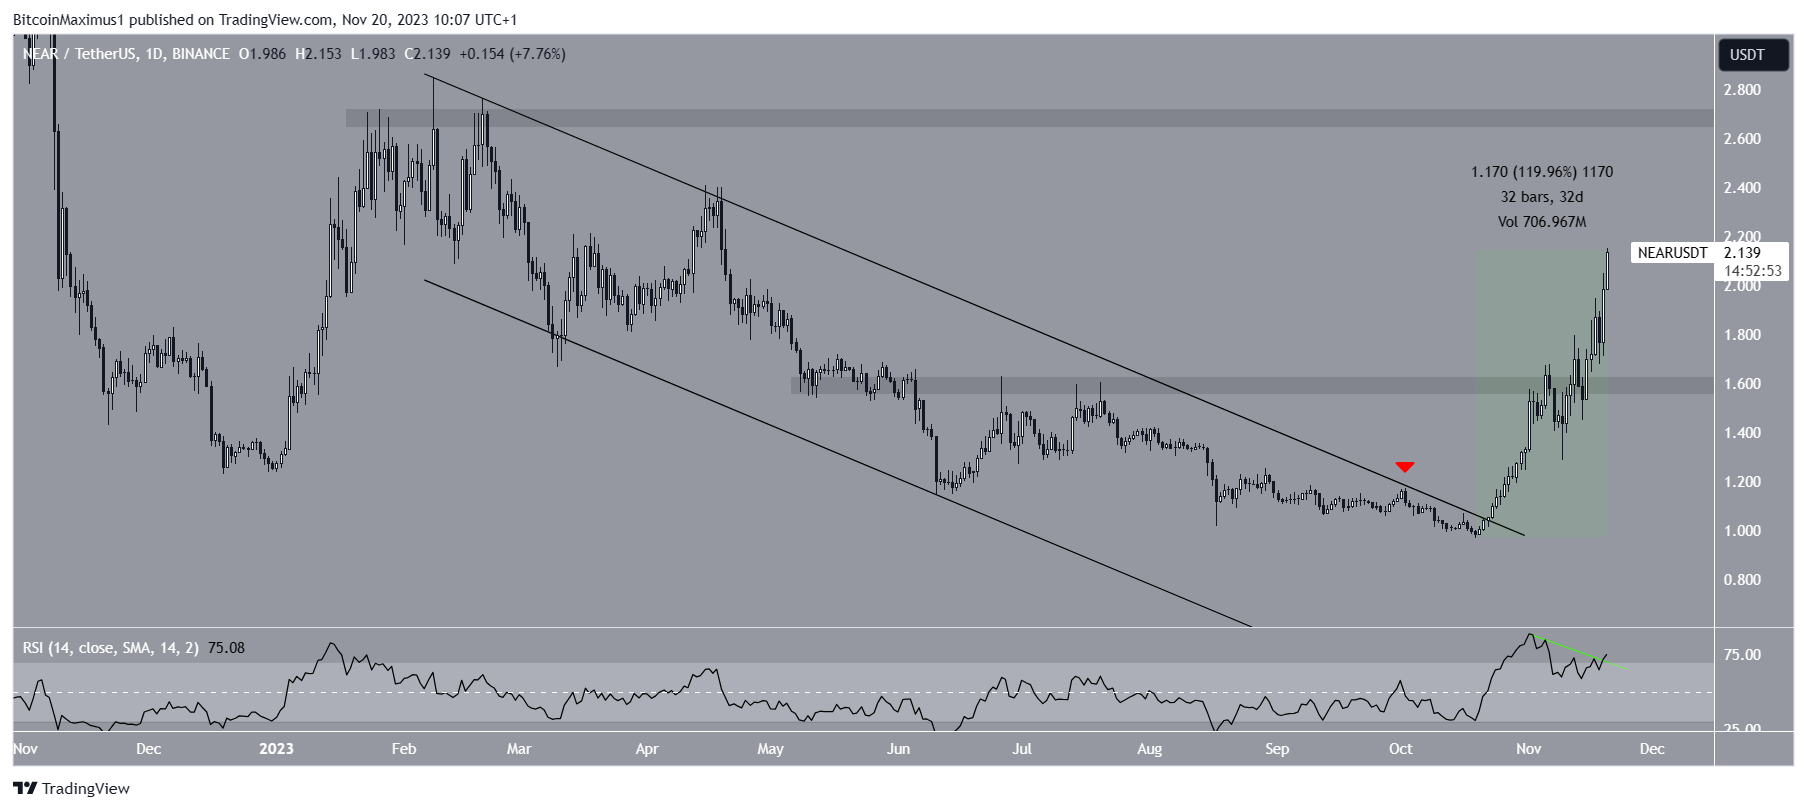
Market traders use the Relative Strength Index (RSI) as a momentum indicator to identify overbought or oversold conditions and to decide whether to accumulate or sell an asset.
Readings above 50 and an upward trend indicate that bulls still have an advantage, whereas readings below 50 suggest the opposite.
The weekly RSI is above 50 and increasing both positive signs. Also, the indicator broke out from its bearish divergence trend line (green).
Read More: 9 Best Crypto Demo Accounts For Trading
What Are Analysts Saying?
Cryptocurrency traders on X are bullish for the future NEAR price prospects.
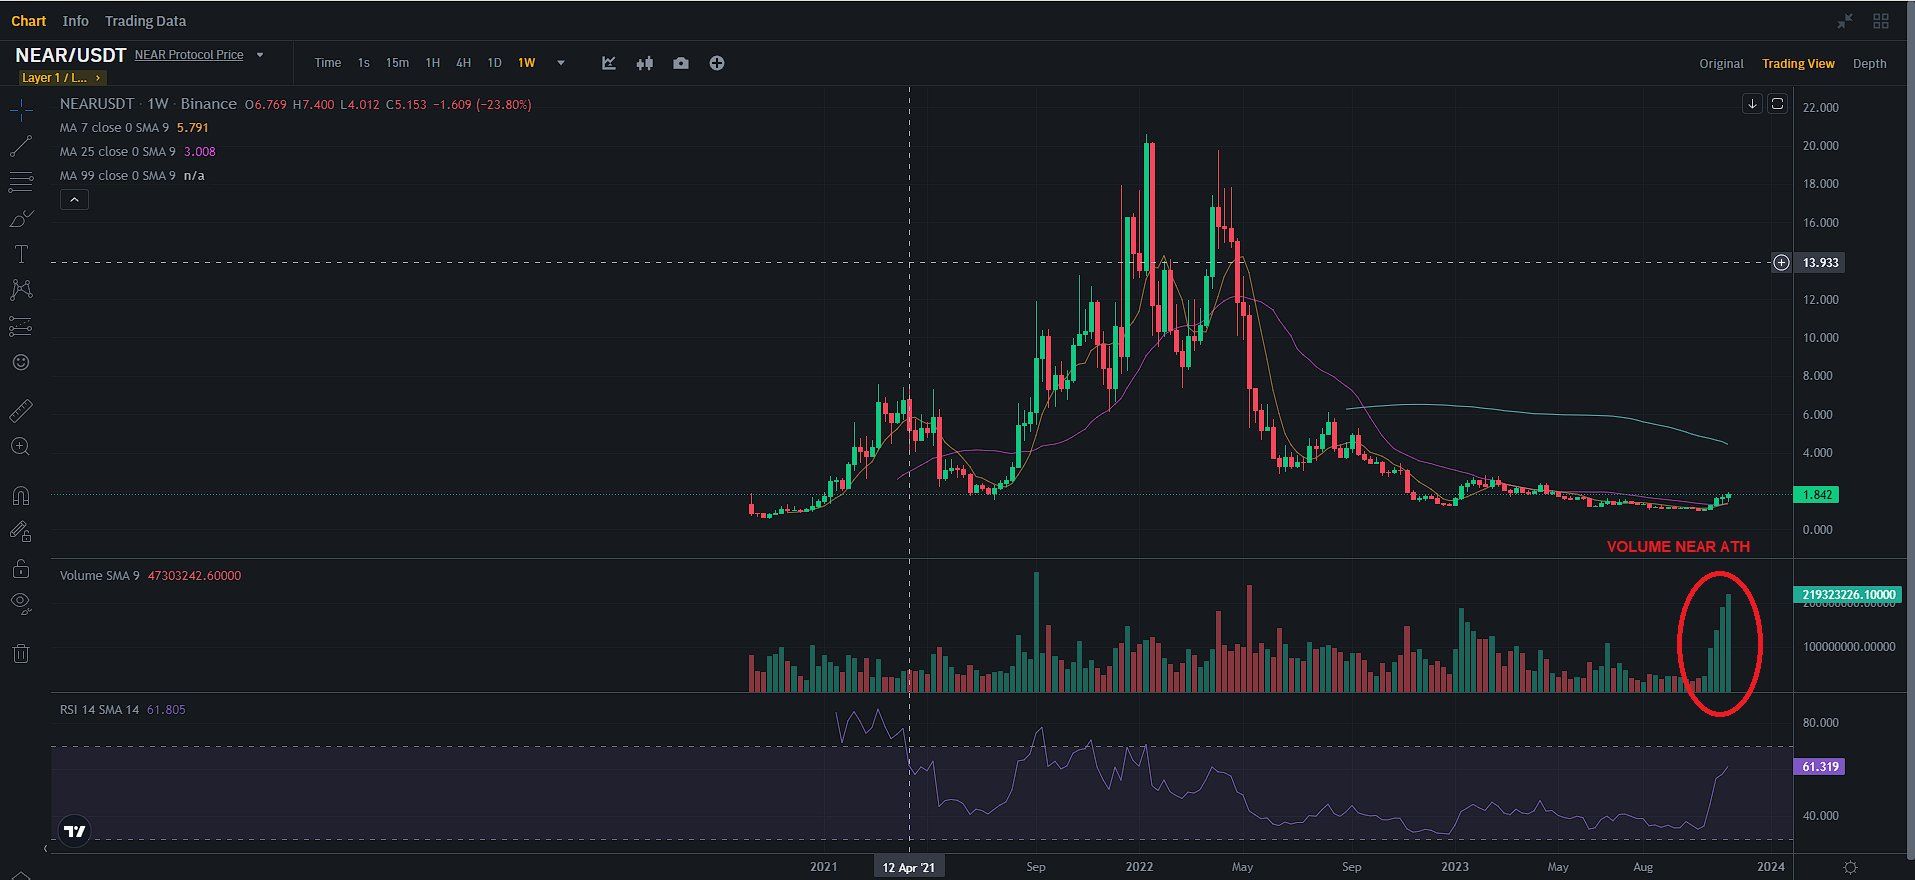
Investmox noticed a significant increase in long-term volume, which he believes will precede a similar increase in price.
Trader Fred is also bullish, outlining a short-term uptrend that he believes will continue.
On the other hand, Baba is not as bullish about the future short-term trend. He stated that
We are in the middle of a strong resistance zone with a clearly identified overbought on the $NEAR token of #NEARProtocol
But we can already speculate that the options available to us are: – Either we accumulate in this area and we look for the next resistance around $1.9 and we continue the race – Either we retrace on this zone and then look for a more distant resistance around $2.1
NEAR Price Prediction: Yearly High Within Reach?
The weekly chart supports the continuation of the NEAR price increase. The chart shows that the altcoin also broke out from a 440-day descending resistance trend line.
A significant bullish divergence in the weekly RSI preceded the increase. Such a divergence occurs when a momentum increase accompanies a price decrease. It often leads to bullish trend reversals.
The fact that the RSI is now above 50 further supports this possibility. The main resistance area is at $2.70. If NEAR breaks out above it, it can increase by 150% to the next resistance at $5.50.
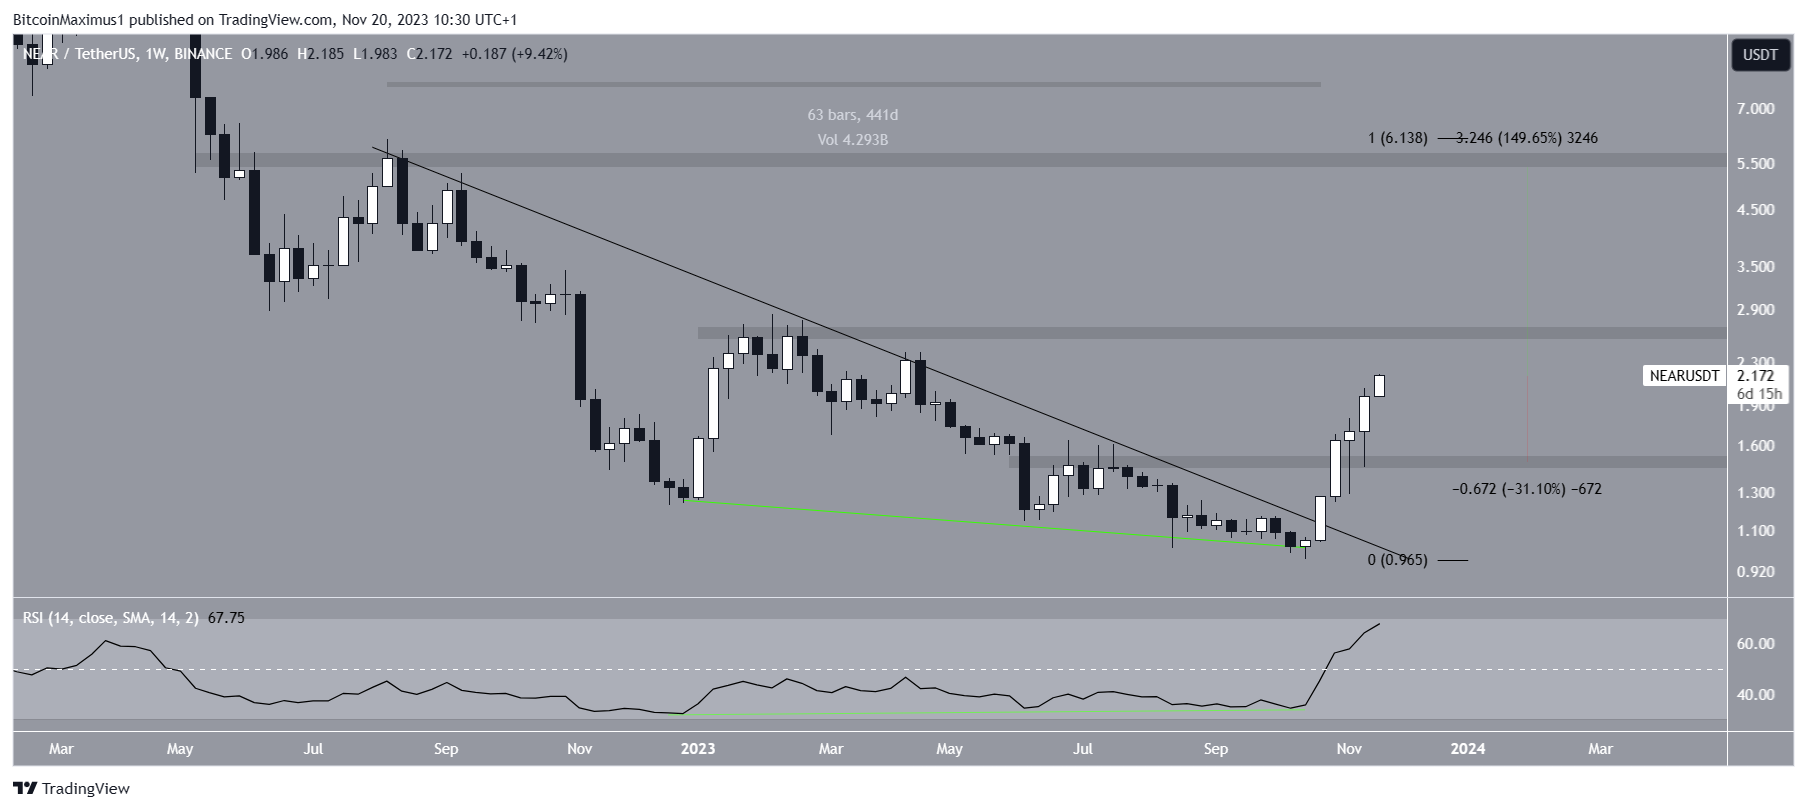
Despite this bullish NEAR price prediction, a rejection from the $2.70 resistance area can lead to a 30% drop to the closest support at $1.50.
For BeInCrypto’s latest crypto market analysis, click here.


